. 2018 Mar 22;9(1):1188.
doi: 10.1038/s41467-018-03523-2.

An AP-MS- and BioID-compatible MAC-tag enables comprehensive mapping of protein interactions and subcellular localizations

Affiliations

An AP-MS- and BioID-compatible MAC-tag enables comprehensive mapping of protein interactions and subcellular localizations

Xiaonan Liu et al. Nat Commun. .

Abstract

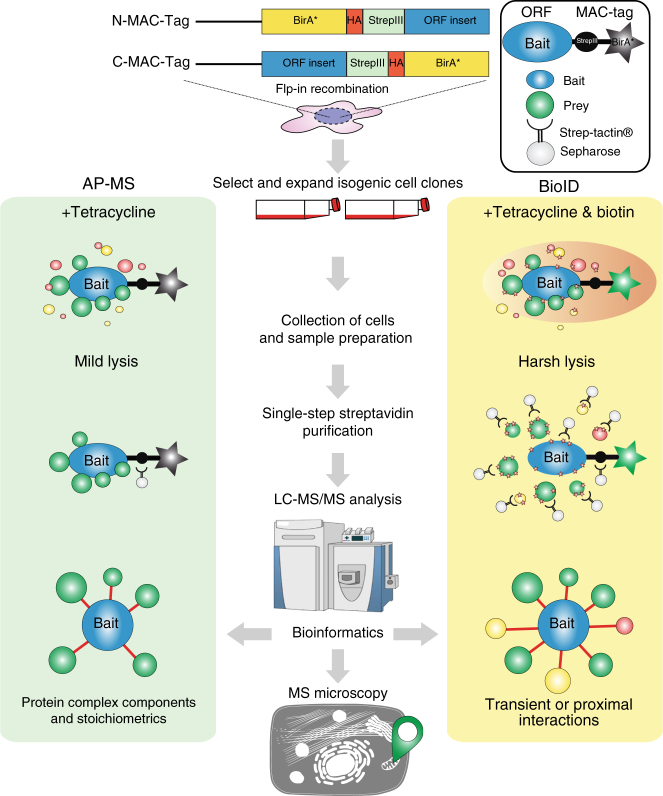
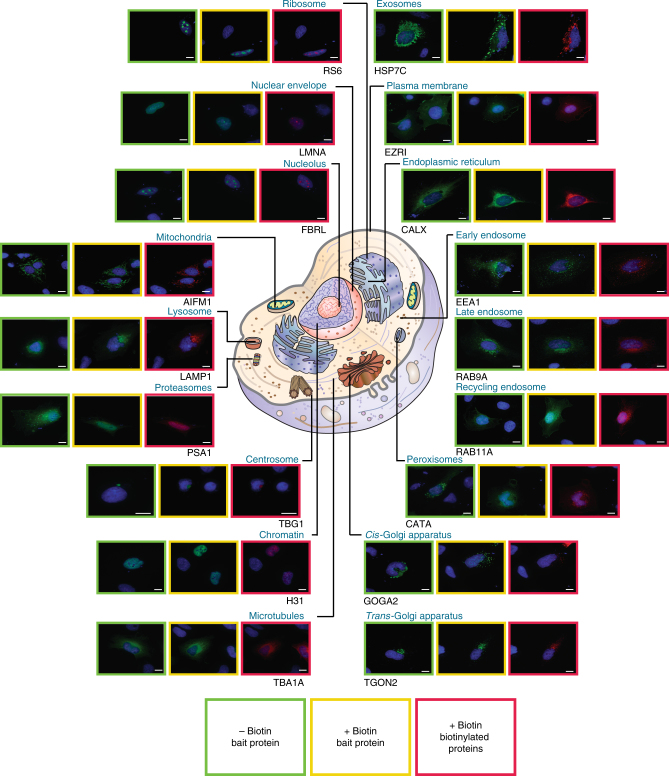
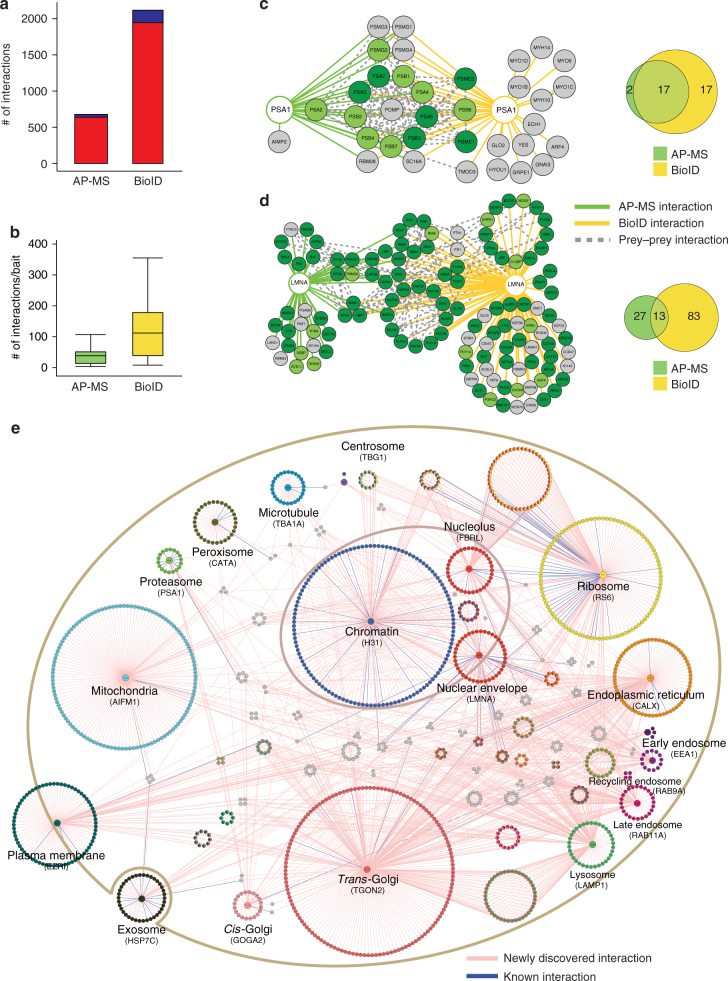
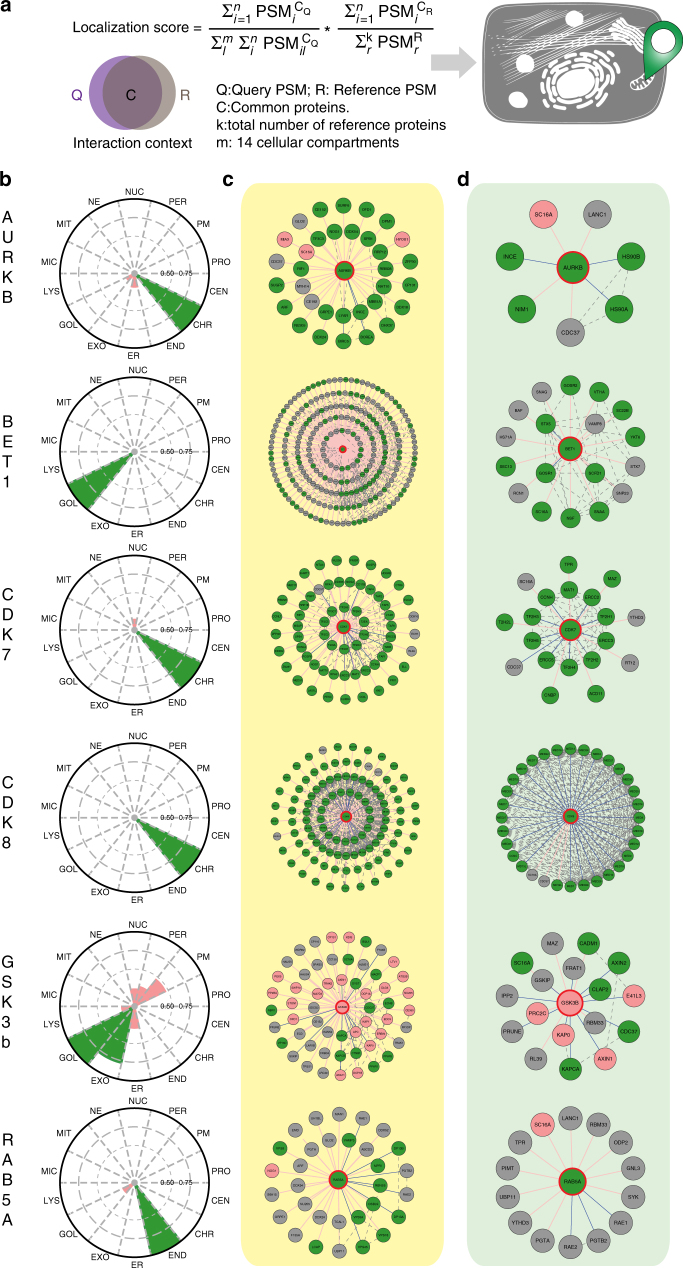
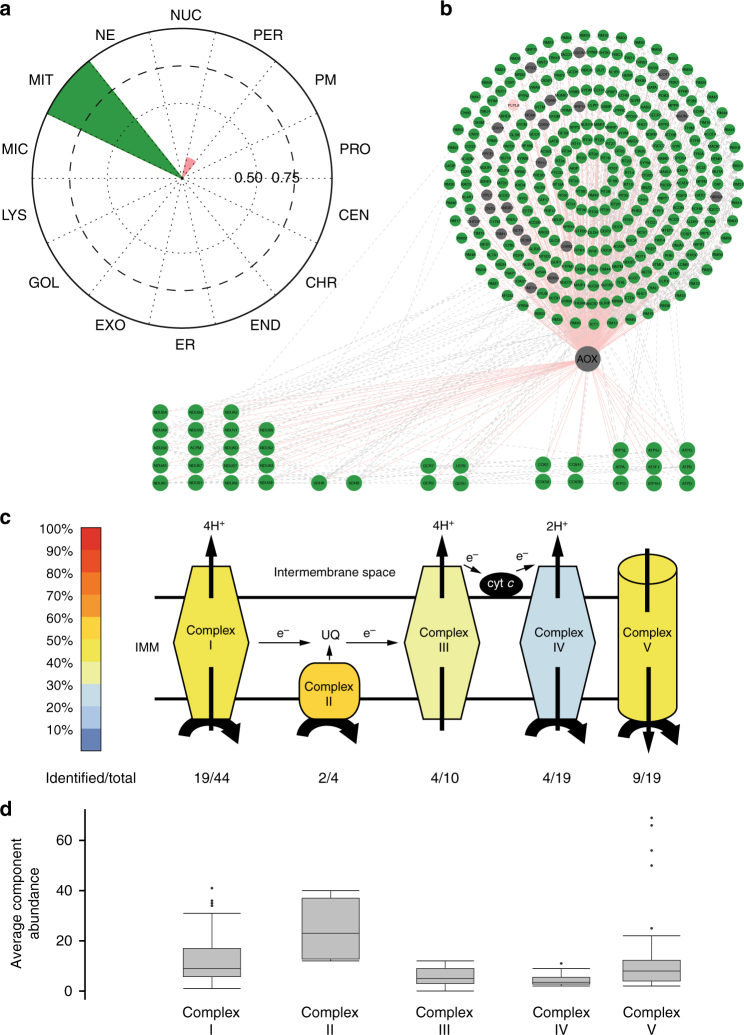
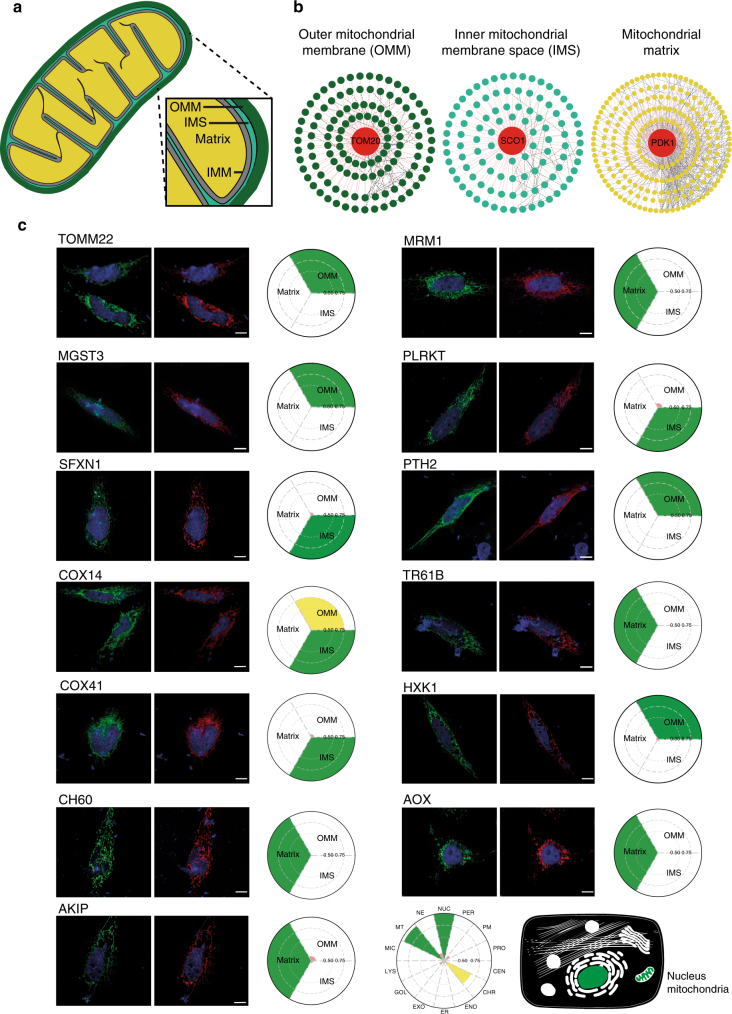
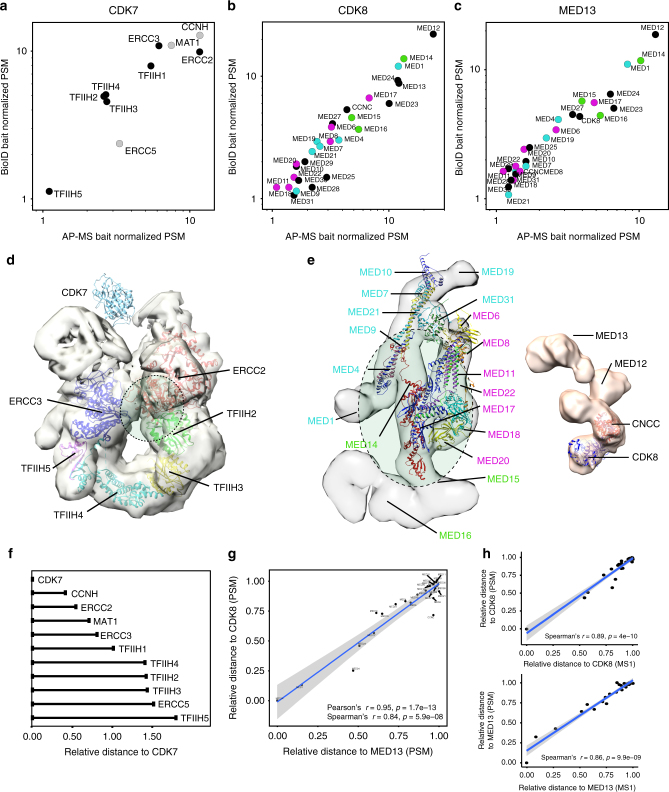
Protein-protein interactions govern almost all cellular functions. These complex networks of stable and transient associations can be mapped by affinity purification mass spectrometry (AP-MS) and complementary proximity-based labeling methods such as BioID. To exploit the advantages of both strategies, we here design and optimize an integrated approach combining AP-MS and BioID in a single construct, which we term MAC-tag. We systematically apply the MAC-tag approach to 18 subcellular and 3 sub-organelle localization markers, generating a molecular context database, which can be used to define a protein's molecular location. In addition, we show that combining the AP-MS and BioID results makes it possible to obtain interaction distances within a protein complex. Taken together, our integrated strategy enables the comprehensive mapping of the physical and functional interactions of proteins, defining their molecular context and improving our understanding of the cellular interactome.


Conflict of interest statement

The authors declare no competing interests.

Figures

Fig. 1
Fig. 1
MAC-tag-based workflow for identification of protein complexes and interactions. Gateway compatible MAC-tag destination vectors containing StrepIII, HA and BirA* were designed to allow the gene of interest either C-terminal or N-terminal tagging. The expression vector can then be transfected into Flp-In T-REx 293 to establish the transgenic stably and inducible expressing isogenic cell lines. For the AP-MS and BioID analysis approaches, the cell line is separated into two cultures, BioID cells receiving addition of 50 μM biotin in their culture medium. In the following protein extraction process, optimized lysis and affinity purification conditions for both analysis approaches were used. The interacting proteins were then analyzed by quantitative mass spectrometry and high-confidence interaction proteins (HCIPs) were inferred via stringent statistical filtering. This integrated workflow allows laborless generation of cellular material for analyses, and results in integrated view of the formed protein complexes, protein-protein interactions and detailed molecular context definition
Fig. 2
Fig. 2
Fluorescence microscopy analysis of the cellular localization markers. The 18 subcellular localization markers fused with MAC-tag were visualized by immunofluorescence staining using Alexa Fluor 488 labeled anti-HA immunostaining (green), their in vivo biotinylated interactors with Alexa Fluor 594 streptavidin (red), and cell nuclei with DAPI (blue) (Scale bar: 10 μm)
Fig. 3
Fig. 3
Generation of comprehensive interactome maps for the bona fide cellular markers. The 18 localization markers we subjected to our integrated analysis, resulting in identification of 679 HCIs from the AP-MS and 2118 HCIs from BioID analysis. a The distribution of the number of known (blue) and newly identified (red) interactions within 18 bona fide subcellular organelle/structure markers, illustrate the need for systematic analyses. b The distribution of the number of interactions per localization marker by AP-MS or BioID purification approach shows similar distribution of connectivity as other publications using these approaches individually. Boxplots show the median, the 25th and 75th percentile, Tukey whiskers (median ± 1.5IQR). c, d The protein-protein interaction network and molecular context for proteasome organelle marker (PSA1) and nuclear envelope (LMNA). The HCIs that were identified from AP-MS (green line) and BioID (yellow line) are shown together with the known prey-prey interactions (dashed gray line). The nodes are color-coded based on the localization rank obtained from the CellWhere database (key: dark green = primary cellular localization for the corresponding protein, light green = possible localization, gray = different or no localization assigned for the protein). The Venn diagram highlights the complementary nature of the AP-MS and BioID approaches. e The reference molecular context map for the 18 subcellular organelles/structures. The unique high-confidence interactors from the BioID analysis are arranged in a circle around the corresponding localization marker and the shared interactors are shown with corresponding colors representing multiple localizations. Preys with more than four subcellular localizations are shown in gray color. The newly identified interactions are shown in pink edges and the known interactions with blue
Fig. 4
Fig. 4
Molecular level localization mapping using the reference molecular context maps. a The schematic overview of the MS microscopy approach to assess the queried protein localization using our reference interaction context. b The polar plot shows the location of query protein observed by MS microscopy. Each sector represents one subcellular location defined by our reference database. The color assigned to each of the localization is based on the annotation frequency (Pink: 0–0.5; Yellow: 0.5–0.75; Green: 0.75–1). c, d The PPI network obtained from BioID and AP-MS are shown separately. The localization of prey proteins was verified by CellWhere database. Node color scheme coordinates the observation localization from Fig. 4b
Fig. 5
Fig. 5
AOX localizes to inner mitochondrial membrane and in the vicinity of complex II. a The AOX from Ciona Intestinalis, was introduced to human cells and the MS microscopy assigns the AOX to localize to mitochondria. b The BioID approach identifies 333 interactions of which 93.1% (310) were mitochondrial (green), 0.3% (1) was peroxisomal (pink) and 6.6% (22) were unassigned (gray), based on CellWhere database. c Total of 38 of the interactors were components of the mitochondrial respiratory chain complexes (complex I- V, key: color gradient indicates the percentage of proteins of the each individual complexes identified). d The average component abundance shows that the AOX associates most with the complex II, which is in agreement with the AOX suggested functional role. Boxplots show the median, the 25th and 75th percentile, Tukey whiskers (median ± 1.5IQR) and outliers (.)
Fig. 6
Fig. 6
Sub-organelle level molecular context map of the mitochondria. a Mitochondrion can be divided to four compartments, namely to the outer mitochondrial membrane (dark green), inner mitochondrial space (light green), inner mitochondrial membrane (gray) and the mitochondrial matrix (yellow). b The three mitochondrial proteins, TOM20, SCO1 and PDK1, used for generation of the mitochondrial sub-organelle molecular context map, with their PPI network obtained from the BioID (key: the interacting proteins are colored according to their corresponding bait mitochondrial location. Known (blue), newly identified (red) and prey-prey (black dashed line) interactions are color-coded). c Confocal microscopy analysis fails to provide sub-organelle level information of mitochondrial protein, whereas MS microscopy allows assigning the proteins within mitochondrial compartments. Confocal microscopy (HC PL APO 93×/1.30 GLYC motCORR) was applied to observe the mitochondrial localization MAC-tagged mitochondrial proteins. The MAC-tagged bait proteins are visualized with anti-HA immunostaining (green), nucleus with DAPI (blue), and mitochondria by co-transfection with pDsRed-Mito vector (red), Scale bar: 10 μm. The MS microscopy analysis and the resulting polar plots assign the mitochondrial proteins to their corresponding mitochondrial compartments. The color assigned to each sub-organelle location is based on the annotation frequency (green: 0.75–1; yellow: 0.5–0.75; pink: 0–0.5)
Fig. 7
Fig. 7
Characterization of interaction distances by integration of MAC-tag data. ac Distance based topology of protein complexes. The AP-MS and BioID data was blotted based on the bait normalized prey abundances and the correlated data was used to derive interaction distances for CDK7 and the TFIIH complex, as well as for CDK8 and MED13 with the Mediator complex. The CDK7 formed CAK-complex components are shown in gray and the Mediator complex components assigned to the Head (magenta), the Middle (cyan) and the Tail (green) are color-coded. d, e The derived interaction distances for CDK7, CDK8 and the MED13 are fitted into EM derived complex structures and suggested fitted interaction surface is shown in green dashed line ellipses. The color-coding in e corresponds with b, c. f Relative distances for bait protein and the other complex components can be calculated. (g, h) The calculated relative distances (using either PSM or MS1 intensity values) derived from the integrated AP-MS and BioID data results to extremely high correlation (Pearson’s and Spearman’s) and p-value as indicated (t-test) for CDK8 and MED13, two neighboring units in the Mediator kinase module

Similar articles

Cited by

References

    1. Dunham WH, Mullin M, Gingras AC. Affinity-purification coupled to mass spectrometry: basic principles and strategies. Proteomics. 2012;12:1576–1590. doi: 10.1002/pmic.201100523. - DOI - PubMed
    1. Varjosalo M, et al. Interlaboratory reproducibility of large-scale human protein-complex analysis by standardized AP-MS. Nat. Methods. 2013;10:307–314. doi: 10.1038/nmeth.2400. - DOI - PubMed
    1. Einhauer A, Jungbauer A. The FLAG peptide, a versatile fusion tag for the purification of recombinant proteins. J. Biochem. Biophys. Methods. 2001;49:455–465. doi: 10.1016/S0165-022X(01)00213-5. - DOI - PubMed
    1. Bornhorst JA, Falke JJ. Purification of proteins using polyhistidine affinity tags. Methods Enzymol. 2000;326:245–254. doi: 10.1016/S0076-6879(00)26058-8. - DOI - PMC - PubMed
    1. Kolodziej PA, Young RA. Epitope tagging and protein surveillance. Methods Enzymol. 1991;194:508–519. doi: 10.1016/0076-6879(91)94038-E. - DOI - PubMed

Publication types