. 2018 Apr 1;9(4):431.
doi: 10.1038/s41419-018-0415-2.

Deregulation of ATG9A by impaired AR signaling induces autophagy in prostate stromal fibroblasts and promotes BPH progression

Affiliations

Deregulation of ATG9A by impaired AR signaling induces autophagy in prostate stromal fibroblasts and promotes BPH progression

Chen-Yi Jiang et al. Cell Death Dis. .

Abstract

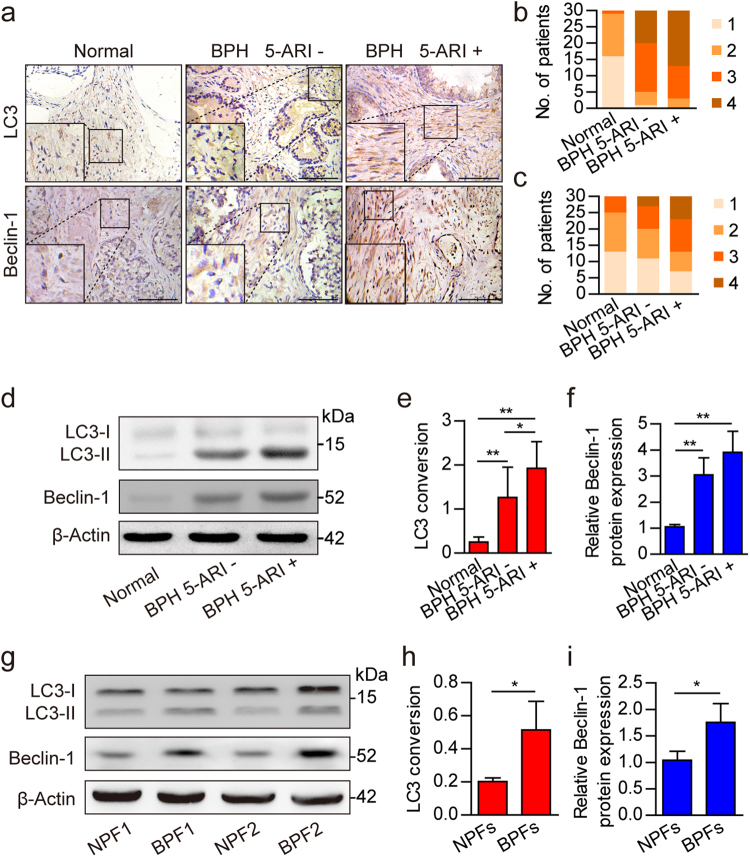
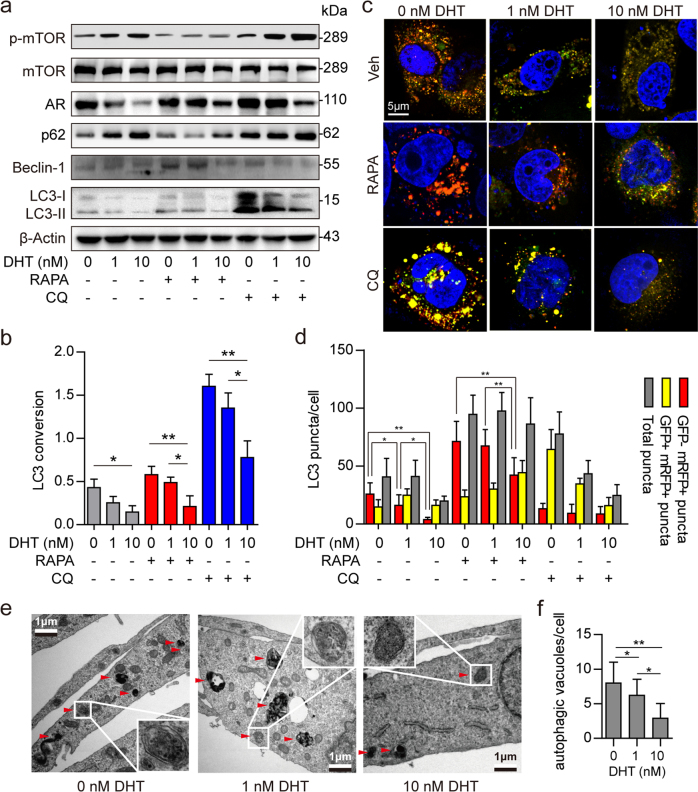
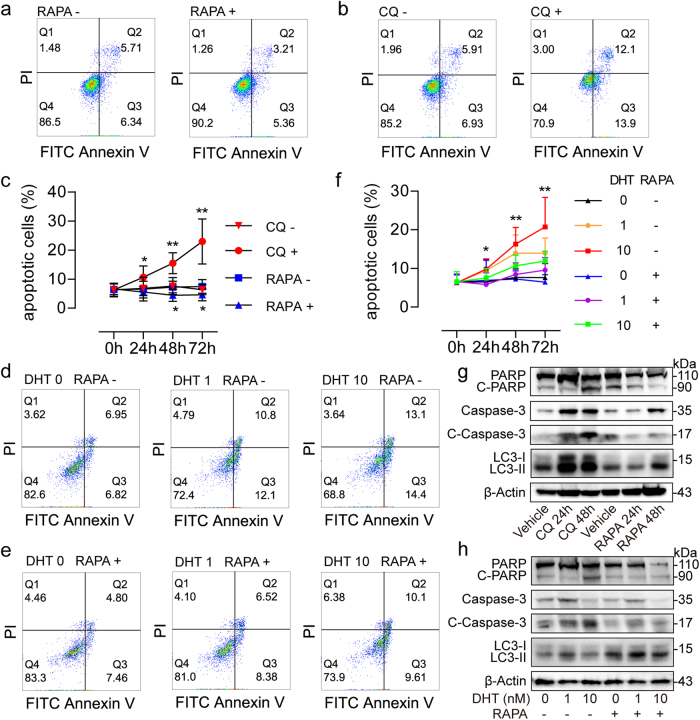
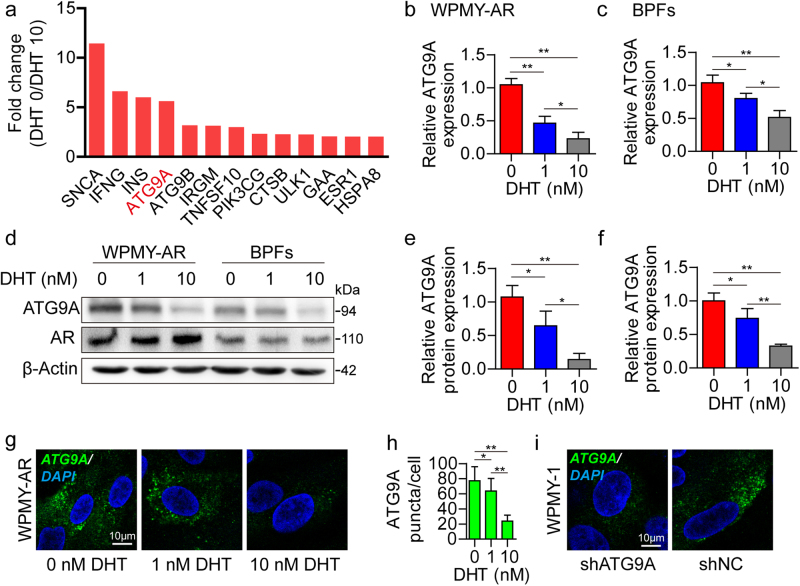
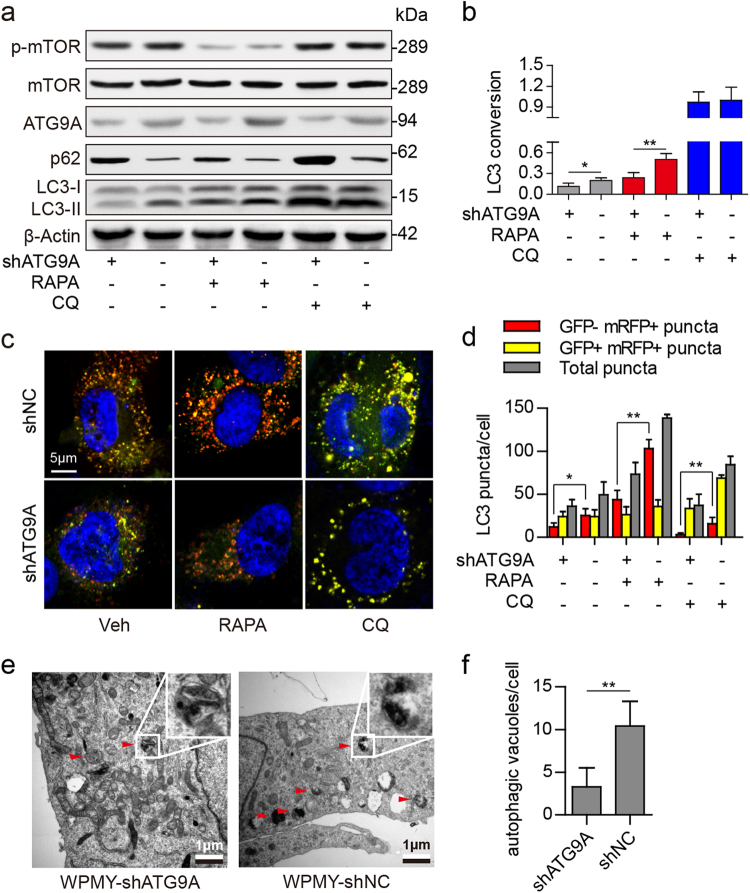
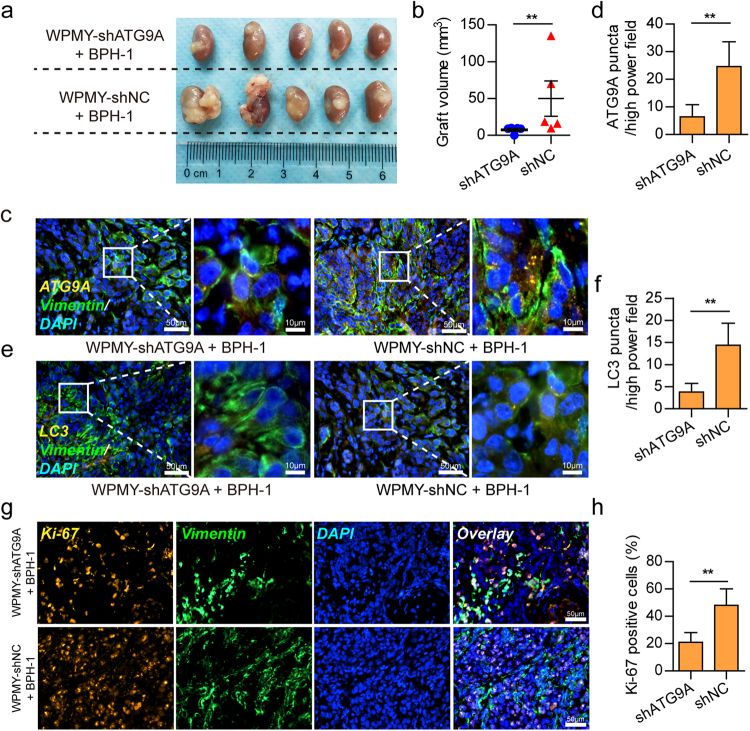
The activation of androgen receptor (AR) signaling plays an essential role in both prostate stromal cells and epithelial cells during the development of benign prostatic hyperplasia (BPH). Here we demonstrated that androgen ablation after 5α-reductase inhibitor (5-ARI) treatment induced autophagy in prostate stromal fibroblasts inhibiting cell apoptosis. In addition, we found that ATG9A expression was increased after androgen ablation, which facilitated autophagic flux development. Knockdown of ATG9A not only inhibited autophagy notably in prostate stromal fibroblasts, but also reduced the volumes of prostate stromal fibroblast and epithelial cell recombinant grafts in nude mice. In conclusion, our findings suggested that ATG9A upregulation after long-term 5-ARI treatment constitutes a possible mechanism of BPH progression. Thus, combined treatment with 5-ARI and autophagy inhibitory agents would reduce the risk of BPH progression.


Conflict of interest statement

The authors declare that they have no conflict of interest.

Figures

Fig. 1
Fig. 1. Expression levels of autophagy-related proteins in normal prostate and BPH tissues.
a Immunohistochemistry results showing LC3 and Beclin-1 expression levels in normal prostate and BPH tissues after 5-ARI treatment (5-ARI+) or without 5-ARI treatment (5-ARI−). Scale bar, 100 μm. b, c Bar graphs showing patient stratification by stromal LC3 and Beclin-1 expression scores in each group. d Western blot data showing the LC3 conversion ratio (LC3-II/β-Actin) (e) and relative Beclin-1 expression levels (f) in normal prostate and BPH tissues with or without 5-ARI treatment. g Western blot data showing the LC3 conversion ratio (LC3-II/β-Actin) (h) and relative Beclin-1 expression levels (i) in normal prostate fibroblasts (NPFs) and BPH derived prostate fibroblasts (BPFs). *P < 0.05, **P < 0.01
Fig. 2
Fig. 2. Androgen ablation induces autophagy in prostate stromal fibroblasts.
a Western blot data showing phospho-mTOR (p-mTOR), mTOR, AR, p62, and Beclin-1 expression levels and the LC3 conversion ratio (LC3-II/β-Actin) b in WPMY-AR cells. The cells were cultured with 0, 1, and 10 nM DHT, respectively, for 48 h, and treated with 50 nM RAPA or 50 μM CQ for 3 h before protein extraction. c, d WPMY-AR cells were infected with mRFP–GFP–LC3 adenovirus and cultured with 0, 1, and 10 nM DHT, respectively, for 48 h, and treated with 50 nM RAPA or 50 μM CQ for 3 h before 4% paraformaldehyde fixation and DAPI counterstaining. Scale bar, 5 μm. Bar graph showing LC3 puncta formation in different groups. e, f Transmission electron micrographs for detecting autophagic vacuoles in WPMY-AR cells cultured with 0, 1 and 10 nM DHT for 48 h, respectively, and treated with 50 nM RAPA for 3 h before 2% glutaraldehyde fixation. Enlarged images show double-membrane autophagic vacuoles. Scale bar, 1 μm. *P < 0.05, **P < 0.01
Fig. 3
Fig. 3. Apoptosis analyses in prostate stromal fibroblasts.
a Annexin V/PI flow cytometry results showing different apoptotic rates of WPMY-1 cells treated with 50 nM RAPA (RAPA+) or without RAPA (RAPA-) for 48 h. b Annexin V/PI flow cytometry data showing different apoptotic rates of WPMY-1 cells treated with 50 μM CQ (CQ+) or without CQ (CQ−) for 48 h. c Time kinetic curves showing that percentages of Annexin V+/PI− apoptotic WPMY-1 cells changed after 50 nM RAPA or 50 μM CQ treatment for 24, 48, and 72 h, respectively. d, e Annexin V/PI flow cytometry results showing different apoptotic rates of WPMY-AR cells cultured with 0 nM (DHT 0), 1 nM (DHT 1) and 10 nM (DHT 10) DHT, respectively, with 50 nM RAPA (RAPA+) or without RAPA (RAPA−) for 48 h. f Time kinetic curves showing that percentages of Annexin V+/PI− apoptotic WPMY-AR cells changed after treatment with DHT plus 50 nM RAPA for 24, 48, and 72 h, respectively. g Western blot data showing expression change of PARP, cleaved PARP (C-PARP), Caspase-3, and cleaved Caspase-3 (C-Caspase-3) levels as well as LC3 conversions in WPMY-1 cells after 50 μM CQ or 50 nM RAPA treatment for 24 and 48 h. h Western blot results showing expression change of PARP, C-PARP, Caspase-3, and C-Caspase-3 levels as well as LC3 conversions in WPMY-AR cells after treatment with different concentrations of DHT and RAPA (50 nM) treatment for 48 h. *P < 0.05, **P < 0.01
Fig. 4
Fig. 4. ATG9A expression change in prostate stromal fibroblasts after DHT treatment.
a PCR array data showing fold change of differentially expressed ATG genes in WPMY-AR cells cultured with 0 nM DHT vs. 10 nM DHT (DHT 0/DHT 10). b, c qRT-PCR data showing ATG9A mRNA expression levels in WPMY-AR cells or BPFs after treatment with 0, 1, and 10 nM DHT for 48 h, respectively. d Western blot data showing ATG9A and AR protein expression levels in WPMY-AR cells (e) or BPFs (f) after treatment with 0, 1, and 10 nM DHT treatment for 48 h, respectively. g, h Immunofluorescent images showing ATG9A puncta accumulation in WPMY-AR cells treated with 0, 1, and 10 nM DHT, respectively. i Immunofluorescent images showing ATG9A puncta accumulation in WPMY-1 cells after knockdown of ATG9A (shATG9A). Scale bar, 10 μm. *P < 0.05, **P < 0.01
Fig. 5
Fig. 5. Autophagy in prostate stromal fibroblasts after ATG9A knockdown.
a, b Western blot data showing phospho-mTOR (p-mTOR), mTOR, ATG9A, and p62 protein expression levels and the LC3 conversion ratio (LC3-II/β-Actin) in WPMY-1 cells after ATG9A knockdown. The cells were treated with 50 nM RAPA or 50 μM CQ for 3 h before protein extraction. c, d ATG9A knockdown WPMY-1 cells were infected with mRFP–GFP–LC3 adenovirus for 48 h, and treated with 50 nM RAPA or 50 μM CQ for 3 h before 4% paraformaldehyde fixation and DAPI counterstaining. Scale bar, 5 μm. Bar graphs showing LC3 puncta formation in different groups. e, f Transmission electron micrographs for autophagic vacuoles detection in ATG9A knockdown WPMY-1 (WPMY-shATG9A) or control (WPMY-shNC) cells. The cells were treated with 50 nM RAPA for 3 h before 2% glutaraldehyde fixation. Enlarged images show double-membrane autophagic vacuoles. Scale bar, 1 μm. *P < 0.05, **P < 0.01
Fig. 6
Fig. 6. Prostatic epithelial cell and stromal fibroblast recombination under the renal capsule in nude mice.
a, b Recombinant grafts in each group. The shATG9A group (WPMY-shATG9A+BPH-1) showed reduced volumes of recombinant grafts compared with the control group (WPMY-shNC+BPH-1). c, d Immunofluorescent images showing ATG9A and Vimentin signals in the recombinant grafts of different groups. Bar graph showing the numbers of ATG9A puncta per high power field in different groups. e, f Immunofluorescent images showing LC3 and Vimentin signals in recombinant grafts of different groups. Bar graph showing the numbers of LC3 puncta per high power field in different groups. g, h Immunofluorescent images showing Ki-67 and Vimentin signals in recombinant grafts of different groups. Bar graph showing proportions of Ki-67 positive cells in different groups. Scale bar, 50 μm in low power images or 10 μm in high-power images. **P < 0.01

Similar articles

Cited by

References

    1. Xia SJ, Cui D, Jiang Q. An overview of prostate diseases and their characteristics specific to Asian men. Asian J. Androl. 2012;14:458. doi: 10.1038/aja.2010.137. - DOI - PMC - PubMed
    1. Jiang CY, et al. MiR-185 attenuates androgen receptor function in prostate cancer indirectly by targeting bromodomain containing 8 isoform 2, an androgen receptor co-activator. Mol. Cell. Endocrinol. 2016;427:13–20. doi: 10.1016/j.mce.2016.02.023. - DOI - PubMed
    1. Singh M, et al. Stromal androgen receptor in prostate development and cancer. Am. J. Pathol. 2014;184:2598–2607. doi: 10.1016/j.ajpath.2014.06.022. - DOI - PMC - PubMed
    1. Nacusi LP, Tindall DJ. Targeting 5alpha-reductase for prostate cancer prevention and treatment. Nat. Rev. Urol. 2011;8:378–384. doi: 10.1038/nrurol.2011.67. - DOI - PMC - PubMed
    1. Pirozzi L, et al. Current pharmacological treatment for male LUTS due to BPH: dutasteride or finasteride? Curr. Drug. Targets. 2015;16:1165–1171. doi: 10.2174/1389450116666150518101617. - DOI - PubMed

Publication types

MeSH terms