. 2018 Mar 22;8(1):5007.
doi: 10.1038/s41598-018-23168-x.

Identification of p38 MAPK as a novel therapeutic target for Friedreich's ataxia

Affiliations

Identification of p38 MAPK as a novel therapeutic target for Friedreich's ataxia

M Grazia Cotticelli et al. Sci Rep. .

Abstract

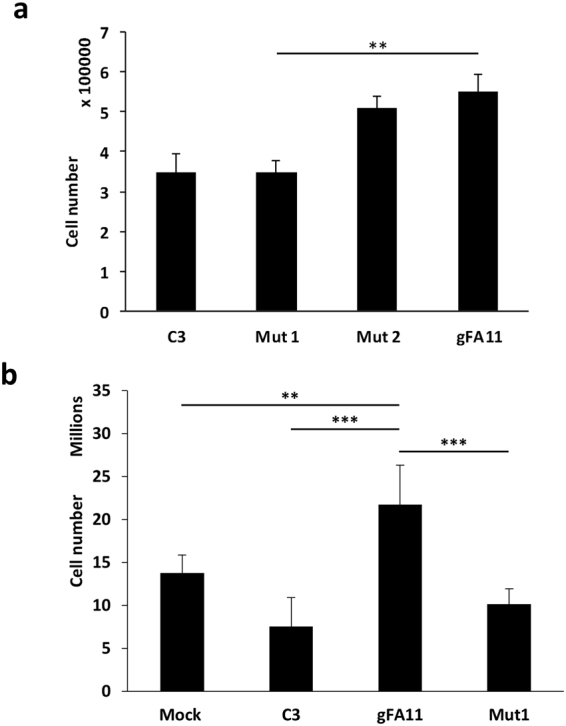
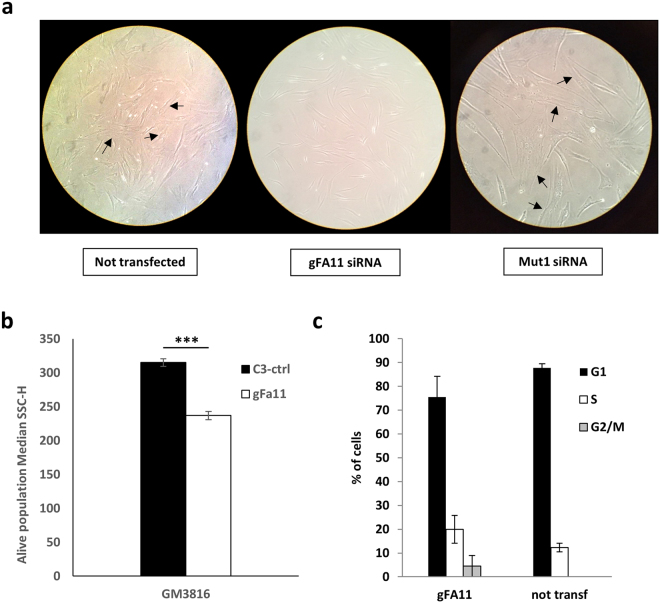
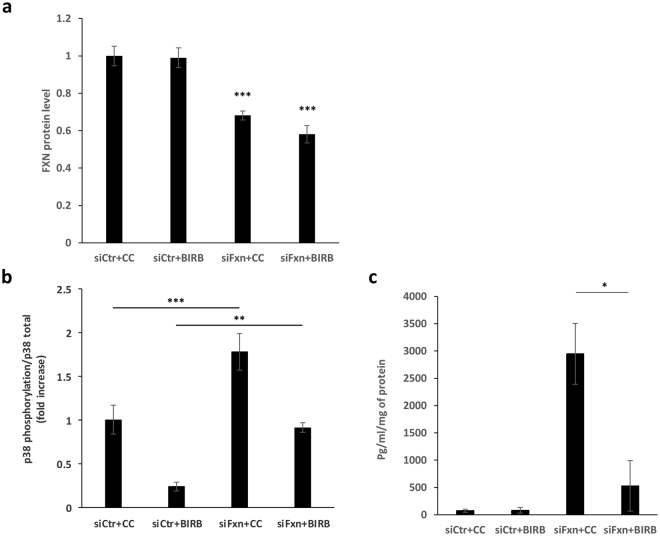
Friedreich ataxia (FRDA) is an autosomal recessive neuro- and cardio-degenerative disorder caused by decreased expression of frataxin, a protein that localizes to mitochondria and is critical for iron-sulfur-cluster (ISC) assembly. There are no proven effective treatments for FRDA. We previously screened a random shRNA library and identified a synthetic shRNA (gFA11) that reverses the growth defect of FRDA cells in culture. We now report that gFA11 decreases cytokine secretion in primary FRDA fibroblasts and reverts other changes associated with cell senescence. The gene-expression profile induced by gFA11 is remarkably similar to the gene-expression profile induced by the p38 MAPK inhibitor SB203580. We found that p38 phosphorylation, indicating activation of the p38 pathway, is higher in FRDA cells than in normal control cells, and that siRNA knockdown of frataxin in normal fibroblasts also increases p38 phosphorylation. Treatment of FRDA cells with p38 inhibitors recapitulates the reversal of the slow-growth phenotype induced by clone gFA11. These data highlight the involvement of the p38 MAPK pathway in the pathogenesis of FRDA and the potential use of p38 inhibitors as a treatment for FRDA.


Conflict of interest statement

Robert B. Wilson and Yongping Wang have patents, in conjunction with the University of Pennsylvania, related to the construction and methods of use of random shRNA-expressing libraries. M. Grazia Cotticelli, Shujuan Xia, Avinash Kaur, Yongping Wang, John W. Tobias, and Robert B. Wilson have a provisional patent application, in conjunction with the University of Pennsylvania, on the use of p38 inhibitors for the treatment of FRDA; this provisional patent was licensed to FA Therapeutics LLC, in which Robert B. Wilson has a 5% equity interest.

Figures

Figure 1
Figure 1
The sequences of gFA11 and variants. The DNA sequence encoding gFA11 is shown on the top line, with the loop sequence in bold. Below this are shown the siRNA sequences of gFA11 and its variants, Mut1 and Mut2, with the variant sequences of Mut1 and Mut2 in bold. Note that in both variants a C/G base-pair is changed to a G/C base-pair, which leaves the pair-bonding dynamics unchanged but would be expected to affect the target profile.
Figure 2
Figure 2
Partial loss of phenotype in seed-sequence variant of gFA11A. (a) Primary FRDA fibroblasts GM3816 were transfected with gFA11, Mut1, and Mut2 siRNAs (Fig. 1). The cells were transfected twice over 7 days. Cells were kept in DMEM + 5 mM BHB after the first transfection. **p < 0.01 by ANOVA with Tukey pair-wise comparisons. (b) Primary FRDA fibroblasts GM3816 were transfected with gFA11, Mut1, or control (C3) siRNA, or mock transfected, every 3–4 days for a total of four times over 14 days. Cells were kept in DMEM + 5 mM glucose throughout. **p < 0.01 and ***p < 0.005 by ANOVA with Tukey pair-wise comparisons. Error bars represent means ± 1 SD. The averages shown were calculated on three independent replicates and the results are representative of at least two independent experiments.
Figure 3
Figure 3
Alterations in cytokine secretion induced by gFA11. (a) Primary FRDA GM3816 fibroblasts were transfected in triplicate with gFA11 siRNA or Mut1 siRNA four times over twelve days. After the first transfection, the cells were grown in DMEM plus 5 mM BHB. At day 12, after the fourth transfection, cells were incubated with DMEM with BHB but without FBS. The following day, the medium was collected, concentrated, and analyzed by Luminex assay. Cytokine concentrations were normalized by cell numbers. (b) Primary FRDA GM3816 fibroblasts were infected with a gFA11-encoding vector or empty vector (E). Infected cells were selected with puromycin and expanded in glucose-based medium. Cells were then seeded at low density and kept in medium without FBS for 24 hours before collecting, concentrating, and analyzing the medium. *p < 0.05; **p < 0.01; ***p < 0.005 by Student’s t test. Error bars represent means ± 1 SD. The averages shown were calculated on three (a) or four (b) independent replicates and the results are representative of two independent experiments.
Figure 4
Figure 4
Effects of gFA11 on cell cycle and morphology. (a) Morphology of primary FRDA GM3816 fibroblasts transfected with gFA11 siRNA or Mut1 siRNA, or not transfected. Arrows indicate senescent-appearing cells. (b) Flow-cytometric side scattering (SSC) of GM3816 and GM3665B cells infected with a gFA11-encoding or control-encoding (C3) vector. ***p < 0.005 by Student’s t test. (c) Cell-cycle analysis of GM3816 cells, untransfected or transfected 4 times with gFA11 siRNA over two weeks. Error bars represent means ± 1 SD.
Figure 5
Figure 5
Activation of p38 MAP kinase in FRDA cells. (a) Frataxin protein levels (by ELISA) in normal control fibroblasts (6030) and primary FRDA fibroblasts (4675, 156, 4491, 203). ***p < 0.005 by ANOVA with Tukey pair-wise comparisons. (The aggregate p value comparing the normal control to the FRDA cells combined was less than 1 × 10-8). (b) p38 phosphorylation in the same cells as in (a) *p < 0.05 by ANOVA with Tukey pair-wise comparisons. (156 and 4491 cells grew extremely slowly and only two replicates were possible; the aggregate p value comparing the normal control to the FRDA cells combined was 0.008). (c) Frataxin protein levels (by ELISA) in normal control fibroblasts (6030) transfected with a random siRNA, C3 (siC3), a known toxic siRNA, C5 (siC5), or an siRNA to frataxin (siFXN) after one transfection (left bar) or two transfections (right bar). The decrease with siFXN was associated with p < 0.005 in both cases by Student’s t test. (d) p38 phosphorylation in the same cells as in (c) *p < 0.05; ***p < 0.005 by Student’s t test. Error bars represent means ± 1 SD. The averages shown were calculated on three independent replicates and the results are representative of at least two independent experiments.
Figure 6
Figure 6
p38 inhibitors increase the growth of FRDA cells in a dose-dependent manner. (a) p38 phosphorylation status in control GM8399 fibroblasts and FRDA GM3816 fibroblasts. ***p < 0.005 by Student’s t test. (b) Primary FRDA GM3816 fibroblasts treated every 48 h with the p38 inhibitor BIRB796 at the concentrations indicated. Cells were counted at day 14. **p < 0.01 relative to carrier control (CC) by ANOVA with Tukey pair-wise comparisons. (100 nM reached a p value of 0.051 relative to carrier control.) Error bars represent means ± 1 SD. (c) Primary FRDA GM3816 fibroblasts treated every 48 h with the p38 inhibitor BIRB796, at the concentrations indicated. Cells were counted at day 7. (d) Primary DL156 primary FRDA fibroblasts were treated every 48 h with the p38 inhibitor BIRB796, at a concentration of 500 nM. *p < 0.05 relative to carrier control (CC) by Student’s t test. **p < 0.01; ***p < 0.005; relative to carrier control (CC) by ANOVA with Tukey pair-wise comparisons. Error bars represent means ± 1 SD. In all experiments, the averages shown were calculated on three independent replicates and the results are representative of at least two independent experiments.
Figure 7
Figure 7
p38 phosphorylation is not sustained by cytokines. Primary apparently healthy fibroblasts GM8399 were transfected with FXN siRNA or a random control clone. Two hours after transfection, cells were incubated with DMEM without FBS in presence of 500 nM BIRB796 or carrier control. The following day, (a) frataxin protein levels, (b) p38 phosphorylation levels, and (c) IL-6 levels were measured by ELISA. **p < 0.01; ***p < 0.005 by ANOVA with Tukey pair-wise comparisons. Error bars represent means ± 1 SD. In all experiments, the averages shown were calculated on three independent replicates and the results are representative of at least two independent experiments.

Similar articles

Cited by

References

    1. Koeppen AH, Mazurkiewicz JE. Friedreich ataxia: neuropathology revised. J Neuropathol Exp Neurol. 2013;72:78–90. doi: 10.1097/NEN.0b013e31827e5762. - DOI - PMC - PubMed
    1. Collins A. Clinical neurogenetics: friedreich ataxia. Neurol Clin. 2013;31:1095–120. doi: 10.1016/j.ncl.2013.05.002. - DOI - PubMed
    1. Gomes CM, Santos R. Neurodegeneration in Friedreich’s ataxia: from defective frataxin to oxidative stress. Oxid Med Cell Longev. 2013;2013:487534. doi: 10.1155/2013/487534. - DOI - PMC - PubMed
    1. Haugen AC, et al. Altered gene expression and DNA damage in peripheral blood cells from Friedreich’s ataxia patients: cellular model of pathology. PLoS Genet. 2010;6:e1000812. doi: 10.1371/journal.pgen.1000812. - DOI - PMC - PubMed
    1. Bolinches-Amoros A, Molla B, Pla-Martin D, Palau F, Gonzalez-Cabo P. Mitochondrial dysfunction induced by frataxin deficiency is associated with cellular senescence and abnormal calcium metabolism. Front Cell Neurosci. 2014;8:124. - PMC - PubMed

Publication types

MeSH terms