

An integrated flow cytometry-based platform for isolation and molecular characterization of circulating tumor single cells and clusters
- PMID: 29568081
- PMCID: PMC5864750
- DOI: 10.1038/s41598-018-23217-5
An integrated flow cytometry-based platform for isolation and molecular characterization of circulating tumor single cells and clusters
Abstract
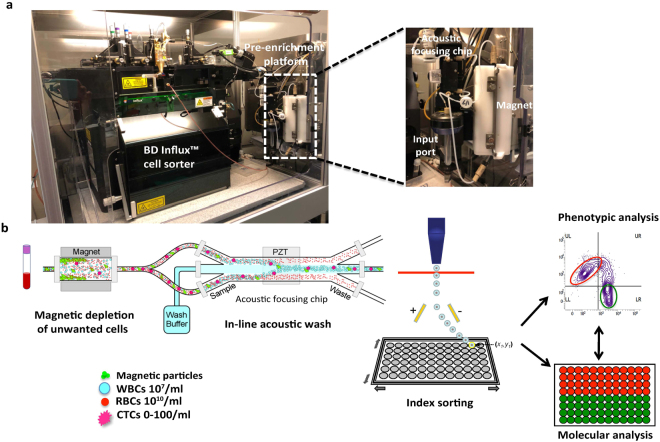
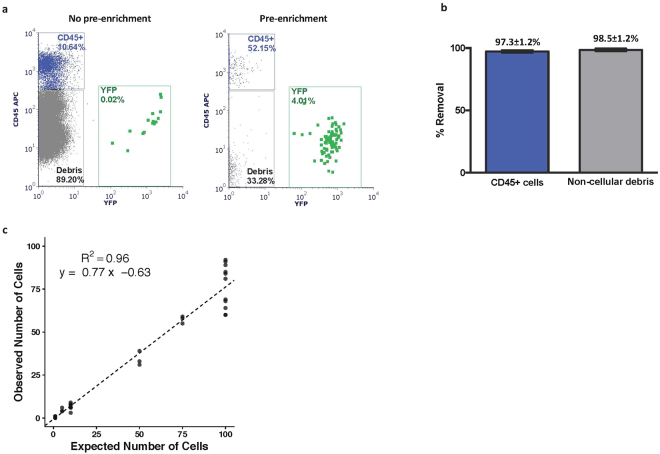
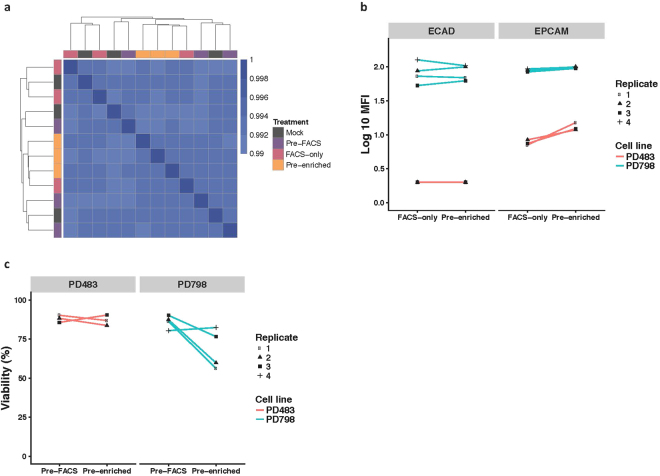
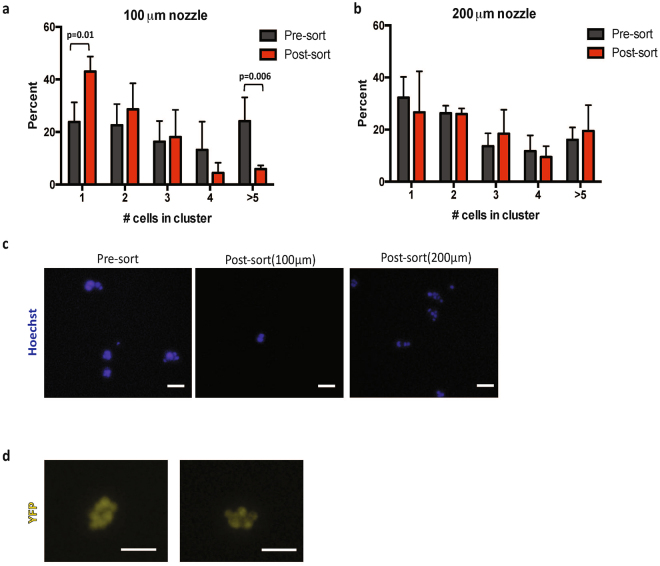
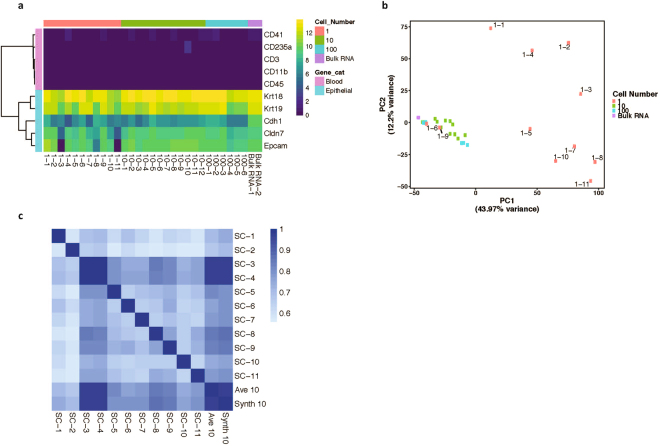
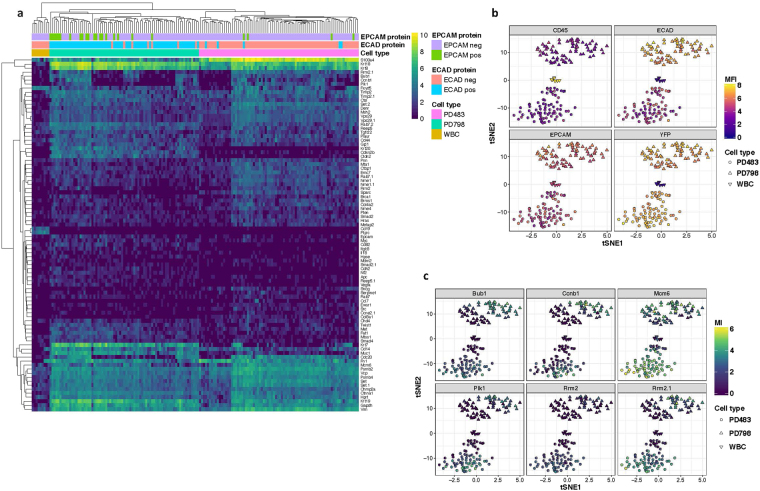
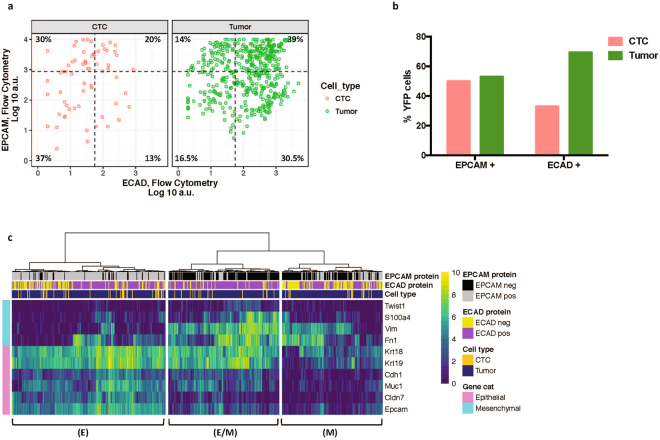
Comprehensive molecular analysis of rare circulating tumor cells (CTCs) and cell clusters is often hampered by low throughput and purity, as well as cell loss. To address this, we developed a fully integrated platform for flow cytometry-based isolation of CTCs and clusters from blood that can be combined with whole transcriptome analysis or targeted RNA transcript quantification. Downstream molecular signature can be linked to cell phenotype through index sorting. This newly developed platform utilizes in-line magnetic particle-based leukocyte depletion, and acoustic cell focusing and washing to achieve >98% reduction of blood cells and non-cellular debris, along with >1.5 log-fold enrichment of spiked tumor cells. We could also detect 1 spiked-in tumor cell in 1 million WBCs in 4/7 replicates. Importantly, the use of a large 200μm nozzle and low sheath pressure (3.5 psi) minimized shear forces, thereby maintaining cell viability and integrity while allowing for simultaneous recovery of single cells and clusters from blood. As proof of principle, we isolated and transcriptionally characterized 63 single CTCs from a genetically engineered pancreatic cancer mouse model (n = 12 mice) and, using index sorting, were able to identify distinct epithelial and mesenchymal sub-populations based on linked single cell protein and gene expression.
Conflict of interest statement
L.Y. along with others have a patent on the technology described here. K.D., F.T., L.W., E.P.D. are employees of BD. Technologies and Innovations. L.Y. and S.S. are employees of BD. Biosciences. E.L.C. receives research support from BD. Technologies and Innovations, EPIC Sciences, RareCyte, Menarini Silicon Biosystems and Illumina. N.B., C.H.P., W.D., M.S., D.B., S.S.Y., J.S.M. and B.Z.S. have no competing interests.
Figures
Similar articles
-
An integrated enrichment system to facilitate isolation and molecular characterization of single cancer cells from whole blood.Cytometry A. 2018 Dec;93(12):1226-1233. doi: 10.1002/cyto.a.23599. Cytometry A. 2018. PMID: 30549400 Free PMC article.
-
Rare Event Phenotyping and Molecular Characterization: Circulating Tumor Cells.Methods Mol Biol. 2019;2032:213-226. doi: 10.1007/978-1-4939-9650-6_13. Methods Mol Biol. 2019. PMID: 31522422
-
Optofluidic real-time cell sorter for longitudinal CTC studies in mouse models of cancer.Proc Natl Acad Sci U S A. 2019 Feb 5;116(6):2232-2236. doi: 10.1073/pnas.1814102116. Epub 2019 Jan 23. Proc Natl Acad Sci U S A. 2019. PMID: 30674677 Free PMC article.
-
Flow Cytometric Methods for Circulating Tumor Cell Isolation and Molecular Analysis.Adv Exp Med Biol. 2017;994:105-118. doi: 10.1007/978-3-319-55947-6_5. Adv Exp Med Biol. 2017. PMID: 28560670 Review.
-
Molecular characterization of circulating tumor cells-from bench to bedside.Semin Cell Dev Biol. 2018 Mar;75:88-97. doi: 10.1016/j.semcdb.2017.09.013. Epub 2017 Sep 9. Semin Cell Dev Biol. 2018. PMID: 28899718 Review.
Cited by
-
Flow Cytometric Analyses of Lymphocyte Markers in Immune Oncology: A Comprehensive Guidance for Validation Practice According to Laws and Standards.Front Immunol. 2020 Sep 17;11:2169. doi: 10.3389/fimmu.2020.02169. eCollection 2020. Front Immunol. 2020. PMID: 33042129 Free PMC article.
-
Deciphering the Biology of Circulating Tumor Cells through Single-Cell RNA Sequencing: Implications for Precision Medicine in Cancer.Int J Mol Sci. 2023 Aug 2;24(15):12337. doi: 10.3390/ijms241512337. Int J Mol Sci. 2023. PMID: 37569711 Free PMC article. Review.
-
Exploiting Single-Cell Tools in Gene and Cell Therapy.Front Immunol. 2021 Jul 12;12:702636. doi: 10.3389/fimmu.2021.702636. eCollection 2021. Front Immunol. 2021. PMID: 34322133 Free PMC article. Review.
-
Clinical Significance of Circulating Tumor Cells in Gastrointestinal Carcinomas.Diagnostics (Basel). 2020 Mar 30;10(4):192. doi: 10.3390/diagnostics10040192. Diagnostics (Basel). 2020. PMID: 32235479 Free PMC article. Review.
-
Tumor microenvironment complexity and therapeutic implications at a glance.Cell Commun Signal. 2020 Apr 7;18(1):59. doi: 10.1186/s12964-020-0530-4. Cell Commun Signal. 2020. PMID: 32264958 Free PMC article. Review.
References
-
- Cohen SJ, et al. Relationship of circulating tumor cells to tumor response, progression-free survival, and overall survival in patients with metastatic colorectal cancer. Journal of clinical oncology: official journal of the American Society of Clinical Oncology. 2008;26:3213–3221. doi: 10.1200/jco.2007.15.8923. - DOI - PubMed
Publication types
MeSH terms
Grants and funding
LinkOut - more resources
Full Text Sources
Other Literature Sources
Medical
Molecular Biology Databases
Research Materials
