

Gut-microbiome-related LCT genotype and 2-year changes in body composition and fat distribution: the POUNDS Lost Trial
- PMID: 29568104
- PMCID: PMC6109621
- DOI: 10.1038/s41366-018-0046-9
Gut-microbiome-related LCT genotype and 2-year changes in body composition and fat distribution: the POUNDS Lost Trial
Abstract
Background/objectives: Gut microbiome regulates host energy metabolism and adiposity. A recent study identified a genome-wide significant variant in the lactase (LCT) gene that determines gut-microbiome abundance. We investigated whether the LCT variant influenced long-term changes in adiposity among overweight and obese individuals.
Subjects/methods: We included 583 whites with LCT variant rs4988235 (G allele as Bifidobacterium-abundance-increasing allele) who were randomly assigned to one of four weight-loss diets varying in macronutrient contents. Two-year changes in adiposity measures were assessed according to the LCT genotype and weight-loss diets.
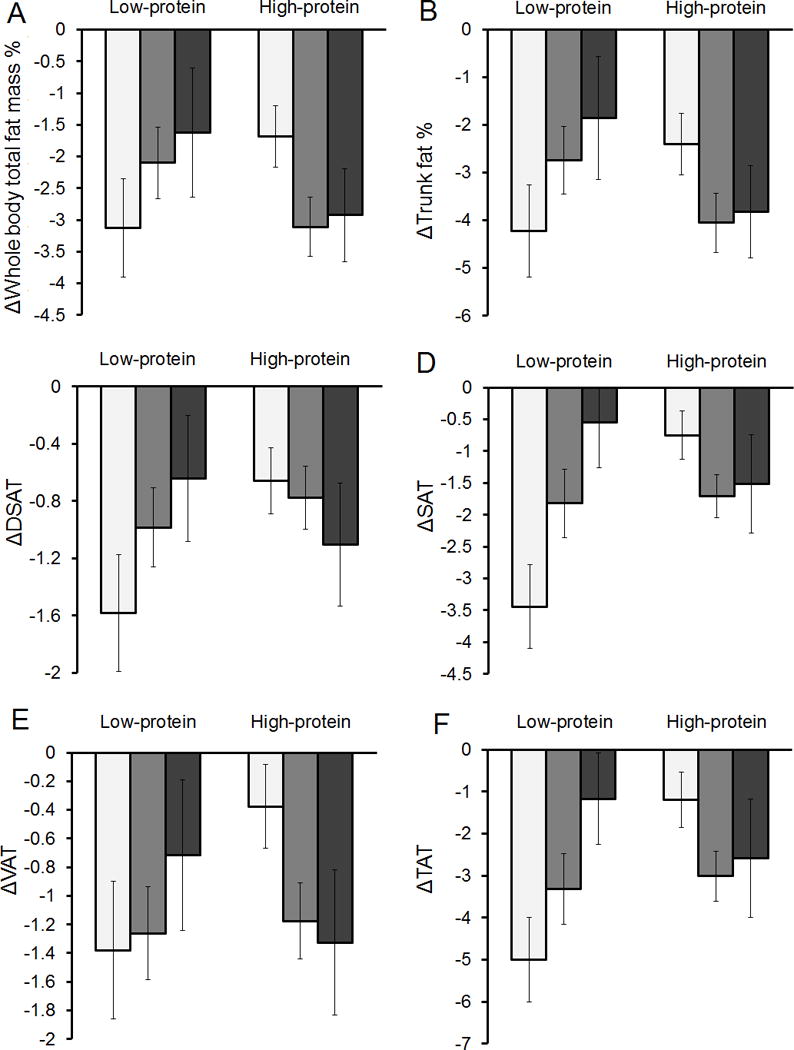
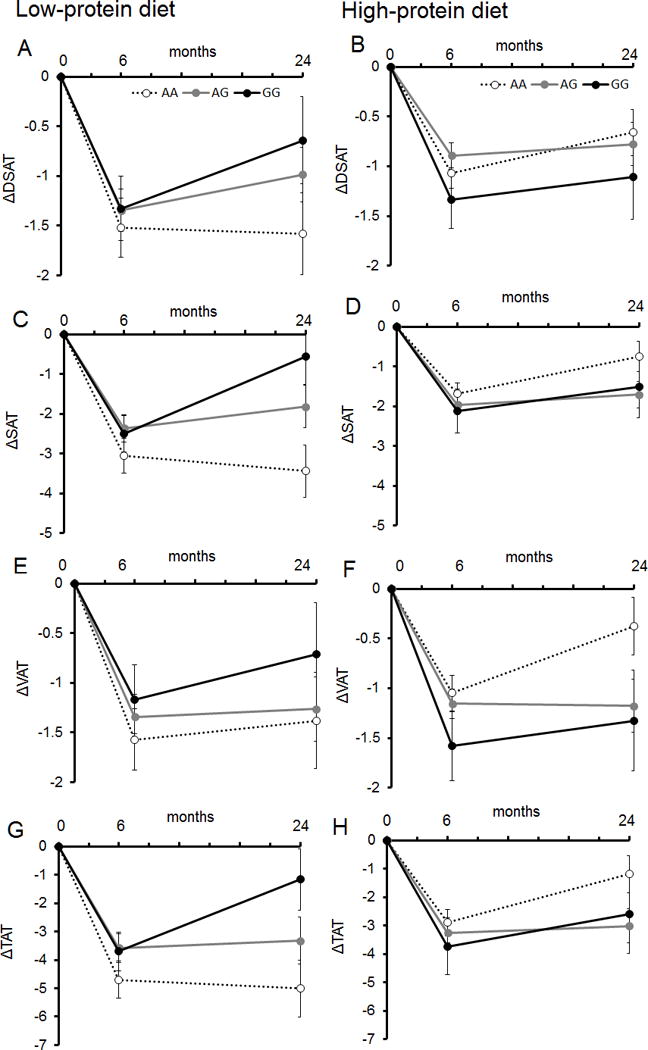
Results: We observed a significant interaction between the LCT genotype and dietary protein intake on changes in whole body total fat mass %, trunk fat %, superficial adipose tissue mass (SAT), visceral adipose tissue mass (VAT), and total adipose tissue mass (TAT) (Pinteraction < 0.05 for all). In response to high-protein diet, carrying the G allele of LCT variant rs4988235 was associated with greater reduction of whole body total fat mass % (β [SE] -0.9 [0.43], P = 0.04), trunk fat % (-1.06 [0.58], P = 0.07), SAT (-0.89 [0.42], P = 0.04), VAT (-0.63 [0.27], P = 0.03), and TAT (-1.69 [0.76], P = 0.03). Conversely, increasing numbers of the G allele tended to be related to less reduction of these outcomes in response to low-protein diet.
Conclusions: Long-term improvement of body fat composition and distribution was significantly influenced by the Bifidobacterium-related LCT genotype and dietary protein intake. Overweight and obese individuals with the G allele of LCT variant rs4988235 may benefit improving adiposity by eating a low-calorie, high-protein diet.
Figures
Similar articles
-
Macronutrient Intake-Associated FGF21 Genotype Modifies Effects of Weight-Loss Diets on 2-Year Changes of Central Adiposity and Body Composition: The POUNDS Lost Trial.Diabetes Care. 2016 Nov;39(11):1909-1914. doi: 10.2337/dc16-1111. Epub 2016 Aug 31. Diabetes Care. 2016. PMID: 27581055 Free PMC article.
-
A circadian rhythm-related MTNR1B genetic variant modulates the effect of weight-loss diets on changes in adiposity and body composition: the POUNDS Lost trial.Eur J Nutr. 2019 Jun;58(4):1381-1389. doi: 10.1007/s00394-018-1660-y. Epub 2018 Mar 7. Eur J Nutr. 2019. PMID: 29516223 Free PMC article.
-
Genetically determined gut microbial abundance and 2-year changes in central adiposity and body composition: The POUNDS lost trial.Clin Nutr. 2022 Dec;41(12):2817-2824. doi: 10.1016/j.clnu.2022.11.002. Epub 2022 Nov 5. Clin Nutr. 2022. PMID: 36402008 Free PMC article. Clinical Trial.
-
FTO genotype and 2-year change in body composition and fat distribution in response to weight-loss diets: the POUNDS LOST Trial.Diabetes. 2012 Nov;61(11):3005-11. doi: 10.2337/db11-1799. Epub 2012 Aug 13. Diabetes. 2012. PMID: 22891219 Free PMC article. Clinical Trial.
-
Visceral adiposity and inflammatory bowel disease.Int J Colorectal Dis. 2021 Nov;36(11):2305-2319. doi: 10.1007/s00384-021-03968-w. Epub 2021 Jun 9. Int J Colorectal Dis. 2021. PMID: 34104989 Review.
Cited by
-
Toward Precision Weight-Loss Dietary Interventions: Findings from the POUNDS Lost Trial.Nutrients. 2023 Aug 21;15(16):3665. doi: 10.3390/nu15163665. Nutrients. 2023. PMID: 37630855 Free PMC article. Review.
-
Gene-Environment Interactions on Body Fat Distribution.Int J Mol Sci. 2019 Jul 27;20(15):3690. doi: 10.3390/ijms20153690. Int J Mol Sci. 2019. PMID: 31357654 Free PMC article. Review.
-
Ileal Lactase Expression Associates with Lactase Persistence Genotypes.Nutrients. 2021 Apr 17;13(4):1340. doi: 10.3390/nu13041340. Nutrients. 2021. PMID: 33920682 Free PMC article.
-
Metabolic Disorders, the Microbiome as an Endocrine Organ, and Their Relations with Obesity: A Literature Review.J Pers Med. 2023 Nov 13;13(11):1602. doi: 10.3390/jpm13111602. J Pers Med. 2023. PMID: 38003917 Free PMC article. Review.
-
Impact of Food-Based Weight Loss Interventions on Gut Microbiome in Individuals with Obesity: A Systematic Review.Nutrients. 2022 May 6;14(9):1953. doi: 10.3390/nu14091953. Nutrients. 2022. PMID: 35565919 Free PMC article.
References
-
- Turnbaugh PJ, Ley RE, Mahowald MA, Magrini V, Mardis ER, Gordon JI. An obesity-associated gut microbiome with increased capacity for energy harvest. Nature. 2006;444:1027–1031. - PubMed
-
- Claesson MJ, Jeffery IB, Conde S, Power SE, O’Connor EM, Cusack S, et al. Gut microbiota composition correlates with diet and health in the elderly. Nature. 2012;488:178–184. - PubMed
Publication types
MeSH terms
Substances
Grants and funding
LinkOut - more resources
Full Text Sources
Other Literature Sources
Research Materials
