. 2019 May;16(5):460-472.
doi: 10.1038/s41423-018-0003-5. Epub 2018 Mar 22.

TREM-1 multimerization is essential for its activation on monocytes and neutrophils

Affiliations

TREM-1 multimerization is essential for its activation on monocytes and neutrophils

Kevin Carrasco et al. Cell Mol Immunol. 2019 May.

Abstract

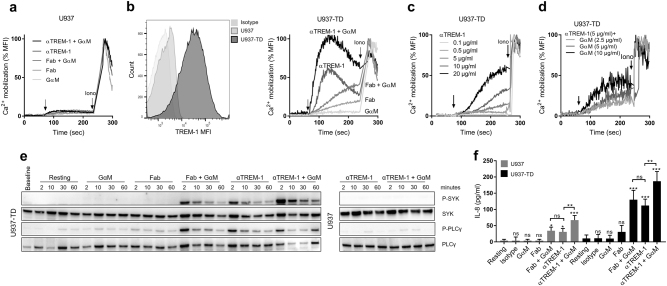
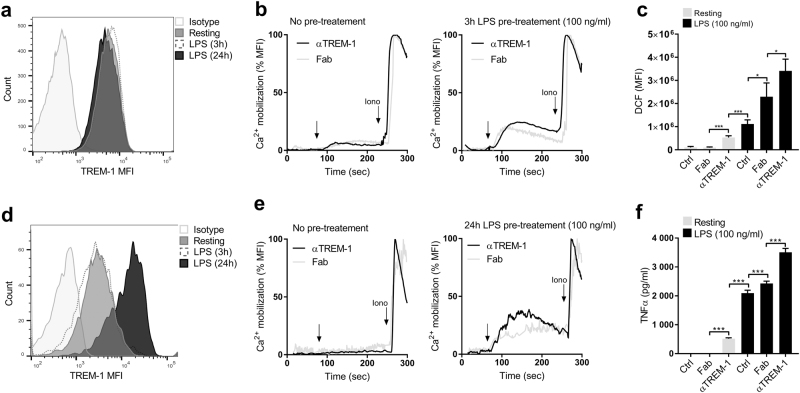
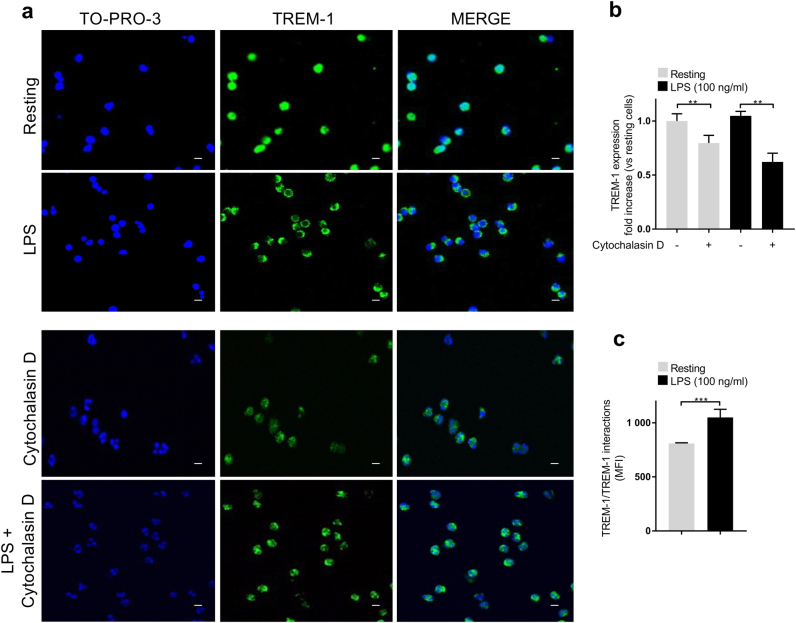
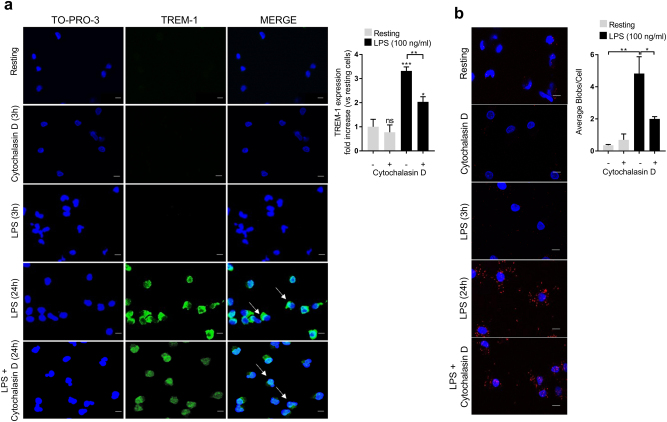
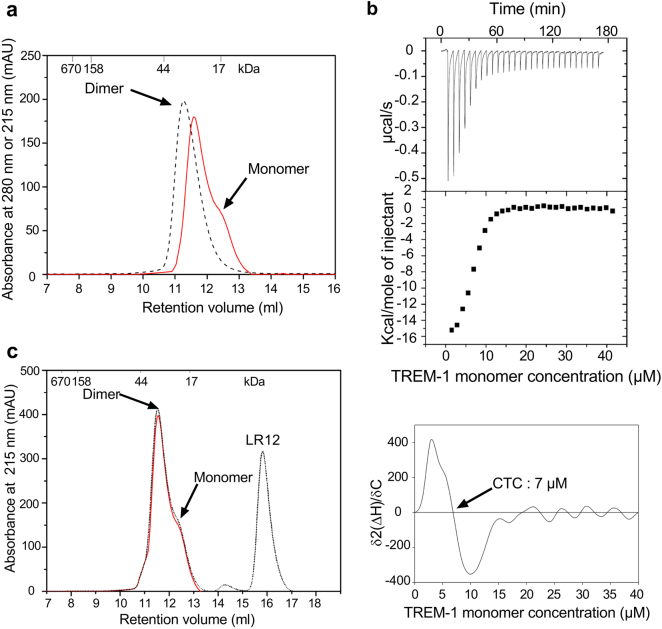
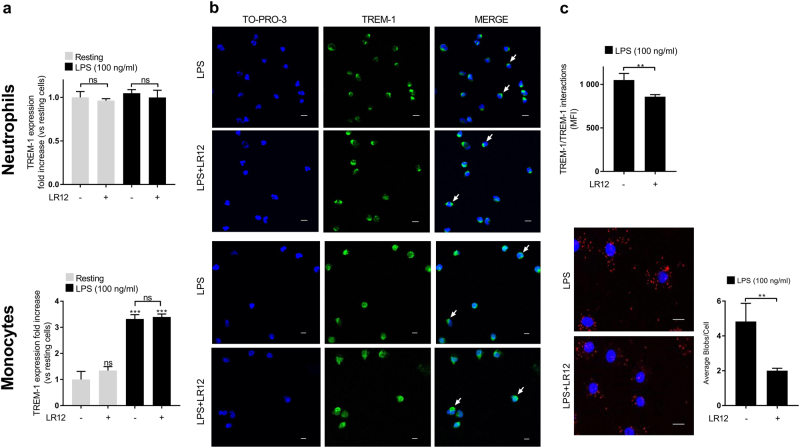
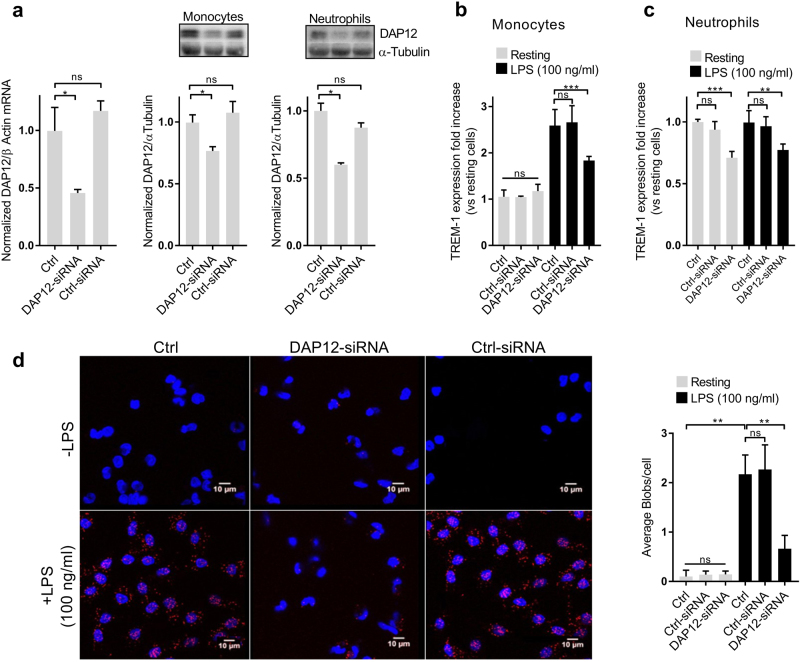
The triggering receptor expressed on myeloid cells-1 (TREM-1) is a receptor expressed on innate immune cells. By promoting the amplification of inflammatory signals that are initially triggered by Toll-like receptors (TLRs), TREM-1 has been characterized as a major player in the pathophysiology of acute and chronic inflammatory diseases, such as septic shock, myocardial infarction, atherosclerosis, and inflammatory bowel diseases. However, the molecular events leading to the activation of TREM-1 in innate immune cells remain unknown. Here, we show that TREM-1 is activated by multimerization and that the levels of intracellular Ca2+ release, reactive oxygen species, and cytokine production correlate with the degree of TREM-1 aggregation. TREM-1 activation on primary human monocytes by LPS required a two-step process consisting of upregulation followed by clustering of TREM-1 at the cell surface, in contrast to primary human neutrophils, where LPS induced a rapid cell membrane reorganization of TREM-1, which confirmed that TREM-1 is regulated differently in primary human neutrophils and monocytes. In addition, we show that the ectodomain of TREM-1 is able to homooligomerize in a concentration-dependent manner, which suggests that the clustering of TREM-1 on the membrane promotes its oligomerization. We further show that the adapter protein DAP12 stabilizes TREM-1 surface expression and multimerization. TREM-1 multimerization at the cell surface is also mediated by its endogenous ligand, a conclusion supported by the ability of the TREM-1 inhibitor LR12 to limit TREM-1 multimerization. These results provide evidence for ligand-induced, receptor-mediated dimerization of TREM-1. Collectively, our findings uncover the mechanisms necessary for TREM-1 activation in monocytes and neutrophils.

Keywords: TREM-1; activation; monocytes; multimerization; neutrophils.


Conflict of interest statement

M.D. and S.G. are co-founders of Inotrem SA, a Company developing TREM-1 inhibitors. P.L. is co-founder of Inatherys SA, a Company developing therapeutic monoclonal antibodies. A.N. is co-founder of CovalX GmbH, a Company providing services for the analysis of protein complexes. The remaining authors declare that they have no competing interests.

Figures

Fig. 1
Fig. 1. Multimerization of TREM-1 is required for signal transduction.
ad U937 and U937-TD cells were stimulated with TREM-1 agonists αTREM-1 and Fab (10 µg/ml) with or without GαM (10 µg/ml) when indicated. a Kinetics of intracellular calcium release in U937 cells. b Left panel: TREM-1 expression on U937 (gray) and U937-TD (black) cells. Right panel: kinetics of intracellular calcium release in U937-TD cells. c, d Kinetics of intracellular calcium release in U937-TD cells incubated c with increasing concentrations of αTREM-1 (0.1–20 µg/ml) and d with αTREM-1 (5 µg/ml) and increasing concentrations of GαM (2.5–10 µg/ml). e Western blot analysis of lysates of U937 and U937-TD cells at indicated times. f IL-8 concentrations in supernatants after a 24-h stimulation. Data information: data are representative of at least three independent experiments. MFI mean fluorescence intensity, ns nonsignificant. *p < 0.05, **p < 0.01, ***p < 0.001 vs. resting or as indicated, as determined by the two-tailed Student’s t-test
Fig. 2
Fig. 2. LPS priming of human primary neutrophils and monocytes is required to allow TREM-1 activation.
ae Isolated primary human monocytes and neutrophils were incubated at indicated times in resting conditions or stimulated with LPS (100 ng/ml) and TREM-1 agonists (10 µg/ml) when indicated. a TREM-1 expression by FACS on neutrophils at indicated times. b Kinetics of intracellular calcium release in neutrophils in response to TREM-1 agonists with or without 3-h pre-treatment with LPS. c Neutrophil intracellular ROS production. d TREM-1 expression by FACS on monocytes at indicated times. e Kinetics of intracellular calcium release in monocytes in response to TREM-1 agonists with or without 24-h pre-treatment with LPS. f TNF-α concentrations in supernatants of 24-h-stimulated monocytes. Data information: data are representative of at least three independent experiments. MFI mean fluorescence intensity, DCF dichlorofluorescin, ns, nonsignificant. *p < 0.05, ***p < 0.001 vs. resting or as indicated, as determined by the two-tailed Student’s t-test
Fig. 3
Fig. 3. LPS priming of neutrophils induces a one-step clustering and multimerization of TREM-1.
ac Isolated human neutrophils were incubated at indicated times in resting conditions or stimulated with LPS (100 ng/ml) and/or cytochalasin D (5 µg/ml) when indicated. a TREM-1 (green) and nucleus (TO-PRO-3, blue) staining by confocal microscopy after 3 h stimulation (scale bar: 10 µm). b TREM-1 expression on isolated human neutrophils after 24 h. c TREM-1/TREM-1 interactions quantified by flow cytometry after 3 h. Data information: data are representative of at least three independent experiments. MFI mean fluorescence intensity, ns nonsignificant. **p < 0.01, ***p < 0.001 vs. resting or as indicated, as determined by the two-tailed Student’s t-test
Fig. 4
Fig. 4. LPS priming of monocytes induces a two-step clustering and multimerization of TREM-1.
ab Isolated human monocytes were incubated at indicated times in resting conditions or stimulated with LPS (100 ng/ml) and/or cytochalasin D (5 µg/ml) when indicated. a Left panel: TREM-1 (green) and nucleus (TO-PRO-3, blue) staining by confocal microscopy after 3 and 24 h stimulation. Right panel: TREM-1 expression on isolated human monocytes after 24 h stimulation (scale bar: 10 µm). b Left panel: TREM-1 in situ PLA (red blobs) and nucleus (blue) by confocal microscopy after 3 and 24 h stimulation (scale bar: 10 µm). Right panel: quantification of average blobs/cell. Data information: data are representative of at least three independent experiments. MFI mean fluorescence intensity, ns nonsignificant. *p < 0.05, **p < 0.01, ***p < 0.001 vs. resting or as indicated, as determined by the two-tailed Student’s t-test
Fig. 5
Fig. 5. Recombinant TREM-1 extracellular domain produced in E. coli dimerizes in vitro.
a Characterization of hTREM-1-ECD(21–192) (100 μM, dashed line and 5 µM, red line) by gel filtration chromatography. Elution was monitored by absorbance at 280 nm except for hTREM-1-ECD(21–192) at low concentration (5 µM), which was monitored at 215 nm. b Left panel: titration isotherms of hTREM-1-ECD(21–192) determined by isothermal titration calorimetry (ITC). Right panel: the critical transition concentration (CTC) corresponds to the x-intercept of the second derivative (C: TREM-1 monomer concentration; H: enthalpy). c Characterization of hTREM-1-ECD(21–192) (5 µM, red line) and hTREM-1-ECD(21–192) (5 µM) in competition with LR12 peptide at 50 µM (dashed line) by gel filtration chromatography. Data information: data are representative of at least three independent experiments
Fig. 6
Fig. 6. Recombinant TREM-1 extracellular domain produced in human cells dimerizes in vitro.
a Native mass spectra of hTREM-1-ECD(21–200) at different concentrations. Signals representing monomeric and dimeric proteins are highlighted in orange and blue, respectively. (TREM-1-ECD(21–200) displays three predicted sites of N-glycosylation. Indeed, we observed that the high micro-heterogeneity of protein glycosylation resulted in overlapping signals from a wide distribution of glycoforms carrying different charges, making the charge states of TREM-1 ions unresolvable.) b MS signals of monomeric and dimeric hTREM-1-ECD(21–200): b, 1 native mass spectrum of 30 µM hTREM-1-ECD(21–200). Subpopulations of protein ions represented by the first and second peaks were mass-selected for subsequent collision induced dissociation (CID), releasing series of fragments. b, 2 and b, 3 show the resulting patterns of fragmentation derived from the corresponding mass selections. c Fractional mass of hTREM-1-ECD(21–200) dimer as a function of the protomer concentration of TREM-1. The dashed line indicates the level where half of TREM-1 molecules populates the dimeric state. d Fractional mass of hTREM-1-ECD(21–200) dimer as a function of the protomer concentration of TREM-1 (12 µM) in the presence of the LR12 peptide at different concentrations. The dashed line indicates the dimerization level in the absence of any peptide. The inset shows an exemplary mass spectrum of 12 µM TREM-1 in the presence of 18 µM LR12 peptide. e Analysis by CovalX HM4 system high-mass detector of hTREM-1-ECD(21–200) (0.250 mg/ml, 7.5 µM) without crosslinking (upper panel, in black) and after chemical crosslinking (lower panel, in red). Data information: data are representative of at least three independent experiments
Fig. 7
Fig. 7. The TREM-1 inhibitor LR12 is able to decrease TREM-1 dimerization at the cell surface.
ac Isolated human primary neutrophils (upper panels) and monocytes (lower panels) were incubated, respectively, during 3 or 24 h in resting conditions or stimulated with LPS (100 ng/ml) and/or with LR12 peptide (25 µg/ml) when indicated. a TREM-1 expression by FACS on neutrophils and monocytes. b TREM-1 (green) and nucleus (TO-PRO-3, blue) staining by confocal microscopy (scale bar: 10 µm). c TREM-1/TREM-1 interactions (scale bar: 10 µm). Data information: data are representative of at least three independent experiments. MFI mean fluorescence intensity, ns, nonsignificant. **p < 0.01, ***p < 0.001 vs. resting or as indicated, as determined by the two-tailed Student’s t-test
Fig. 8
Fig. 8. DAP12 stabilizes TREM-1 surface expression and multimerization.
a Normalized DAP12 mRNA and protein quantification in native and DAP12-silenced conditions. bd Isolated human primary neutrophils and monocytes were incubated 12 h with siRNAs and incubated during 24 h in resting conditions or stimulated with LPS (100 ng/ml). b TREM-1 expression on monocytes. c TREM-1 expression on neutrophils. d TREM-1/TREM-1 interactions (red blobs) and nucleus (blue) on monocytes after 24 h by confocal microscopy (scale bar: 10 µm). Data information: data are representative of at least three different experiments. ns nonsignificant. *p < 0.05, **p < 0.01, ***p < 0.001 vs. resting or as indicated, as determined by the two-tailed Student’s t-test

References

    1. Bouchon A, Dietrich J, Colonna M. Cutting edge: inflammatory responses can be triggered by TREM-1, a novel receptor expressed on neutrophils and monocytes. J. Immunol. 2000;164:4991–4995. doi: 10.4049/jimmunol.164.10.4991. - DOI - PubMed
    1. Jolly L, et al. Triggering receptor expressed on myeloid cells-1: a new player in platelet aggregation. Thromb. Haemost. 2017;117:1772–1781. doi: 10.1160/TH17-03-0156. - DOI - PubMed
    1. Derive M, Massin F, Gibot S. Triggering receptor expressed on myeloid cells-1 as a new therapeutic target during inflammatory diseases. Self Nonself. 2010;1:225–230. doi: 10.4161/self.1.3.12891. - DOI - PMC - PubMed
    1. Tammaro A, et al. TREM-1 and its potential ligands in non-infectious diseases: from biology to clinical perspectives. Pharmacol. Ther. 2017;177:81–95. doi: 10.1016/j.pharmthera.2017.02.043. - DOI - PubMed
    1. Bouchon A, Facchetti F, Weigand MA, Colonna M. TREM-1 amplifies inflammation and is a crucial mediator of septic shock. Nature. 2001;410:1103–1107. doi: 10.1038/35074114. - DOI - PubMed

Publication types

MeSH terms

Substances