. 2015;25(3):248-264.
doi: 10.1080/09581596.2014.931568. Epub 2014 Jun 27.

The transitional dynamics of caloric ecosystems: changes in the food supply around the world

Affiliations

The transitional dynamics of caloric ecosystems: changes in the food supply around the world

Sanjay Basu. Crit Public Health. 2015.

Abstract

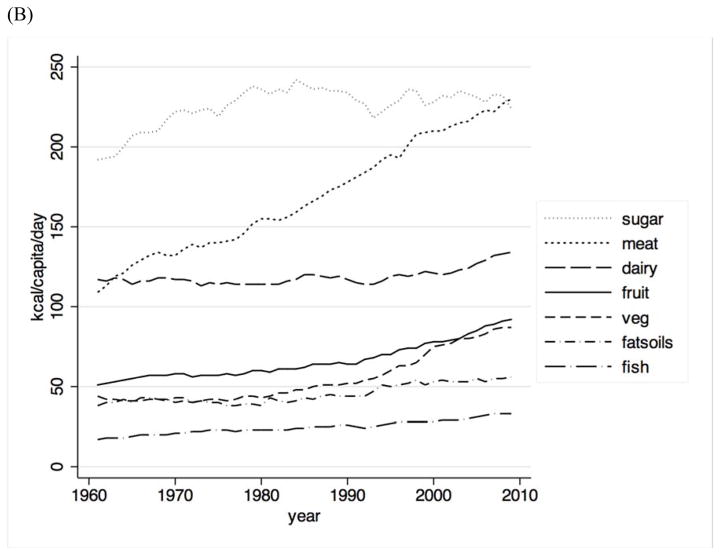
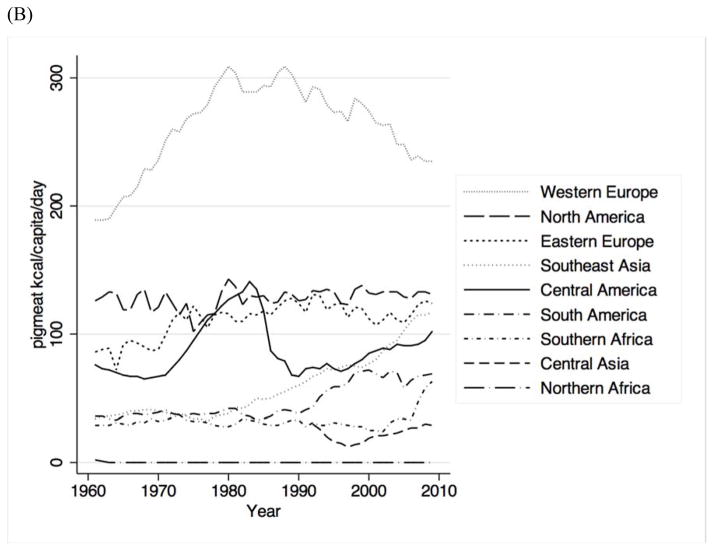
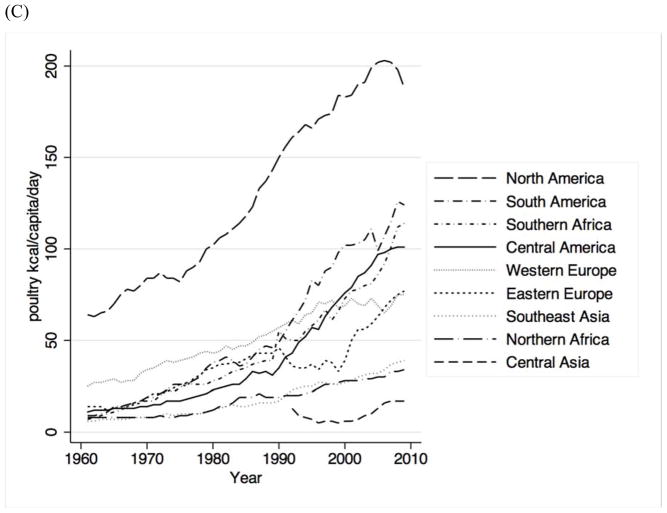
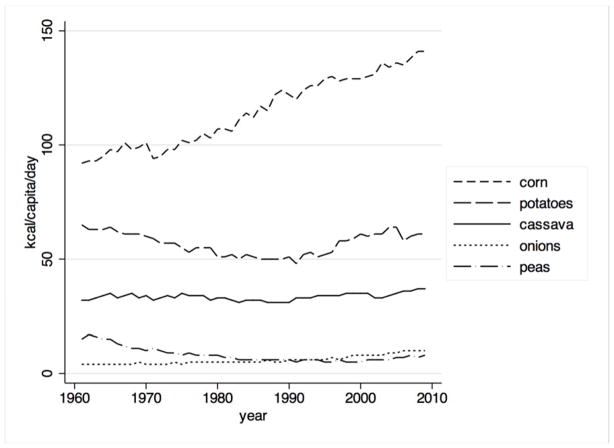
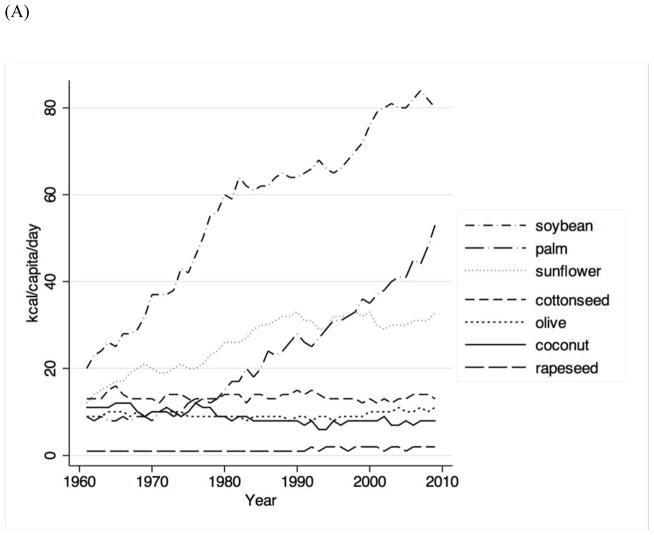
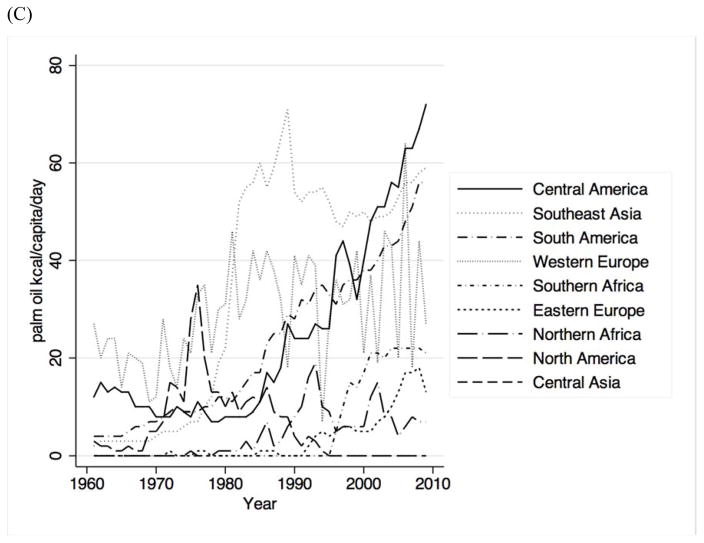
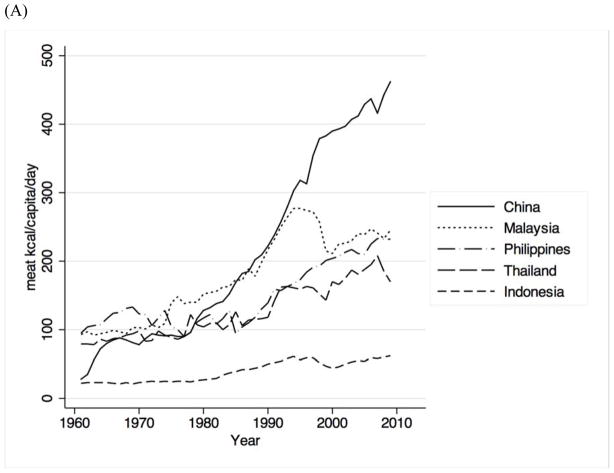
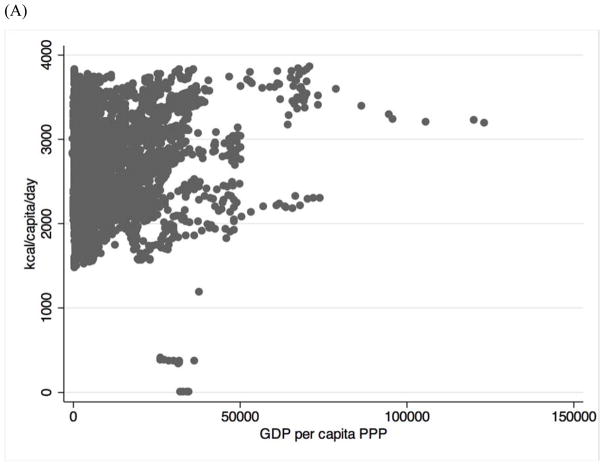
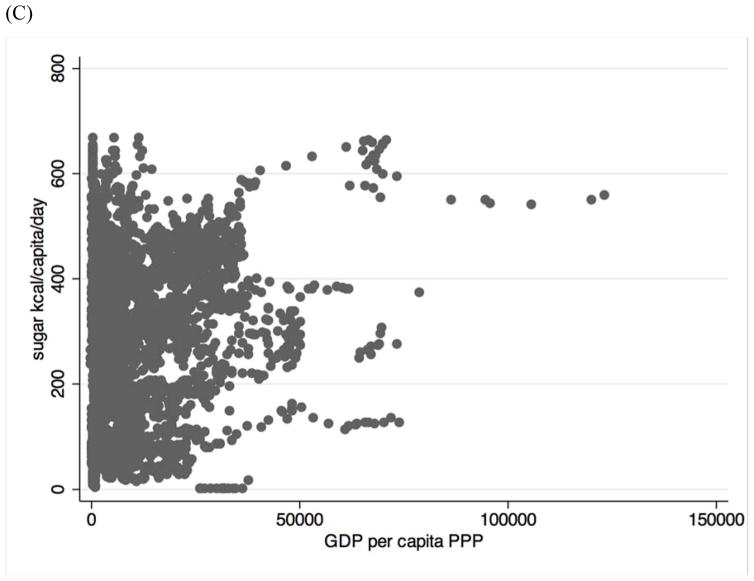
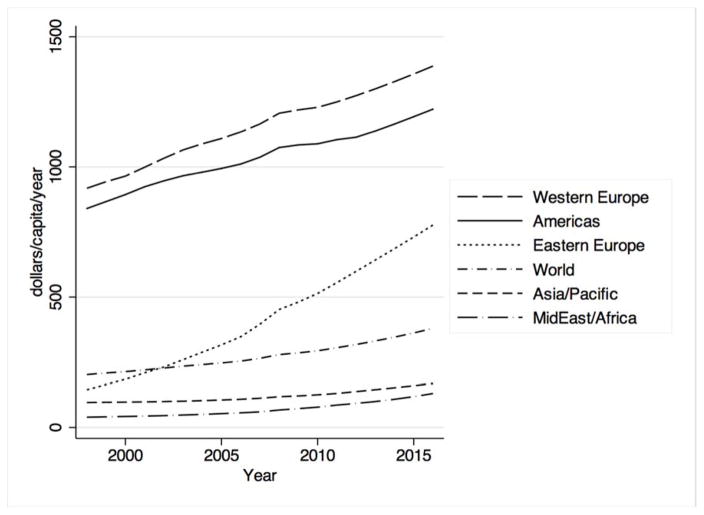
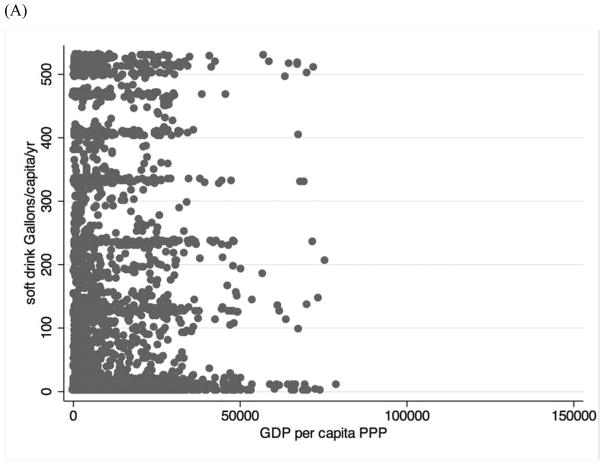
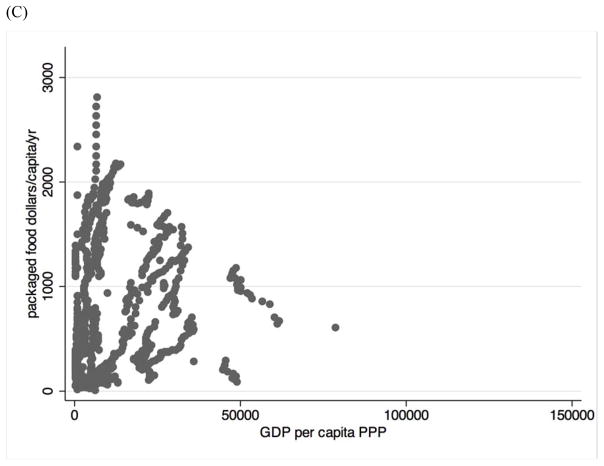
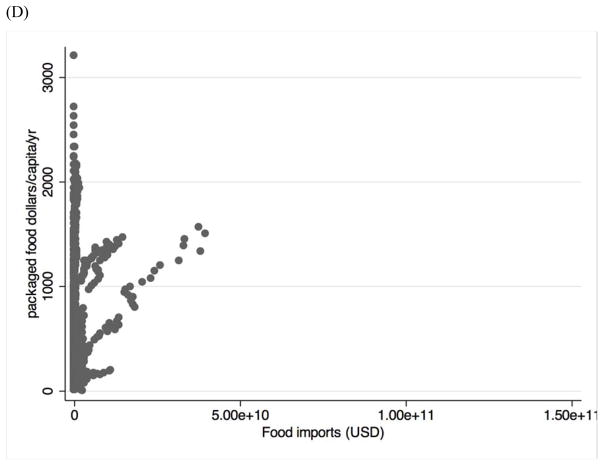
Changes to the global food supply have been characterized by greater availability of edible oils, sweeteners, and meats-a profound "nutrition transition" associated with rising obesity, type 2 diabetes, and cardiovascular disease. Through an analysis of three longitudinal databases of food supply, sales and economics across the period 1961-2010, we observed that the change in global food supply has been characterized by a dramatic rise in pig meat consumption in China and poultry consumption in North America. These changes have not been experienced by all rapidly-developing countries, and are not well explained by changes in income. The changes in food supply include divergence among otherwise similar neighboring countries, suggesting that the changes in food supply are not an inevitable result of economic development. Furthermore, we observed that the nutrition transition does not merely involve an adoption of "Western" diets universally, but can also include an increase in the supply of edible oils that are uncommon in Western countries. Much of the increase in sales of sugar-sweetened beverages and packaged foods is attributable to a handful of multinational corporations, but typically from products distributed through domestic production systems rather than foreign importation. While North America and Latin America continued to have high sugar-sweetened beverage and packaged food sales in recent years, Eastern Europe and the Middle East have become emerging markets for these products. These findings suggest further study of natural experiments to identify which policies may mitigate nutritional risk factors for chronic disease in the context of economic development.


Figures

Figure 1
Figure 1
Changes to food supply worldwide (A) in all major food groups; and (B) with cereals excluded to allow closer visualization of the rise in meat supply.
Figure 1
Figure 1
Changes to food supply worldwide (A) in all major food groups; and (B) with cereals excluded to allow closer visualization of the rise in meat supply.
Figure 2
Figure 2
Rise in meat supply (A) worldwide; (B) specifically for pig meat, disaggregated by region; and (C) specifically for poultry meat, disaggregated by region.
Figure 2
Figure 2
Rise in meat supply (A) worldwide; (B) specifically for pig meat, disaggregated by region; and (C) specifically for poultry meat, disaggregated by region.
Figure 2
Figure 2
Rise in meat supply (A) worldwide; (B) specifically for pig meat, disaggregated by region; and (C) specifically for poultry meat, disaggregated by region.
Figure 3
Figure 3
Vegetable supply changes worldwide.
Figure 4
Figure 4
Edible oil supply changes (A) worldwide; (B) specifically for soybean oil, disaggregated by region; and (C) specifically for palm oil, disaggregated by region.
Figure 4
Figure 4
Edible oil supply changes (A) worldwide; (B) specifically for soybean oil, disaggregated by region; and (C) specifically for palm oil, disaggregated by region.
Figure 4
Figure 4
Edible oil supply changes (A) worldwide; (B) specifically for soybean oil, disaggregated by region; and (C) specifically for palm oil, disaggregated by region.
Figure 5
Figure 5
Intraregional supply changes: (A) in meat supply in Southeast Asia; (B) by contrast, relative stability in meat supply in South Asia despite economic growth in India; and (C) variations in sugar supply in Latin America.
Figure 5
Figure 5
Intraregional supply changes: (A) in meat supply in Southeast Asia; (B) by contrast, relative stability in meat supply in South Asia despite economic growth in India; and (C) variations in sugar supply in Latin America.
Figure 5
Figure 5
Intraregional supply changes: (A) in meat supply in Southeast Asia; (B) by contrast, relative stability in meat supply in South Asia despite economic growth in India; and (C) variations in sugar supply in Latin America.
Figure 6
Figure 6
Variations in food supply versus GDP: (A) total supply; (B) meat supply; (C) sugar supply; (D) vegetable supply; (E) edible oil supply.
Figure 6
Figure 6
Variations in food supply versus GDP: (A) total supply; (B) meat supply; (C) sugar supply; (D) vegetable supply; (E) edible oil supply.
Figure 6
Figure 6
Variations in food supply versus GDP: (A) total supply; (B) meat supply; (C) sugar supply; (D) vegetable supply; (E) edible oil supply.
Figure 6
Figure 6
Variations in food supply versus GDP: (A) total supply; (B) meat supply; (C) sugar supply; (D) vegetable supply; (E) edible oil supply.
Figure 6
Figure 6
Variations in food supply versus GDP: (A) total supply; (B) meat supply; (C) sugar supply; (D) vegetable supply; (E) edible oil supply.
Figure 7
Figure 7
Soft drink sales worldwide.
Figure 8
Figure 8
Packaged food sales worldwide.
Figure 9
Figure 9
Variations on food sales versus GDP and food imports. Soft drink sales versus (A) GDP and (B) food imports. Processed foods sales versus (A) GDP and (B) food imports.
Figure 9
Figure 9
Variations on food sales versus GDP and food imports. Soft drink sales versus (A) GDP and (B) food imports. Processed foods sales versus (A) GDP and (B) food imports.
Figure 9
Figure 9
Variations on food sales versus GDP and food imports. Soft drink sales versus (A) GDP and (B) food imports. Processed foods sales versus (A) GDP and (B) food imports.
Figure 9
Figure 9
Variations on food sales versus GDP and food imports. Soft drink sales versus (A) GDP and (B) food imports. Processed foods sales versus (A) GDP and (B) food imports.

References

    1. Basu S, Babiarz KS, Ebrahim S, Vellakkal S, Stuckler D, Goldhaber-Fiebert JD. Palm oil taxes and cardiovascular disease mortality in India: economic-epidemiologic model. BMJ (Clinical Research Ed) 2013;347:f6048. - PMC - PubMed
    1. Basu S, Stuckler D, McKee M, Galea G. Nutritional determinants of worldwide diabetes: an econometric study of food markets and diabetes prevalence in 173 countries. Public Health Nutrition. 2012;1(1):1–8. - PMC - PubMed
    1. Basu S, Vellakkal S, Agrawal S, Stuckler D, Popkin B, Ebrahim S. Averting Obesity and Type 2 Diabetes in India through Sugar-Sweetened Beverage Taxation: An Economic-Epidemiologic Modeling Study. PLoS Medicine. 2014;11(1):e1001582. doi: 10.1371/journal.pmed.1001582. - DOI - PMC - PubMed
    1. Basu S, Yoffe P, Hills N, Lustig RH. The relationship of sugar to population-level diabetes prevalence: an econometric analysis of repeated cross-sectional data. PloS One. 2013;8(2):e57873. doi: 10.1371/journal.pone.0057873. - DOI - PMC - PubMed
    1. Chen BK, Seligman B, Farquhar JW, Goldhaber-Fiebert JD. Multi-Country analysis of palm oil consumption and cardiovascular disease mortality for countries at different stages of economic development: 1980–1997. Globalization and Health. 2011;7:1–10. - PMC - PubMed

LinkOut - more resources