. 2018 Mar 6:9:121.
doi: 10.3389/fneur.2018.00121. eCollection 2018.

Quantitative Analysis of Bradykinesia and Rigidity in Parkinson's Disease

Affiliations

Quantitative Analysis of Bradykinesia and Rigidity in Parkinson's Disease

Lazzaro di Biase et al. Front Neurol. .

Abstract

Background: In the last decades, several studies showed that wearable sensors, used for assessing Parkinson's disease (PD) motor symptoms and recording their fluctuations, could provide a quantitative and reliable tool for patient's motor performance monitoring.

Objective: The aim of this study is to make a step forward the capability of quantitatively describing PD motor symptoms. The specific aims are: identify the most sensible place where to locate sensors to monitor PD bradykinesia and rigidity, and identify objective indexes able to discriminate PD OFF/ON motor status, and PD patients from healthy subjects (HSs).

Methods: Fourteen PD patients (H&Y stage 1-2.5), and 13 age-matched HSs, were enrolled. Five magneto-inertial wearable sensors, placed on index finger, thumb, metacarpus, wrist, and arm, were used as motion tracking systems. Sensors were placed on the most affected arm of PD patients, and on dominant hand of HS. Three UPDRS part III tasks were evaluated: rigidity (task 22), finger tapping (task 23), and prono-supination movements of the hands (task 25). A movement disorders expert rated the three tasks according to the UPDRS part III scoring system. In order to describe each task, different kinematic indexes from sensors were extracted and analyzed.

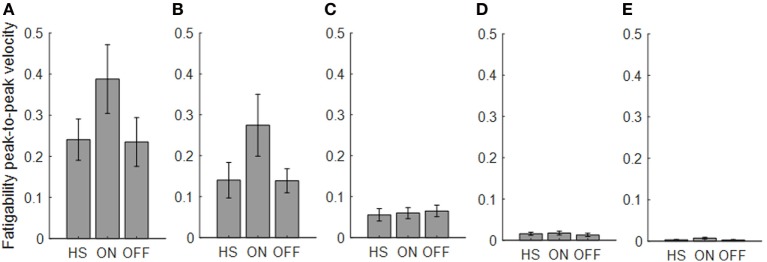
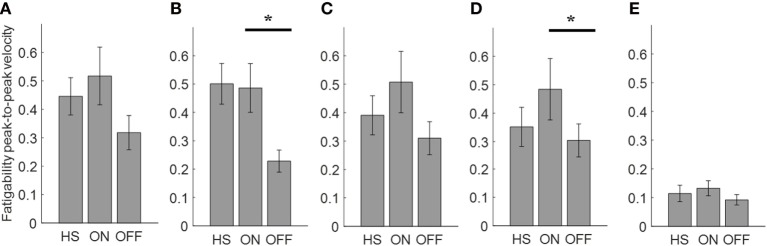
Results: Four kinematic indexes were extracted: fatigability; total time; total power; smoothness. The last three well-described PD OFF/ON motor status, during finger-tapping task, with an index finger sensor. During prono-supination task, wrist sensor was able to differentiate PD OFF/ON motor condition. Smoothness index, used as a rigidity descriptor, provided a good discrimination of the PD OFF/ON motor status. Total power index, showed the best accuracy for PD vs healthy discrimination, with any sensor location among index finger, thumb, metacarpus, and wrist.

Conclusion: The present study shows that, in order to better describe the kinematic features of Parkinsonian movements, wearable sensors should be placed on a distal location on upper limb, on index finger or wrist. The proposed indexes demonstrated a good correlation with clinical scores, thus providing a quantitative tool for research purposes in future studies in this field.

Keywords: kinematic analysis; parkinson’s disease; parkinson’s disease diagnosis; quantitative analysis; wearable sensors.


Figures

Figure 1
Figure 1
The figure shows where sensors were placed; second phalanx of the index finger, thumb, metacarpus, wrist, and arm; and their orientation around the three axes (x, y, z). Modified from Ref. (13).
Figure 2
Figure 2
Movement speed profile, during a prono-supination task, of a typical subject (S2) in ON (A) and OFF (B) phases and their respective Fourier magnitude spectrum. The segments used for computing spectral arch length are highlighted in green. The complexity of the Fourier magnitude spectrum changes with the submovement characteristics variations (i.e., inter-submovement interval) of the movement speed profile, as already shown by Ref. (17). Modified from Ref. (13).
Figure 3
Figure 3
Total time needed (seconds) to complete the finger-tapping (A) and the arm prono-supination tasks (B). Values are averaged for each group. Bars denote the SE. *p < 0.05 (t-test); **p < 0.01 (t-test).
Figure 4
Figure 4
Peak-to-peak velocity of all cycles of a typical Parkinson’s disease subject (S6) in comparison with the averaged values of healthy subject (HS) group, for the finger-tapping (A) and the arm prono-supination tasks (B) for each gyroscope channel. Values HS group values are averaged and bars denote the SE.
Figure 5
Figure 5
Fatigability index computed from the finger-tapping task. Each panel shows the averaged values for each group OFF, ON, and healthy subject (HS) for index finger (A), thumb (B), metacarpus (C), wrist (D), and arm (E). Bars denote the SE.
Figure 6
Figure 6
Fatigability index computed from the arm prono-supination task. Each panel shows the averaged values for each group OFF, ON, and healthy subject (HS) for index finger (A), thumb (B), metacarpus (C), wrist (D), and arm (E). Bars denote the SE. Bonferroni correction *p < 0.01.
Figure 7
Figure 7
Power spectral density of gyroscope signal of subjects S6 from the Parkinson’s disease group and S1 from the healthy subject (HS) group while performing finger-tapping task. Modified from Ref. (13).
Figure 8
Figure 8
Total power index computed from the finger-tapping task, with sensor on index finger. Values are averaged for each group OFF, ON, and healthy subject (HS). Bars denote the SE. Bonferroni correction *p < 0.01; **p < 0.001.
Figure 9
Figure 9
Total power index computed from the arm prono-supination task. Each panel shows the averaged values for each group OFF, ON, and healthy subject (HS) for index finger (A), thumb (B), metacarpus (C), wrist (D), and arm (E). Bars denote the SE. Bonferroni correction *p < 0.01; **p < 0.001.
Figure 10
Figure 10
Smoothness index. Each panel shows the averaged values for each group OFF, ON, and healthy subject (HS) for index finger [(A): finger tapping; (F): arm prono-supination], thumb [(B): finger tapping; (G): arm prono-supination], metacarpus [(C): finger tapping; (H): arm prono-supination], wrist [(D): finger tapping; (I): arm prono-supination], arm [(E): finger tapping; (J): arm prono-supination]. Bars denote the SE. *Bonferroni correction *p < 0.01; **p < 0.001.
Figure 11
Figure 11
Smoothness index computed from the wrist in the rigidity task. Values are averaged for each group. Bars denote the SE.

Similar articles

Cited by

References

    1. Parkinson Study G. Evaluation of dyskinesias in a pilot, randomized, placebo-controlled trial of remacemide in advanced Parkinson disease. Arch Neurol (2001) 58(10):1660–8.10.1001/archneur.58.10.1660 - DOI - PubMed
    1. Fahn S, Elton RL. Unified Parkinson’s disease rating scale. Recent Dev Parkinsons Dis (1987) 2:153–63.
    1. Goetz CG, Tilley BC, Shaftman SR, Stebbins GT, Fahn S, Martinez-Martin P, et al. Movement disorder society-sponsored revision of the Unified Parkinson’s disease rating scale (MDS-UPDRS): scale presentation and clinimetric testing results. Mov Disord (2008) 23(15):2129–70.10.1002/mds.22340 - DOI - PubMed
    1. Gibb WRG, Lees AJ. The relevance of the Lewy body to the pathogenesis of idiopathic Parkinson’s disease. J Neurol Neurosurg Psychiatry (1988) 51(6):745–52.10.1136/jnnp.51.6.745 - DOI - PMC - PubMed
    1. Rizzo G, Copetti M, Arcuti S, Martino D, Fontana A, Logroscino G. Accuracy of clinical diagnosis of Parkinson disease: a systematic review and meta-analysis. Neurology (2016) 86(6):566–76.10.1212/WNL.0000000000002350 - DOI - PubMed

LinkOut - more resources