. 2018 Feb 3;9(17):13423-13437.
doi: 10.18632/oncotarget.24393. eCollection 2018 Mar 2.

The new allosteric inhibitor asciminib is susceptible to resistance mediated by ABCB1 and ABCG2 overexpression in vitro

Affiliations

The new allosteric inhibitor asciminib is susceptible to resistance mediated by ABCB1 and ABCG2 overexpression in vitro

Laura N Eadie et al. Oncotarget. .

Abstract

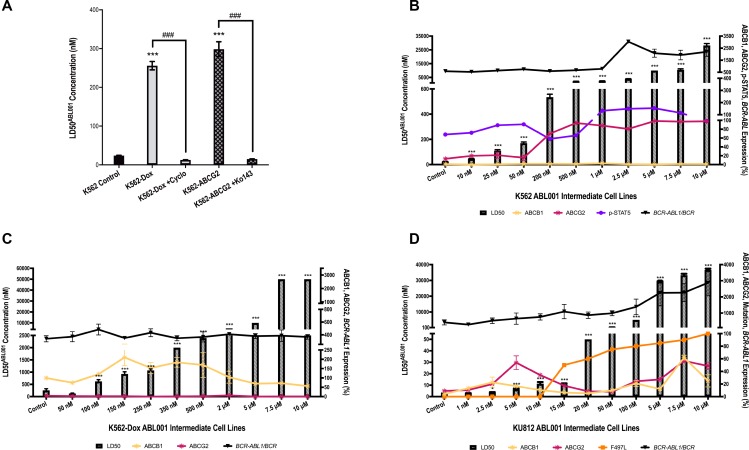
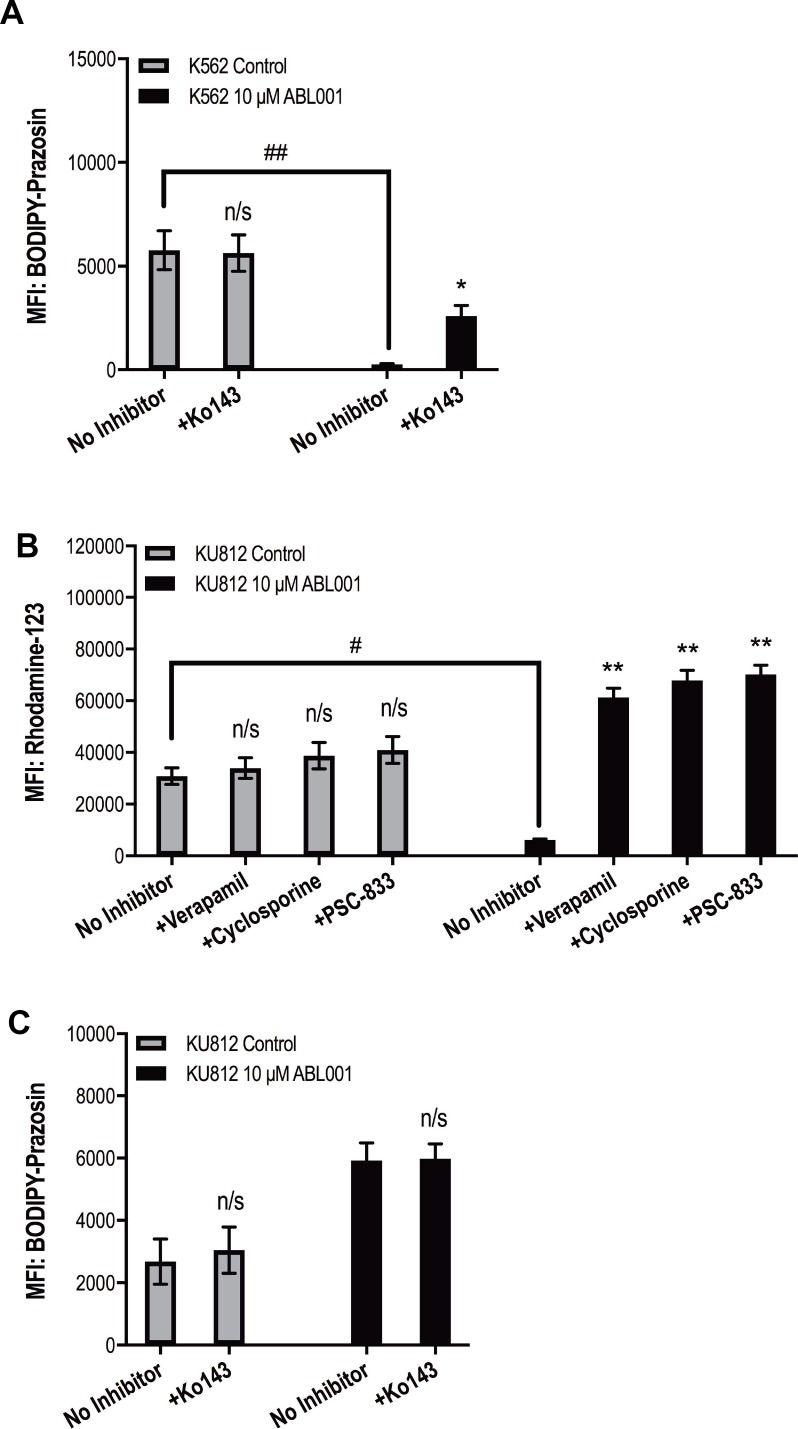
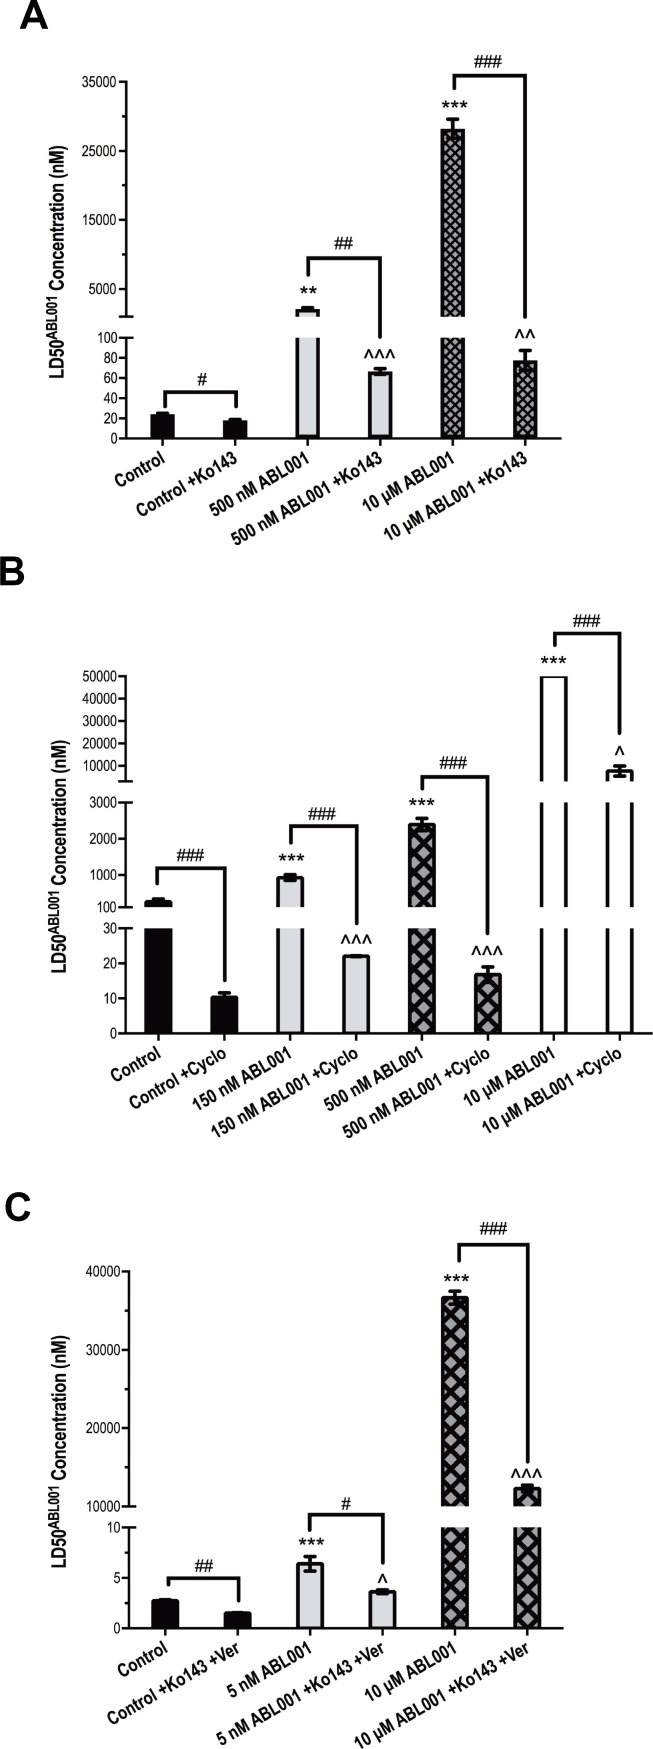
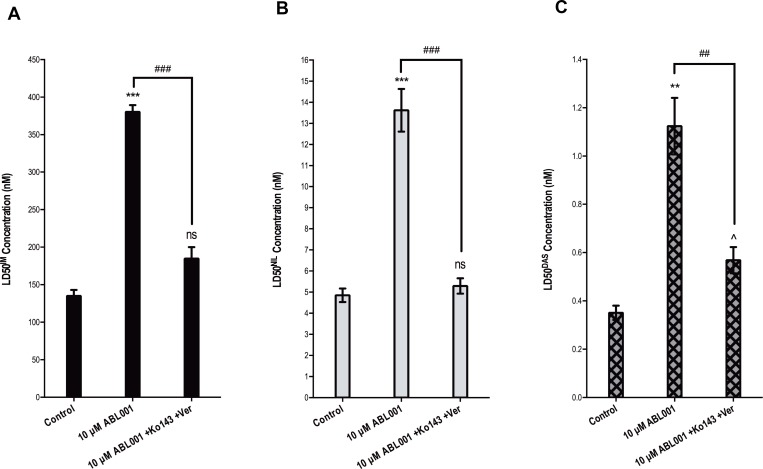
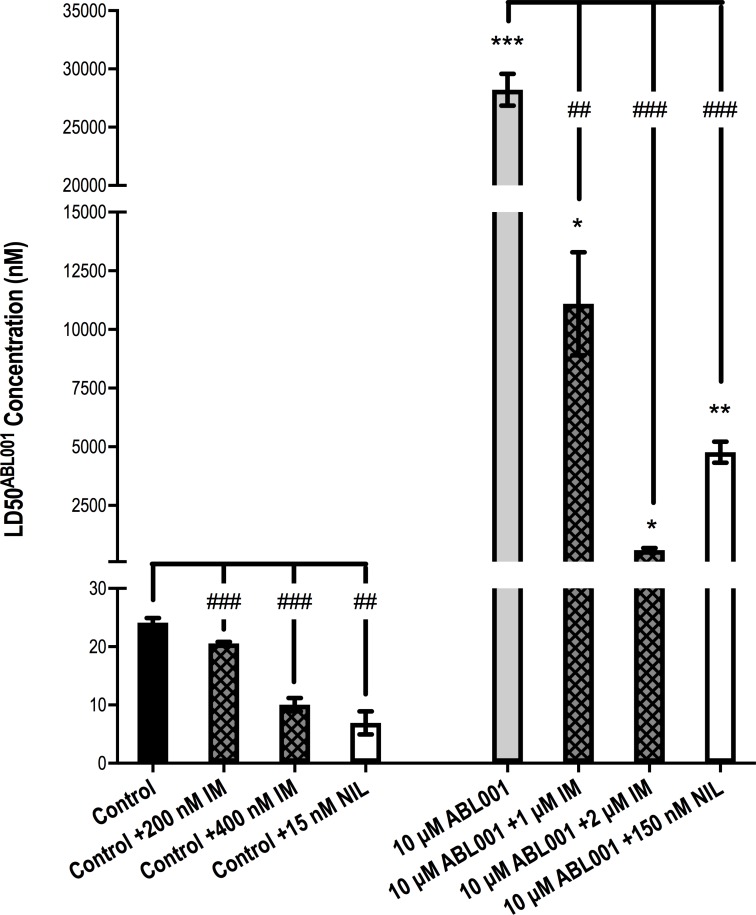
Asciminib (previously ABL001), which binds the myristate-binding pocket of the Bcr-Abl kinase domain, is in phase I clinical trials as monotherapy and in combination with imatinib, nilotinib and dasatinib for the treatment of patients with refractory CML or Ph+ ALL. Asciminib sensitivity was evaluated in asciminib naïve BCR-ABL1+ cell lines K562 (negligible ABCB1/ABCG2 expression), K562-Dox (ABCB1-overexpressing through doxorubicin exposure) and K562-ABCG2 (ABCG2 overexpression via transduction) with results demonstrating asciminib efflux by both ABCB1 and ABCG2 transporters. K562-Dox and K562-ABCG2 cells demonstrated increased LD50asciminib vs K562 control cells: 256 and 299 nM respectively vs 24 nM, p < 0.001. Sensitivity was completely restored with specific inhibitors cyclosporine (ABCB1) and Ko143 (ABCG2): K562-Dox LD50asciminib+cyclosporine = 13 nM, K562-ABCG2 LD50asciminib+Ko143 = 15 nM (p < 0.001). When asciminib resistance was modelled in vitro, ABCB1 and ABCG2 overexpression was integral in the development of asciminib resistance. In K562 asciminib-resistant cells, ABCG2 expression increased prior to BCR-ABL1 overexpression and remained high (up to 7.6-fold greater levels in resistant vs control cells, p < 0.001). K562-Dox asciminib-resistant cells had increased ABCB1 expression (2.1-fold vs control cells p = 0.0033). KU812 asciminib-resistant cells overexpressed ABCB1 (5.4-fold increase, p < 0.001) and ABCG2 (6-fold increase, p < 0.001) before emergence of a novel myristate-binding pocket mutation (F497L). In all three cell lines, asciminib resistance was reversible upon chemical inhibition of ABCB1, ABCG2 or both (p < 0.001). When K562 asciminib-resistant cells were treated with asciminib in combination with clinically achievable doses of either imatinib or nilotinib, reversal of the resistance phenotype was also observed (p < 0.01). Overexpression of efflux transporters will likely be an important pathway for asciminib resistance in the clinical setting. Given the lack of evidence for ABCG2-mediated transport of nilotinib or imatinib at clinically relevant concentrations, our data provide an additional rationale for using asciminib in combination with either TKI.

Keywords: ABCB1; ABCG2; ABL001; asciminib; resistance.


Conflict of interest statement

CONFLICTS OF INTEREST LNE and VAS have no conflict of interest to declare. DLW receives honoraria and research funds from Novartis Pharmaceuticals and is a member of Advisory Boards for Novartis. SB and TPH receive honoraria and research funds from Novartis Pharmaceuticals, BMS and Ariad and are members of Advisory Boards for Novartis, BMS and Ariad. However, Novartis, BMS and Ariad had no role in the design of the study, collection and analysis of data, nor the decision to publish.

Figures

Figure 1
Figure 1. Asciminib is susceptible to resistance mediated by overexpression of the drug efflux transporters ABCB1 and ABCG2
(A) K562, K562-Dox and K562-ABCG2 cells were cultured for 72 h in increasing concentrations of asciminib in the absence and presence of the ABCB1 inhibitor cyclosporine (cyclo) and the ABCG2 inhibitor Ko143. The concentration of asciminib required to kill 50% of cells (LD50asciminib) was determined by Annexin V/7-AAD staining. (B) K562 (C) K562-Dox (D) KU812 cells were cultured long-term in gradually increasing concentrations of asciminib and resistance determined by LD50asciminib (hatched bars). Resistance intermediates were also assessed for expression levels of ABCB1 and ABCG2 protein by flow cytometry (yellow and maroon lines respectively). The percentage of the cell population positive for transporter expression was normalised to individual cell line isotype controls and the resultant percentage positivity reported. p-STAT5 levels were assessed by the Milliplex® MAP assay (purple line, expressed as MFI), BCR-ABL1 mRNA was evaluated (black line, expressed as ratio of BCR) and the kinase domain sequenced for mutations (orange line). With the exception of the Milliplex® MAP assay and sequencing which were performed once, data represent the mean of at least three experiments. Analyses were performed using unpaired Student’s t-test (Welch’s correction was applied for data groups with unequal SD) or Mann-Whitney Rank Sum test. Statistically significant increases in LD50asciminib compared with control are denoted by asterisks; significant decreases in the presence of ABCB1/ABCG2 inhibitors are denoted by hashes (***p < 0.001). Error bars represent SEM.
Figure 2
Figure 2. Increased function of ABCB1 and ABCG2 is responsible for asciminib resistance
(A) K562 and (B–C) KU812 cells were stained with the fluorescent substrates BODIPY–prazosin and rhodamine 123 as indicated. Fluorescence was determined in the absence and presence of (A–B) the specific ABCG2 inhibitor Ko143 and (C) the ABCB1 inhibitors verapamil, cyclosporine and PSC-833. Data represent the mean of at least three experiments. Analyses were performed using unpaired Student’s t-test (Welch’s correction was applied for data groups with unequal SD). Statistically significant increases in MFI in the presence of transporter inhibition are denoted by asterisks; significant decreases in MFI in resistant cells compared with control cells are denoted by hashes (*p < 0.05, **p < 0.01). Error bars represent SEM. MFI = mean fluorescent intensity. n/s = not significant.
Figure 3
Figure 3. Inhibition of ABCB1 and ABCG2 reverses asciminib resistance in vitro
LD50asciminib was determined in (A) K562 control and 500 nM, 10 μM asciminib cells in the absence and presence of the ABCG2 inhibitor Ko143 (B) K562-Dox control and 150 nM, 500 nM, 10 μM asciminib cells in the absence and presence of the ABCB1 inhibitor cyclosporine (C) KU812 control and 5 nM, 10 μM asciminib cells in the absence and presence of Ko143 and verapamil. Statistical analyses compared 1) control cells vs resistant cells in the absence of inhibition (asterisks) 2) cells in the absence vs presence of ABCB1/ABCG2 inhibition (hashes) and 3) control cells in the absence of inhibition vs resistant cells in the presence of ABCB1/ABCG2 inhibition (carets). Analyses were performed using unpaired Student’s t-test (Welch’s correction was applied for data groups with unequal SD) or Mann-Whitney Rank Sum test. Statistically significant p-values are denoted by carets (^), hashes (#) or asterisks (*p < 0.05, **p < 0.01, ***p < 0.001). Error bars represent SEM. Cyclo = cyclosporine; Ver = verapamil.
Figure 4
Figure 4. F497L demonstrates sensitivity to imatinib and nilotinib in vitro
(A) LD50IM (B) LD50NIL and (C) LD50DAS were determined in KU812 control cells compared with KU812 10 μM asciminib cells (F497L mutation at 100%) in the absence and presence of dual ABCB1 (verapamil) and ABCG2 (Ko143) inhibition. Statistical analyses compared 1) control cells vs resistant cells in the absence of inhibition (asterisks) 2) resistant cells in the absence vs presence of ABCB1/ABCG2 inhibition (hashes) and 3) control cells in the absence of inhibition vs resistant cells in the presence of ABCB1/ABCG2 inhibition (carets). Data represent the mean of at least three independent assays. Analyses were performed using unpaired Student’s t-test (Welch’s correction was applied for data groups with unequal SD). Statistically significant p-values are denoted by carets (^), hashes (#) or asterisks (*p < 0.05, **p < 0.01, ***p < 0.001). Error bars represent SEM. Ver = verapamil.
Figure 5
Figure 5. 1 μM and 2 μM imatinib and 150 nM nilotinib significantly reverse resistance in K562 10 μM asciminib cells when used in combination with asciminib
K562 10 μM asciminib cells were cultured for 72 h in increasing concentrations of asciminib in the absence and presence of 1 μM imatinib, 2 μM imatinib and 150 nM nilotinib. K562 control cells were cultured in proportionately less concentrations of TKI. The concentration of asciminib required to kill 50% of cells (LD50asciminib) was determined by Annexin V/7-AAD staining. Data represent the mean of at least 3 independent experiments. Analyses were performed using unpaired Student’s t-test (Welch’s correction was applied for data groups with unequal SD). Statistical analyses compared the LD50asciminib in K562 10 μM asciminib vs K562 control cells (asterisks) and also the LD50asciminib in K562 control/K562 10 μM asciminib when asciminib was used as a single agent vs asciminib used in combination with the specified concentrations of imatinib and nilotinib (hashes). Statistically significant alterations in LD50asciminib are indicated (*p < 0.05, ***p < 0.01, ***p < 0.001). Error bars represent SEM. IM = imatinib. NIL = nilotinib.

References

    1. Druker BJ, Tamura S, Buchdunger E, Ohno S, Segal GM, Fanning S, Zimmermann J, Lydon NB. Effects of a selective inhibitor of the Abl tyrosine kinase on the growth of Bcr-Abl positive cells. Nat Med. 1996;2:561–6. - PubMed
    1. Druker BJ, Guilhot F, O’Brien SG, Gathmann I, Kantarjian H, Gattermann N, Deininger MW, Silver RT, Goldman JM, Stone RM, Cervantes F, Hochhaus A, Powell BL, et al. IRIS Investigators Five-year follow-up of patients receiving imatinib for chronic myeloid leukemia. N Engl J Med. 2006;355:2408–17. https://doi.org/10.1056/NEJMoa062867. - DOI - PubMed
    1. Hochhaus A, Saglio G, Larson RA, Kim DW, Etienne G, Rosti G, De Souza C, Kurokawa M, Kalaycio ME, Hoenekopp A, Fan X, Shou Y, Kantarjian HM, et al. Nilotinib is associated with a reduced incidence of BCR-ABL mutations vs imatinib in patients with newly diagnosed chronic myeloid leukemia in chronic phase. Blood. 2013;121:3703–8. https://doi.org/10.1182/blood-2012-04-423418. - DOI - PMC - PubMed
    1. Kantarjian H, Shah NP, Hochhaus A, Cortes J, Shah S, Ayala M, Moiraghi B, Shen Z, Mayer J, Pasquini R, Nakamae H, Huguet F, Boque C, et al. Dasatinib versus imatinib in newly diagnosed chronic-phase chronic myeloid leukemia. N Engl J Med. 2010;362:2260–70. https://doi.org/10.1056/NEJMoa1002315. - DOI - PubMed
    1. Giles FJ, le Coutre PD, Pinilla-Ibarz J, Larson RA, Gattermann N, Ottmann OG, Hochhaus A, Radich JP, Saglio G, Hughes TP, Martinelli G, Kim DW, Novick S, et al. Nilotinib in imatinib-resistant or imatinib-intolerant patients with chronic myeloid leukemia in chronic phase: 48-month follow-up results of a phase II study. Leukemia. 2013;27:107–12. https://doi.org/10.1038/leu.2012.181. - DOI - PubMed

LinkOut - more resources