. 2018 Feb 7;9(17):13666-13681.
doi: 10.18632/oncotarget.24446. eCollection 2018 Mar 2.

Persistent DNA strand breaks induce a CAF-like phenotype in normal fibroblasts

Affiliations

Persistent DNA strand breaks induce a CAF-like phenotype in normal fibroblasts

Arnaud J Legrand et al. Oncotarget. .

Abstract

Cancer-associated fibroblasts (CAFs) are an emerging target for cancer therapy as they promote tumour growth and metastatic potential. However, CAF targeting is complicated by the lack of knowledge-based strategies aiming to selectively eliminate these cells. There is a growing body of evidence suggesting that a pro-inflammatory microenvironment (e.g. ROS and cytokines) promotes CAF formation during tumorigenesis, although the exact mechanisms involved remain unclear. In this study, we reveal that a prolonged pro-inflammatory stimulation causes a de facto deficiency in base excision repair, generating unrepaired DNA strand breaks and thereby triggering an ATF4-dependent reprogramming of normal fibroblasts into CAF-like cells. Based on the phenotype of in vitro-generated CAFs, we demonstrate that midostaurin, a clinically relevant compound, selectively eliminates CAF-like cells deficient in base excision repair and prevents their stimulatory role in cancer cell growth and migration.

Keywords: base excision repair; cancer-associated fibroblasts; midostaurin; tumour microenvironment; tumour stroma.


Conflict of interest statement

CONFLICTS OF INTEREST The authors declare no conflicts of interest.

Figures
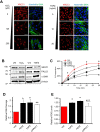
Figure 1
Figure 1. Persistent exposure of fibroblasts to ROS or TGFβ leads to a decrease of BER capacity
(AB) Effect of H2O2 or TGFβ on XRCC1, α-SMA and PALLD levels. (A) TIG-1 fibroblasts were treated for 72 h with H2O2 or TGFβ at the indicated concentrations, H2O2 was administered every 24 h. Cells were analysed by immunofluorescence using antibodies staining for α-SMA and XRCC1. Nuclei were stained with Hoechst. Scale bars: 50 μm. In (B) TIG-1 fibroblasts were treated for 72 h with either 125 μM H2O2 or 10 ng/ml TGFβ. Protein expression was analysed by Western blot. (C) Effect of H2O2 and TGFβ on BER capacity. Cells were treated as described in (B) and BER capacity was assessed by the in vitro repair assay using nuclear cell extracts generated from the indicated samples. The plot shows the percentage of substrate to product conversion over time using in vitro ligation assays as described in “Material and methods”. (D) Effect of H2O2 and TGFβ on DNA damage accumulation. TIG-1 fibroblasts were treated as in (B) or depleted for XRCC1 by means of siRNA. DNA damage accumulation was assessed 72h later using the alkaline comet assay. (E) Effect of TGFβ (10 ng/ml), H2O2 (20 μM), or XRCC1 depletion on the levels of intracellular ROS. TIG-1 fibroblasts were treated as indicated and analysed by FACS for intracellular ROS content. Data are reported as mean ± SD of three independent experiments *p < 0.05; **p < 0.01. See also Supplementary Figure 1.
Figure 2
Figure 2. XRCC1 depletion leads to reprogramming of normal fibroblasts into CAF-like cells
(A) Schematic representation of the SILAC-based proteomics analysis. (B) Validation of protein expression changes at the transcriptional level. TIG-1 fibroblasts were transfected with either a non-targeting control siRNA (siCtrl), or an XRCC1-targeting siRNA for 72 h and expression of the indicated genes was analysed by qPCR. The dashed line represents the normalised expression level in siCtrl-treated cells. (C) Rescue of the expression of PALLD, FAP and α-SMA upon simultaneous depletion of XRCC1 and ATF4. Samples were analysed by qPCR 72 h after siRNA transfection. (D) XRCC1 KD fibroblasts show increased cytoskeleton density and an elongated shape. Cells were stained for α-tubulin (left panel). Nuclei were stained with Hoechst. Scale bars: 50 μm. Cell elongation ratio (right panel) was assessed by IN Cell high-throughput imagery, as described in Materials and methods. Statistical significance was evaluated by a non-parametric Mann-Whitney U Test. (E) XRCC1 depletion leads to contraction of the cytoskeleton.TIG-1 fibroblasts were treated as in (B) and analysed for contractility. Relative contraction was assessed using a collagen gel-based assay, as described in Materials and methods. (FG) XRCC1 depletion leads to increased expression of PALLD and α-SMA. TIG-1 fibroblasts were treated as in (B) and analysed by immunofluorescence (F) or western blotting (G). Cells were stained for PALLD and α-SMA. Nuclei were stained with Hoechst. Scale bars: 50 μm. (HI) Effect of XRCC1 depletion on fibroblast migration. Cells were incubated with the indicated siRNA for 48 h before the wound was generated and monitored through live microscopy for 20 h. Individual cells were manually tracked and their dispersion (H) or velocity (I) was calculated. Results are presented as mean ± SD of at least three independent experiments *p < 0.05; **p < 0.01; ***p < 0.001.
Figure 3
Figure 3. Calcium release is required for cytoskeleton contraction and migration of XRCC1 KD fibroblasts
(A) Effect of PLC inhibition on cytoskeleton contraction. TIG-1 fibroblasts were treated with the indicated siRNA for 72 h. The PLC inhibitor edelfosine (PLCi, 10 μm) was added during the final 48 h of the experiment. Cells were subsequently stained for α-tubulin and α-SMA. Nuclei were stained with Hoechst. Scale bars: 50 μm. (BC) Effect of simultaneous XRCC1 depletion and PLC inhibition on fibroblast migration. TIG-1 fibroblasts were treated with the indicated siRNA and incubated with PLCi 24 h before the wound was generated and the acquisition was carried out under live cell microscopy for 20h. Individual cells were manually tracked to analyse their velocity (B) and dispersion (C). ***p < 0.001.
Figure 4
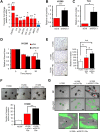
Figure 4. XRCC1 KD fibroblasts promote growth and migration of cancer cells
(A) Effect of XRCC1 depletion on the expression of secreted proteins. TIG-1 fibroblasts were depleted of XRCC1 and expression of the indicated genes was analysed by qPCR. The dashed line represents the normalised expression level in cells treated with control siRNA. (BC) Stimulation of proliferation of H1299 (B) or T24 (C) cells by medium conditioned by XRCC1 KD fibroblasts. TIG-1 fibroblasts were treated with the indicated siRNAs for 72 h, conditioned medium was then collected and used to feed cancer cells for five days. (D) Stimulation of migration of H1299 cells by medium conditioned by XRCC1 KD TIG-1 fibroblasts. Conditioned medium was generated as in (B), H1299 were then fed with the conditioned medium for 24 h before assessing their migration using a wound healing assay. Faster wound closure indicates higher migration capacity. (E) Increased invasion of H1299 cells in co-culture with XRCC1 KD fibroblasts. TIG-1 fibroblasts were treated with the indicated siRNAs for 48 h and then cultured together with H1299 cells in Boyden chambers in the presence of conditioned medium. Images were acquired 24h after cell seeding and invading cells were counted. Scale bars: 200 µm. (F) Stimulation of invasion of H1299 cells by XRCC1 KD fibroblasts. Cell spheroids were generated by culturing H1299 cells alone or by co-culturing H1299 cells together with TIG-1 fibroblasts (FBs) which were pretreated with the indicated siRNA. Two days after plating onto Matrigel, the spheroids were assessed for their tumorigenic potential by counting the number of invasive spikes (right). (G) Migration via network structure formation on three-dimensional Matrigel. H1299-GFP cancer spheroids were plated on a Matrigel matrix. After spheroid seeding, a single cell suspension of either control (siCtrl) or XRCC1 KD fibroblasts (FBs) was added on top of the spheroid culture and imaged 24 h later. siXRCC1-treated fibroblasts created a network characterised by H1299-GFP cancer spheroid invasion (red arrows). Enlargements of these networks are shown on the right panel: XRCC1 KD fibroblasts (black arrows) appear to open the way for H1299-GFP cells (green arrows). Scale bars: 100 µm. BF: Bright field. Representative fields are reported. Results are presented as mean ± SD of at least three independent experiments *p < 0.05; ***p < 0.001.
Figure 5
Figure 5. Expression of BER genes in clinical stroma samples negatively correlates with CAF markers
(A) Plot showing the correlation between XRCC1 expression levels and the expression level of a number of human genes in 207 fibroblast datasets. BER and replication-associated genes (green dots) positively correlate with XRCC1 expression, whereas CAF markers (yellow and red dots) negatively correlate with XRCC1. Correlation is expressed as Z-score. A complete list of genes correlating with XRCC1 expression can be found in Supplementary Table 3. (B) Density plot depicting the distribution of tumour against control cases and the variation in XRCC1 expression within the samples analysed. The dashed line shows the arbitrary threshold selected to separate samples on the basis of XRCC1 expression level. Expression values correspond to the log2 median-centred values by sample. (C) Boxplot showing the median-centred expression of XRCC1 in tumour cases against controls using the threshold selected in (B). (D) Histogram showing the average expression of the indicated genes in low-XRCC1 vs. high-XRCC1 expressing samples.
Figure 6
Figure 6. Midostaurin eliminates XRCC1 KD fibroblasts and negatively affects their stimulatory ability towards cancer cells
(A) Heat-map showing the expression of the genes selected from a “BER/CAF” signature in both midostaurin-resistant and -sensitive cell lines. Each column represents an individual cell line. The mean differential gene expression between midostaurin-resistant and -sensitive cell lines is reported for each individual gene of interest as a fold change (left-hand side). (B) Sensitivity of XRCC1 KD fibroblasts to midostaurin. TIG-1 fibroblasts were treated with the indicated siRNA for 48 h before exposure to increasing concentrations of midostaurin for 72 h. Cell viability was assessed using resazurin. (C) Increased apoptosis in XRCC1 KD fibroblasts after exposure to midostaurin. TIG-1 fibroblasts were treated as in (B). Caspase activity was assessed upon incubation with midostaurin (8 μM, 48 h). Specificity of the assay was confirmed by co-incubation of the drugs with the pan-caspase inhibitor zVAD. (D) Migration via network structure formation on three-dimensional Matrigel. H1299-GFP cancer spheroids were seeded on Matrigel. Either control (siCtrl) or XRCC1 KD fibroblasts (FBs) were then added on top of the spheroid culture and imaged 24 h later. Midostaurin (1 μM) was used to pre-treat the fibroblasts and then administered to the spheroids for a further 24 h. Scale bars: 100 µm. BF: Bright field. Representative fields are reported.

References

    1. Hanahan D, Coussens LM. Accessories to the crime: functions of cells recruited to the tumor microenvironment. Cancer Cell. 2012;21:309–22. - PubMed
    1. Kalluri R. The biology and function of fibroblasts in cancer. Nat Rev Cancer. 2016;16:582–98. - PubMed
    1. Sugimoto H, Mundel TM, Kieran MW, Kalluri R. Identification of fibroblast heterogeneity in the tumor microenvironment. Cancer Biol Ther. 2006;5:1640–6. - PubMed
    1. Erez N, Truitt M, Olson P, Arron ST, Hanahan D. Cancer-Associated Fibroblasts Are Activated in Incipient Neoplasia to Orchestrate Tumor-Promoting Inflammation in an NF-kappaB-Dependent Manner. Cancer Cell. 2010;17:135–47. - PubMed
    1. Calon A, Tauriello DV, Batlle E. TGF-beta in CAF-mediated tumor growth and metastasis. Semin Cancer Biol. 2014;25:15–22. - PubMed