

Michael addition-based probes for ratiometric fluorescence imaging of protein S-depalmitoylases in live cells and tissues
- PMID: 29568422
- PMCID: PMC5848818
- DOI: 10.1039/c7sc02805a
Michael addition-based probes for ratiometric fluorescence imaging of protein S-depalmitoylases in live cells and tissues
Erratum in
-
Correction: Michael addition-based probes for ratiometric fluorescence imaging of protein S-depalmitoylases in live cells and tissues.Chem Sci. 2017 Nov 1;8(11):7879. doi: 10.1039/c7sc90066j. Epub 2017 Oct 12. Chem Sci. 2017. PMID: 30123473 Free PMC article.
Abstract
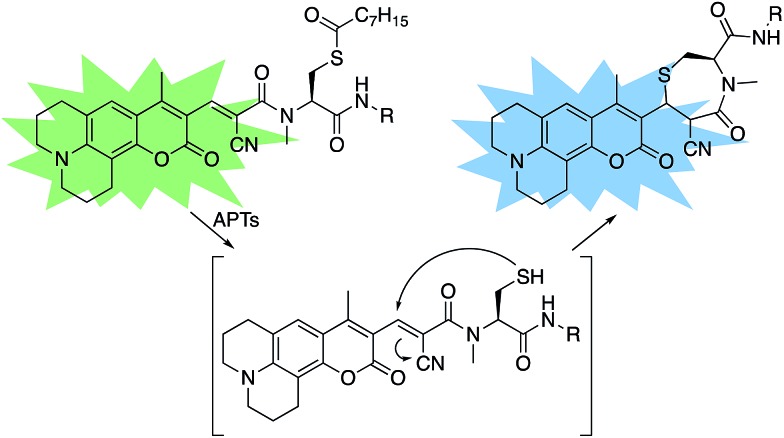
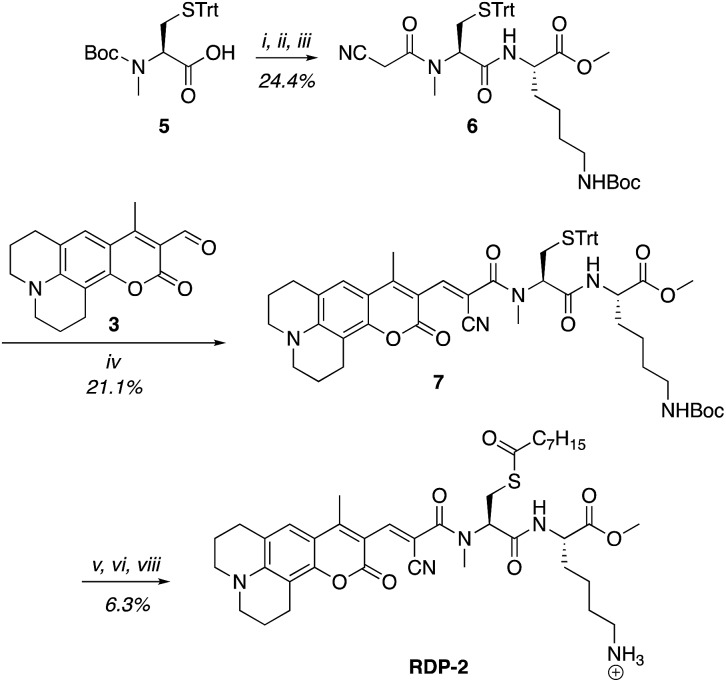
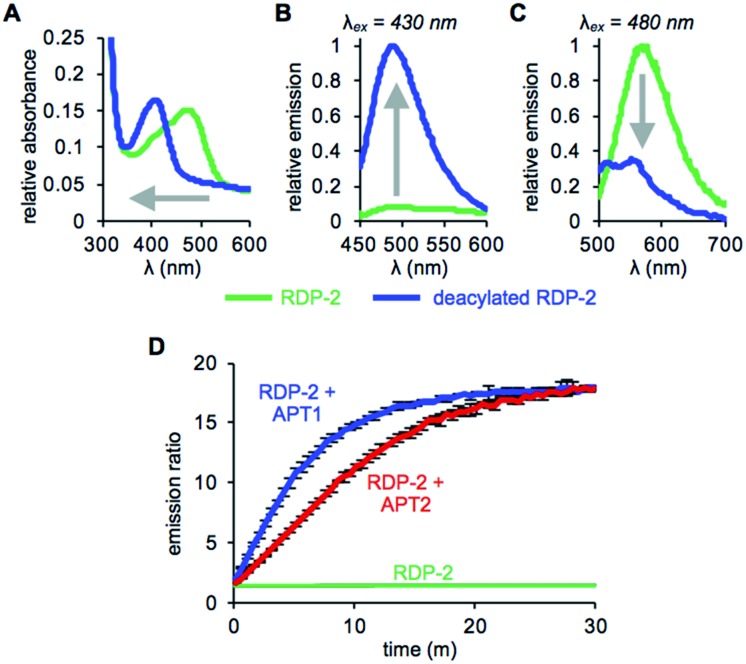
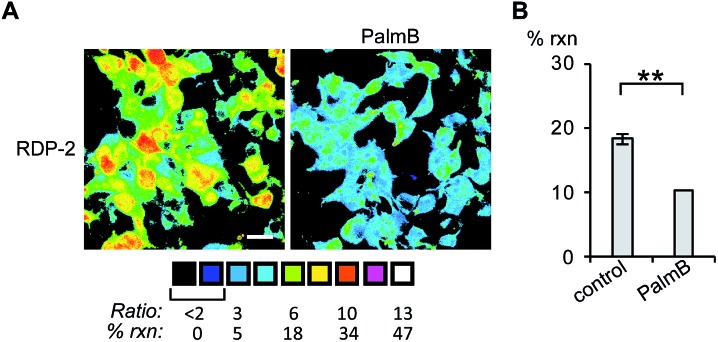
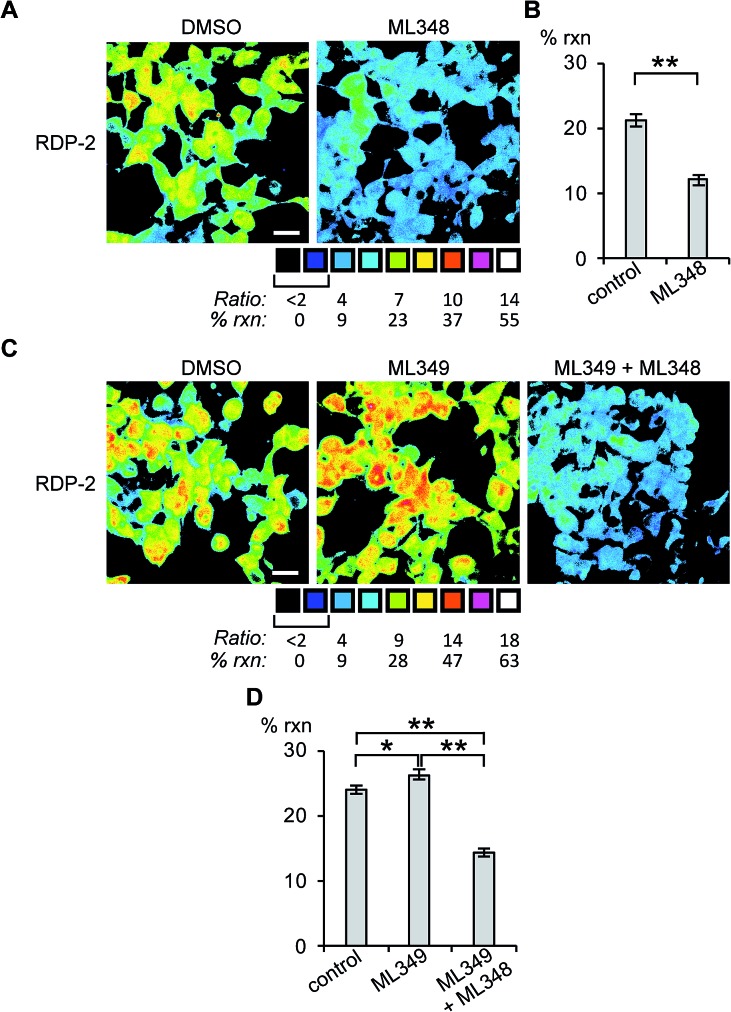
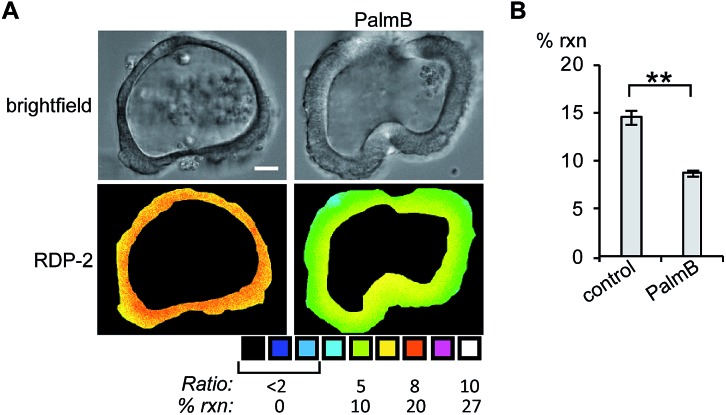
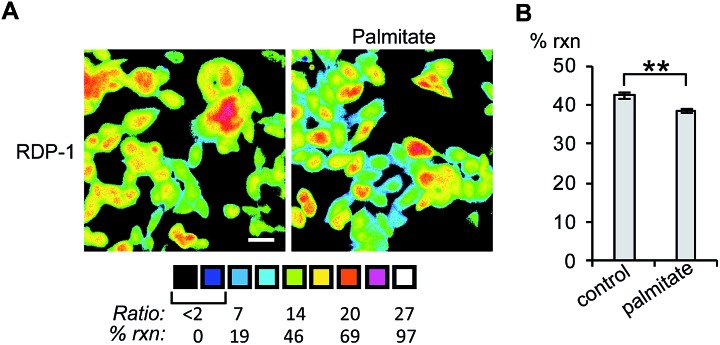
The reversible modification of cysteine residues through thioester formation with palmitate (protein S-palmitoylation) is a prevalent chemical modification that regulates the function, localization, and stability of many proteins. Current methods for monitoring the "erasers" of S-palmitoylation, acyl-protein thioesterases (APTs), rely on destructive proteomic methods or "turn-on" probes, precluding deployment in heterogeneous samples such as primary tissues. To address these challenges, we present the design, synthesis, and biological evaluation of Ratiometric Depalmitoylation Probes (RDPs). RDPs respond to APTs with a robust ratiometric change in fluorescent signal both in vitro and in live cells. Moreover, RDPs can monitor endogenous APT activities in heterogeneous primary human tissues such as colon organoids, presaging the utility of these molecules in uncovering novel roles for APTs in metabolic regulation.
Figures
Similar articles
-
Activity-Based Sensing of S-Depalmitoylases: Chemical Technologies and Biological Discovery.Acc Chem Res. 2019 Nov 19;52(11):3029-3038. doi: 10.1021/acs.accounts.9b00354. Epub 2019 Oct 2. Acc Chem Res. 2019. PMID: 31577124 Free PMC article. Review.
-
Measuring S-Depalmitoylation Activity In Vitro and In Live Cells with Fluorescent Probes.Methods Mol Biol. 2019;2009:99-109. doi: 10.1007/978-1-4939-9532-5_8. Methods Mol Biol. 2019. PMID: 31152398 Free PMC article.
-
Active and dynamic mitochondrial S-depalmitoylation revealed by targeted fluorescent probes.Nat Commun. 2018 Jan 23;9(1):334. doi: 10.1038/s41467-017-02655-1. Nat Commun. 2018. PMID: 29362370 Free PMC article.
-
A fluorescent probe for cysteine depalmitoylation reveals dynamic APT signaling.Nat Chem Biol. 2017 Feb;13(2):150-152. doi: 10.1038/nchembio.2262. Epub 2016 Dec 19. Nat Chem Biol. 2017. PMID: 27992880 Free PMC article.
-
Targeting protein palmitoylation: selective inhibitors and implications in disease.Expert Opin Drug Discov. 2014 Sep;9(9):1005-19. doi: 10.1517/17460441.2014.933802. Epub 2014 Jun 26. Expert Opin Drug Discov. 2014. PMID: 24967607 Review.
Cited by
-
Dynamic PRDX S-acylation modulates ROS stress and signaling.Cell Chem Biol. 2025 Mar 20;32(3):511-519.e5. doi: 10.1016/j.chembiol.2025.01.009. Epub 2025 Feb 25. Cell Chem Biol. 2025. PMID: 40010334
-
A mitochondrial-targeted activity-based sensing probe for ratiometric imaging of formaldehyde reveals key regulators of the mitochondrial one-carbon pool.Chem Sci. 2024 Apr 25;15(21):8080-8088. doi: 10.1039/d4sc01183j. eCollection 2024 May 29. Chem Sci. 2024. PMID: 38817555 Free PMC article.
-
Recent advances in ratiometric fluorescence imaging of enzyme activity in vivo.Curr Opin Chem Biol. 2024 Jun;80:102441. doi: 10.1016/j.cbpa.2024.102441. Epub 2024 Mar 7. Curr Opin Chem Biol. 2024. PMID: 38457961 Free PMC article. Review.
-
Inhibitors of DHHC family proteins.Curr Opin Chem Biol. 2021 Dec;65:118-125. doi: 10.1016/j.cbpa.2021.07.002. Epub 2021 Aug 28. Curr Opin Chem Biol. 2021. PMID: 34467875 Free PMC article. Review.
-
Lysophospholipases cooperate to mediate lipid homeostasis and lysophospholipid signaling.J Lipid Res. 2019 Feb;60(2):360-374. doi: 10.1194/jlr.M087890. Epub 2018 Nov 27. J Lipid Res. 2019. PMID: 30482805 Free PMC article.
References
Grants and funding
LinkOut - more resources
Full Text Sources
Other Literature Sources
Molecular Biology Databases