

An acidic pH independent piperazine-TPE AIEgen as a unique bioprobe for lysosome tracing
- PMID: 29568423
- PMCID: PMC5848814
- DOI: 10.1039/c7sc03515b
An acidic pH independent piperazine-TPE AIEgen as a unique bioprobe for lysosome tracing
Abstract
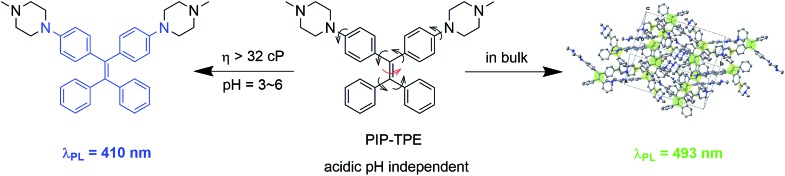
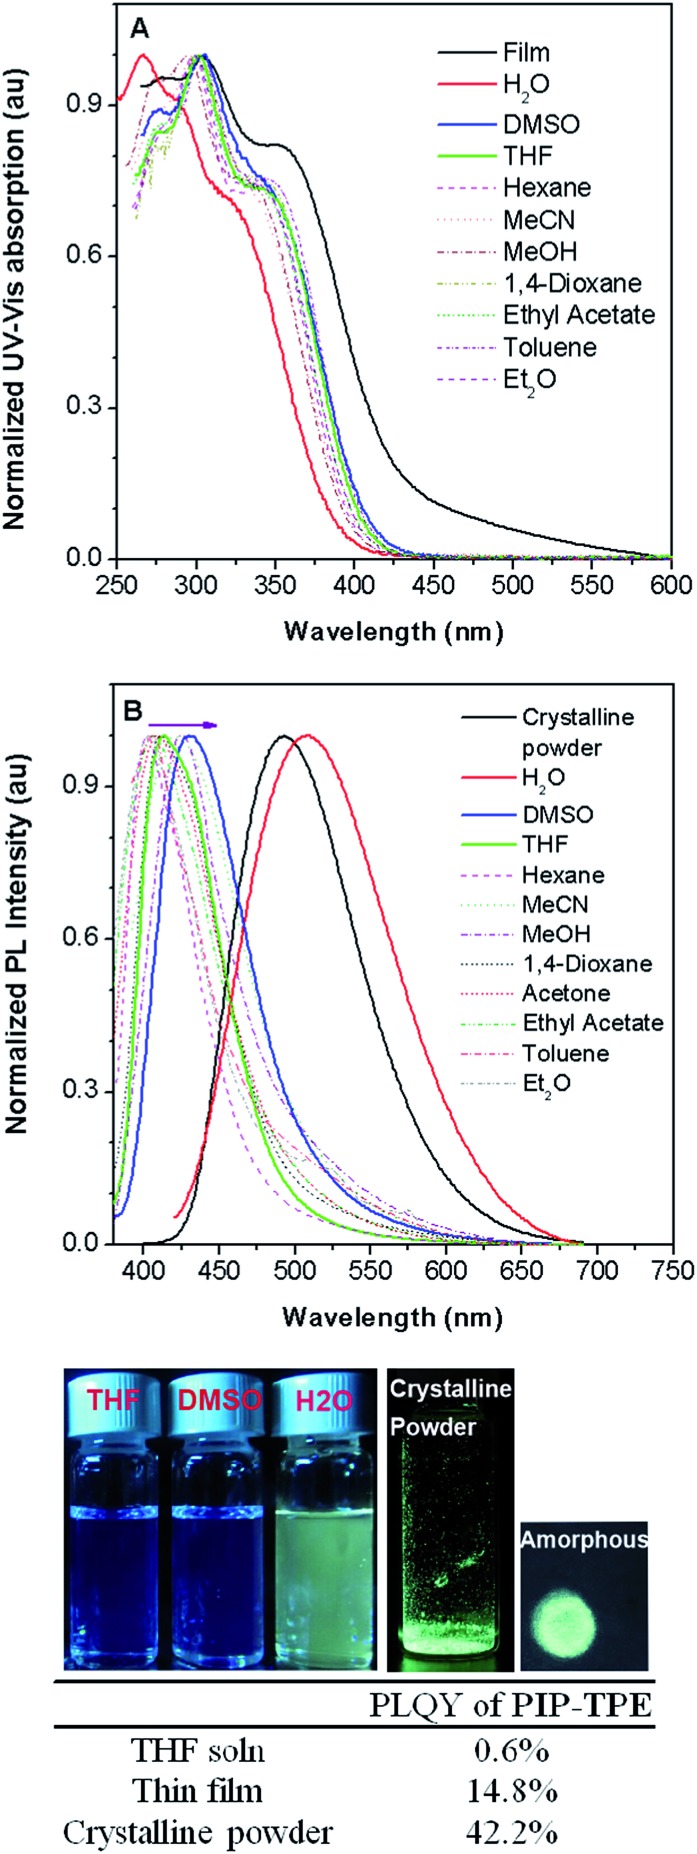
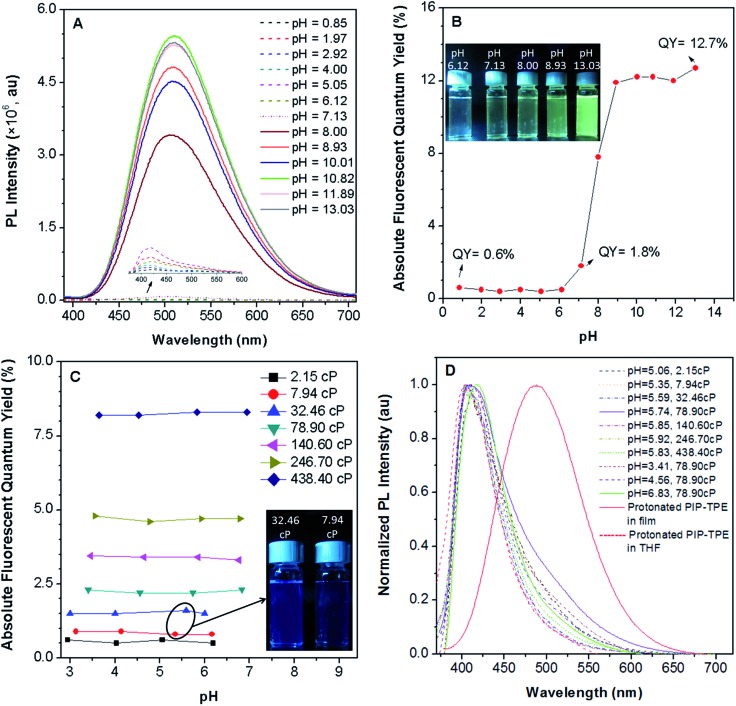
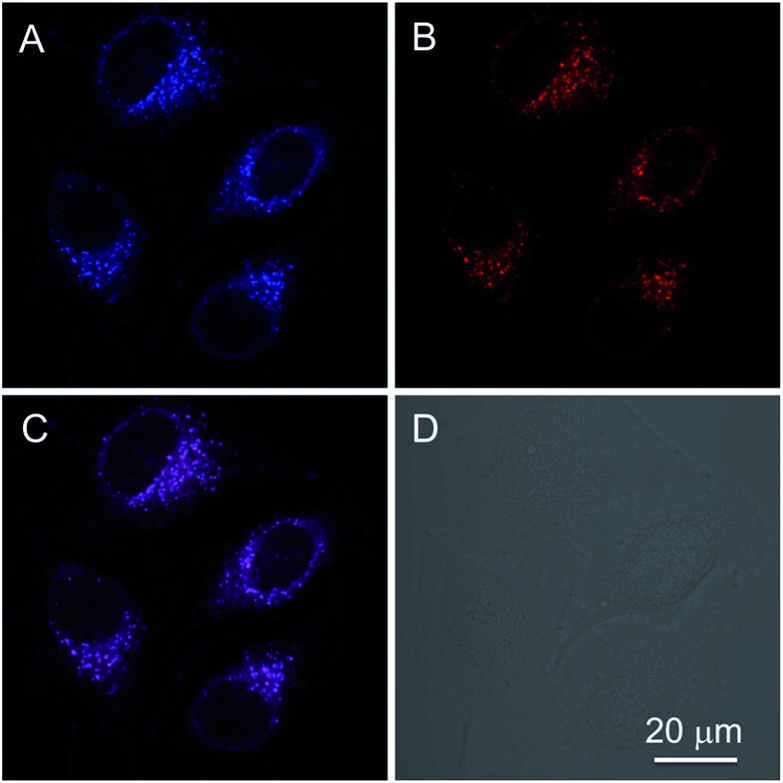
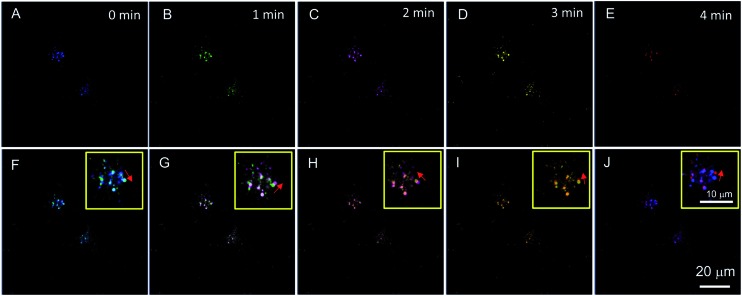
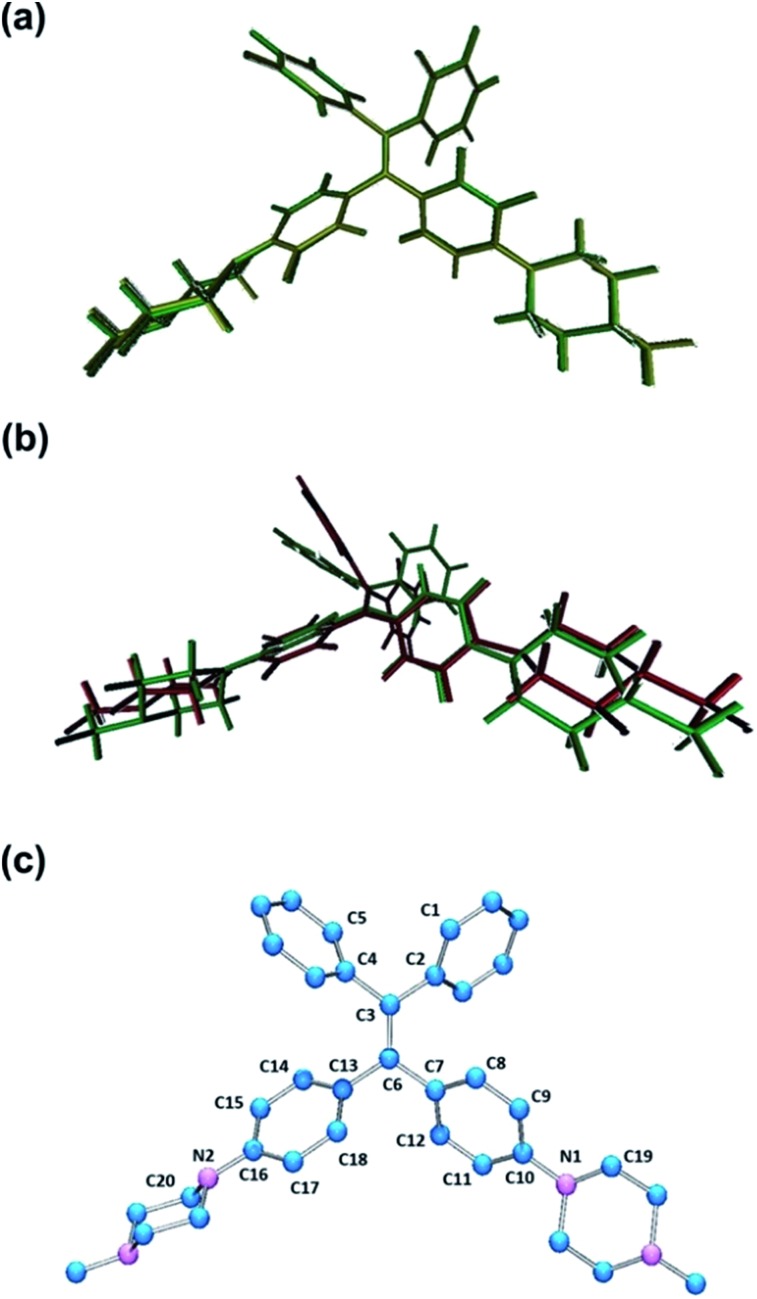
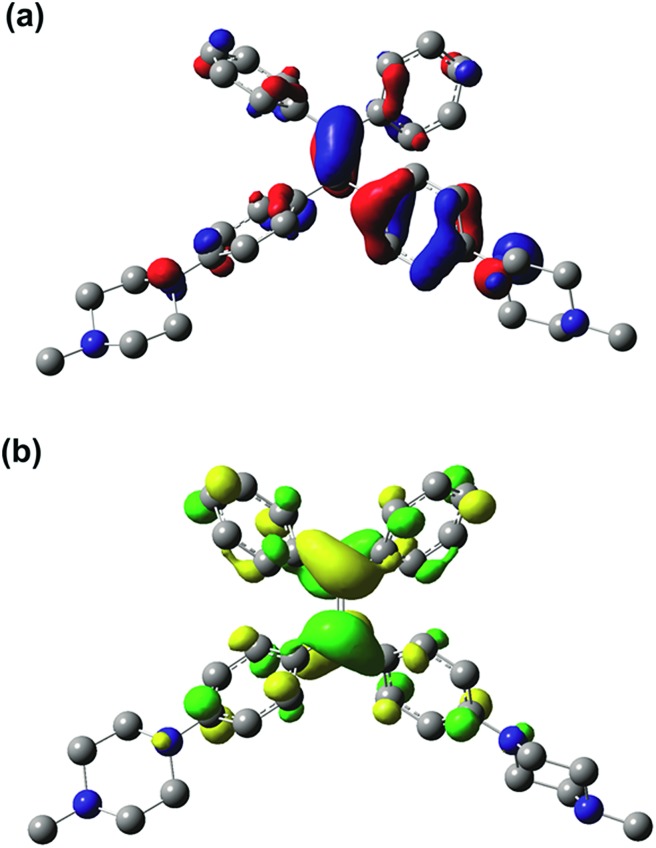
Lysosomes are involved in a multitude of cellular processes and their dysfunction is associated with various diseases. They are the most acidic organelles (pH 3.8-6.6, size 0.1-1.2 μm) with the highest viscosity (47-190 cP at 25 °C) in the cell. Because of their acidity, pH dependent non-AIE active fluorescent lysosomal probes have been developed that rely on protonation inhibited photoinduced electron transfer (PET). In this work, an acidic pH independent lysosome targetable piperazine-TPE (PIP-TPE) AIEgen has been designed with unique photophysical properties making it a suitable probe for quantifying viscosity. In a non-aggregated state PIP-TPE shows deep-blue emission as opposed to its yellowish-green emission in the bulk. It possesses high specificity for lysosomes with negligible cytotoxicity and good tracing ability due to its better photostability compared to LysoTracker Red. In contrast to most known lysosome probes that rely solely on PET, restriction of intramolecular motion (RIM) due to the larger viscosity inside the lysosomes is the mechanism responsible for PIP-TPE's fluorescence. PIP-TPE's high selectivity is attributed to its unique molecular design that features piperazine fragments providing a perfect balance between lipophilicity and polarity.
Figures
Similar articles
-
A photostable AIE fluorogen for lysosome-targetable imaging of living cells.J Mater Chem B. 2016 Aug 28;4(32):5412-5417. doi: 10.1039/c6tb01293k. Epub 2016 Jul 27. J Mater Chem B. 2016. PMID: 32263464
-
A new GFP fluorophore-based probe for lysosome labelling and tracing lysosomal viscosity in live cells.J Mater Chem B. 2018 Nov 7;6(41):6592-6598. doi: 10.1039/c8tb01885e. Epub 2018 Oct 1. J Mater Chem B. 2018. PMID: 32254867
-
Tetraphenylethylene-based AIE nanoprobes for labeling lysosome by two-photon imaging in living cells.Spectrochim Acta A Mol Biomol Spectrosc. 2024 Feb 5;306:123630. doi: 10.1016/j.saa.2023.123630. Epub 2023 Nov 7. Spectrochim Acta A Mol Biomol Spectrosc. 2024. PMID: 37948932
-
Fluorescent Probes for Sensing and Imaging within Specific Cellular Organelles.Acc Chem Res. 2016 Oct 18;49(10):2115-2126. doi: 10.1021/acs.accounts.6b00292. Epub 2016 Sep 23. Acc Chem Res. 2016. PMID: 27661761 Review.
-
Macrocycles and cages based on tetraphenylethylene with aggregation-induced emission effect.Chem Soc Rev. 2018 Oct 1;47(19):7452-7476. doi: 10.1039/c8cs00444g. Chem Soc Rev. 2018. PMID: 30177975 Review.
Cited by
-
Near-infrared fluorescent probes with BODIPY donors and rhodamine and merocyanine acceptors for ratiometric determination of lysosomal pH variance.Sens Actuators B Chem. 2019 Sep 1;294:1-13. doi: 10.1016/j.snb.2019.05.005. Epub 2019 May 4. Sens Actuators B Chem. 2019. PMID: 31496551 Free PMC article.
-
Fluorescent probes for organelle-targeted bioactive species imaging.Chem Sci. 2019 May 24;10(24):6035-6071. doi: 10.1039/c9sc01652j. eCollection 2019 Jun 28. Chem Sci. 2019. PMID: 31360411 Free PMC article. Review.
-
Highly Reversible "On-Off-On" Fluorescence Switch Governed by pH, Utilizing Bis(Benzimidazole) Derivatives with Varied Link Groups.J Fluoresc. 2025 Jul;35(7):5251-5259. doi: 10.1007/s10895-024-03881-9. Epub 2024 Aug 26. J Fluoresc. 2025. PMID: 39186139
-
Dense and Acidic Organelle-Targeted Visualization in Living Cells: Application of Viscosity-Responsive Fluorescence Utilizing Restricted Access to Minimum Energy Conical Intersection.Anal Chem. 2023 Mar 28;95(12):5196-5204. doi: 10.1021/acs.analchem.2c04133. Epub 2023 Mar 17. Anal Chem. 2023. PMID: 36930819 Free PMC article.
-
Photodynamic Therapy: Past, Current, and Future.Int J Mol Sci. 2024 Oct 21;25(20):11325. doi: 10.3390/ijms252011325. Int J Mol Sci. 2024. PMID: 39457108 Free PMC article. Review.
References
LinkOut - more resources
Full Text Sources
Other Literature Sources
Molecular Biology Databases
Miscellaneous