. 2017 Nov 1;8(11):7604-7610.
doi: 10.1039/c7sc01475a. Epub 2017 Aug 30.

Optical control of GPR40 signalling in pancreatic β-cells

Affiliations

Optical control of GPR40 signalling in pancreatic β-cells

James Allen Frank et al. Chem Sci. .

Abstract

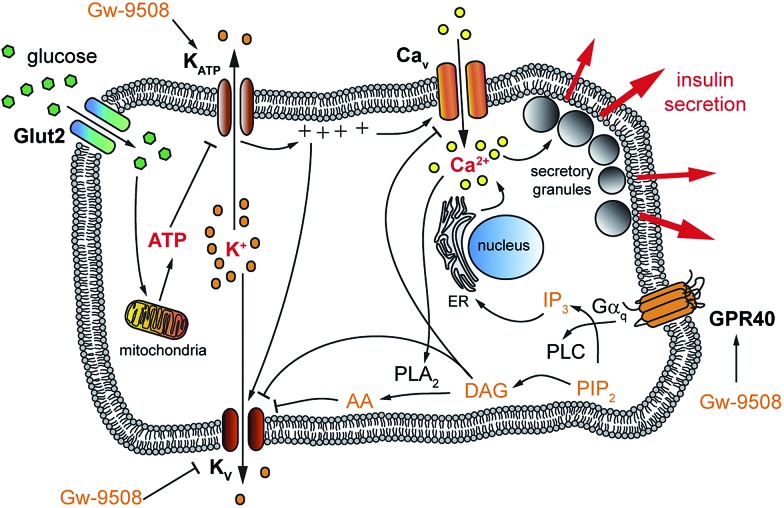
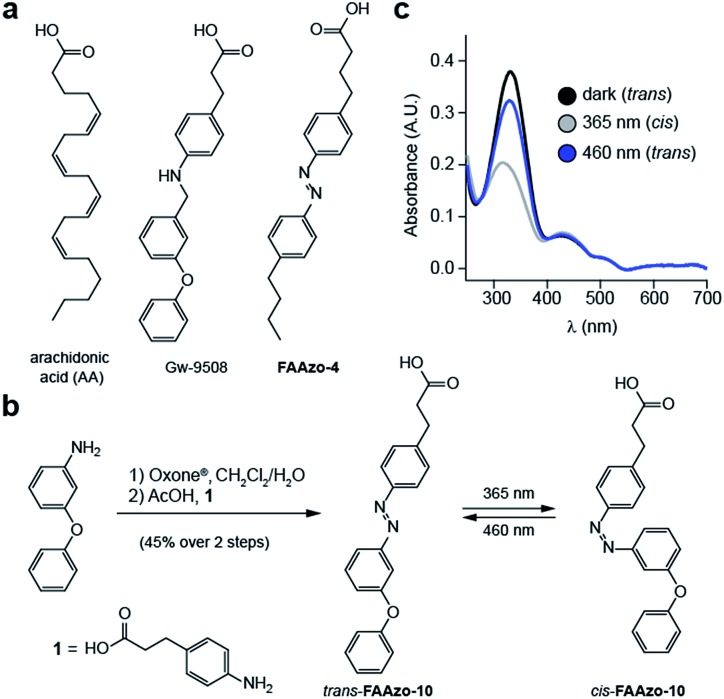
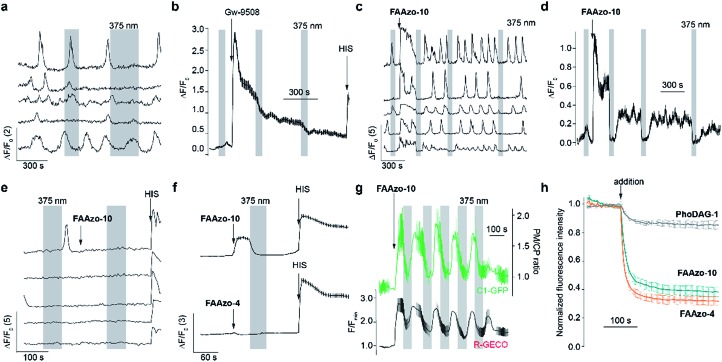
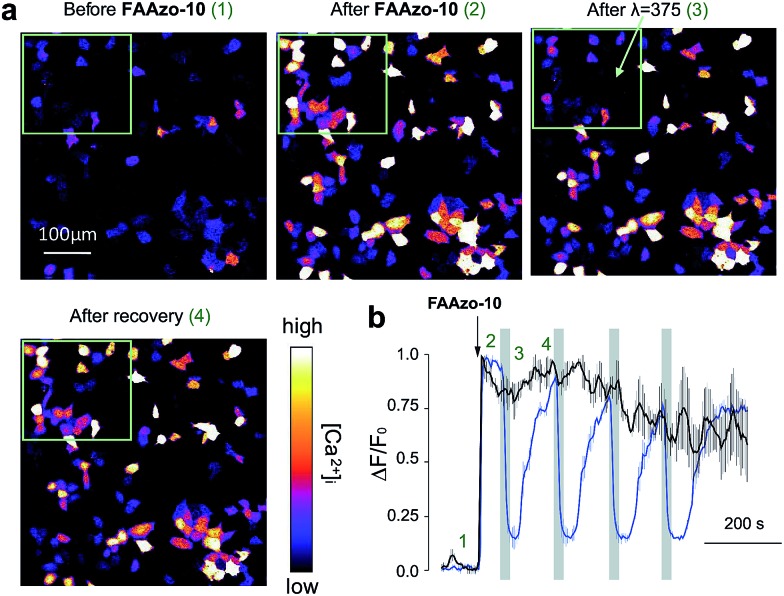
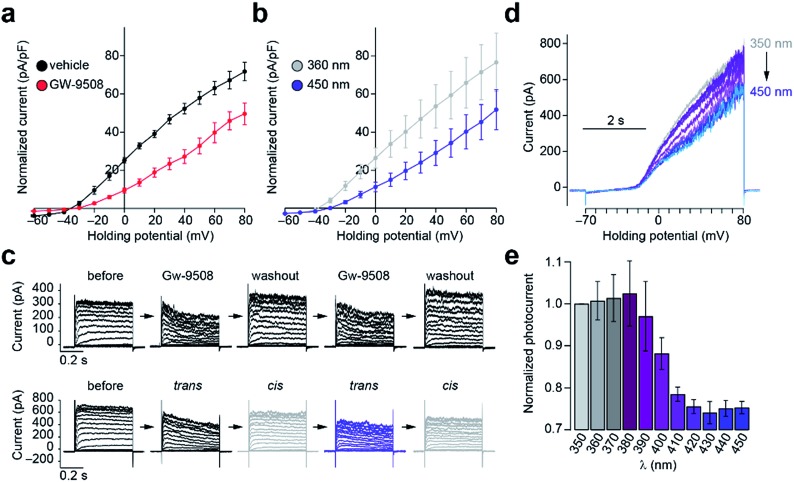
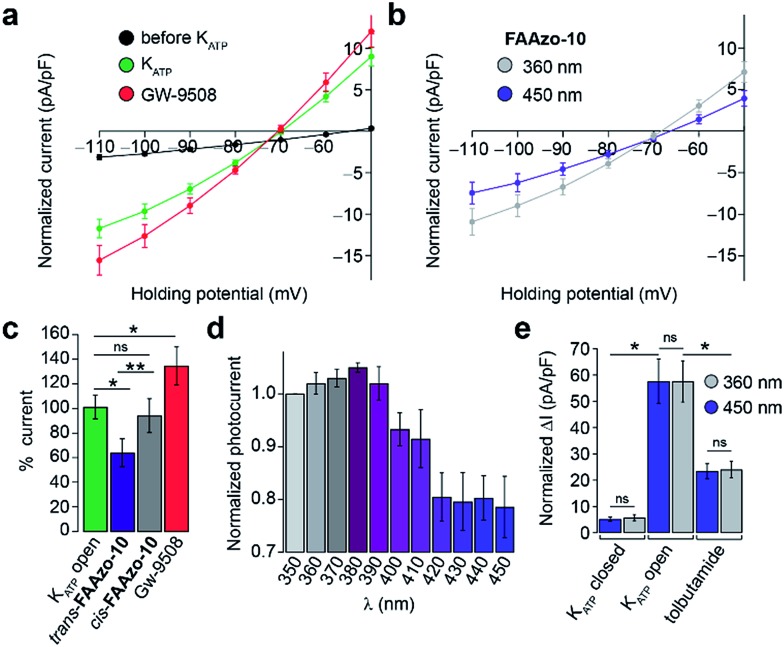
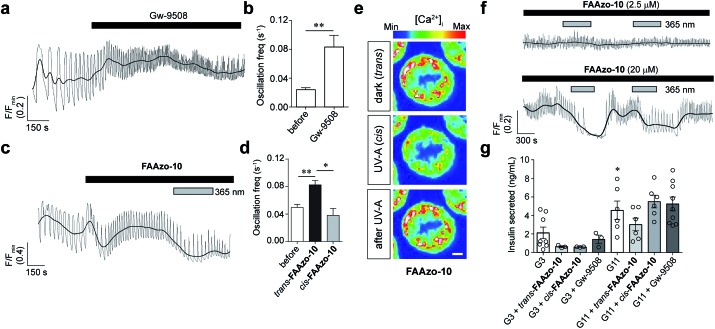
Fatty acids activate GPR40 and K+ channels to modulate β-cell function. Herein, we describe the design and synthesis of FAAzo-10, a light-controllable GPR40 agonist based on Gw-9508. FAAzo-10 is a potent GPR40 agonist in the trans-configuration and can be inactivated on isomerization to cis with UV-A light. Irradiation with blue light reverses this effect, allowing FAAzo-10 activity to be cycled ON and OFF with a high degree of spatiotemporal precision. In dissociated primary mouse β-cells, FAAzo-10 also inactivates voltage-activated and ATP-sensitive K+ channels, and allows us to control glucose-stimulated Ca2+ oscillations in whole islets with light. As such, FAAzo-10 is a useful tool to study the complex effects, with high specificity, which FA-derivatives such as Gw-9508 exert at multiple targets in mouse β-cells.


Figures

Fig. 1
Fig. 1. Glucose-stimulated insulin secretion (GSIS) from pancreatic β-cells. Upon uptake into the pancreatic β-cell, glucose is metabolized into ATP. The rising ATP/ADP ratio inhibits KATP which causes membrane depolarization and the opening of Cav. The resulting increased [Ca2+]i triggers the fusion of secretory granules and the release of insulin. Kv channels work to repolarize the cell, generating oscillations in [Ca2+]i. GPR40 stimulation also leads to increased [Ca2+]i, further potentiating GSIS.
Fig. 2
Fig. 2. Design and synthesis of photoswitchable GPR40 agonists. (a) The chemical structures of Gw-9508, AA and FAAzo-4. (b) Chemical synthesis of FAAzo-10, a photoswitchable derivative of Gw-9508. (c) The UV-Vis spectra of FAAzo-10 in its dark-adapted (black), UV-adapted (gray) and blue-adapted (blue) states (20 μM in PBS).
Fig. 3
Fig. 3. FAAzos enable optical control of GPR40 in HeLa cells expressing GPR40, the diacylglycerol sensor C1-GFP and the genetically encoded [Ca2+]i sensor R-GECO. (a) Spontaneous oscillations of [Ca2+]i were observed before addition of any compound. (b) Gw-9508 (200 nM) caused an increase in [Ca2+]i that was not affected by 375 nm irradiation. HIS (10 nM) application caused an increase in [Ca2+]i (n = 179 cells from two experiments). (c, d) trans-FAAzo-10 (200 nM) increased [Ca2+]i, and isomerization to cis-FAAzo-10 with 375 nm light reversed this effect. Displayed as (c) individual [Ca2+]i traces from representative cells and (d) the average [Ca2+]i for many cells (n = 157 cells from two experiments). (e) In cells not expressing GPR40, FAAzo-10 (200 nM) did not affect [Ca2+]i. (f) At 200 nM, FAAzo-4 (n = 211 cells from two experiments) did not affect [Ca2+]i when compared to FAAzo-10 (n = 153 cells from two experiments). (g) C1-GFP translocated to the plasma membrane alongside an increase in [Ca2+]i when stimulated by trans-FAAzo-10 (20 μM, n = 10 cells from one representative experiment). Translocation (green) is displayed as the plasma membrane to cytoplasm (PM/CP) C1-GFP fluorescence intensity ratio. (h) Quantification of cell entry using fluorescence quenching of coumaryl-AA-loaded (100 nM) HeLa cells after application (100 nM, 2 experiments each) of FAAzo-4 (n = 29 cells, orange), FAAzo-10 (n = 23 cells, green) and PhoDAG-1 (n = 39 cells, grey), respectively. Error bars were calculated as ±s.e.m.
Fig. 4
Fig. 4. Spatial control of GPR40 signalling with FAAzo-10. (a) Confocal images of HeLa cells expressing GPR40 and R-GECO before and after treatment with FAAzo-10 (200 nM) and illumination with 375 nm light. The green rectangle indicates the area of illumination. After addition of FAAzo-10, all transfected cells showed increased [Ca2+]i. Following illumination, only cells within the green rectangle showed a sharp decrease in [Ca2+]i levels, which recovered after termination of illumination. Scale bar = 100 μm. (b) Normalized [Ca2+]i in illuminated cells (within the green rectangular in (a)) in blue (n = 52) and those in unilluminated cells (outside the green rectangular) in black (n = 82). Time points 1–4 correspond to the respective time frames in (a). Error bars were calculated as ±s.e.m.
Fig. 5
Fig. 5. Optical control of β-cell Kv channel activity. The whole-cell Kv channel current in dissociated wt mouse β-cells was measured using patch clamp electrophysiology. (a) An IV-plot showed that Gw-9508 (50 μM) (n = 8 cells from 2 animals) reduced the Kv conductance when compared to a vehicle control (n = 6 cells from 3 animals). (b) Under blue light, trans-FAAzo-10 (20 μM) reduced the whole-cell Kv current. Isomerization to cis-FAAzo-10 with UV-A light reversed this effect (n = 7 cells from 3 animals). (c) Similar to the wash-in and wash-out of Gw-9508, FAAzo-10 could be activated and inactivated over several cycles using irradiation. Shown are IV-steps from –70 to +80 mV from representative cells. (d, e) An action spectrum between 350–450 nm showed that Kv activity could be fine-tuned by changing the irradiation wavelength. Displayed as (d) overlaid sequential voltage ramps (–70 to +80 mV) from a representative cell and (e) the normalized current (to I350 nm) under each wavelength (n = 3 cells from 2 animals). Error bars were calculated as ±s.e.m.
Fig. 6
Fig. 6. Optical control of β-cell KATP channels. The whole-cell KATP current from dissociated mouse β-cells was measured between –110 to –50 mV. (a–c) After dialysis of the cytoplasm with the pipette solution, the KATP current developed to a steady state (black = before, n = 21; green = after, n = 20 cells from 2 animals). Application of Gw-9508 (20 μM, red, n = 9 cells from 2 animals) increased KATP conductance. In contrast, the application of trans-FAAzo-10 (20 μM, blue) decreased the KATP current, while isomerization to cis-FAAzo-10 (gray) reversed this effect (n = 7 cells from 2 animals). Data is displayed as (a, b) the full IV relationship between –110 to –50 mV and (c) the % KATP current (at –110 mV) for multiple cells, normalized to the KATP open (green) state. (d) In the presence of FAAzo-10, an action spectrum between 350–450 nm revealed that KATP was inhibited the most under blue irradiation. Irradiation with UV-A light prevented FAAzo-10 from blocking the KATP current. Displayed as the normalized current (to I350 nm) under each wavelength (n = 3 cells from one animal). (e) UV-A or blue irradiation alone did not affect the KATP current, and tolbutamide (40 μM) significantly reduced the magnitude of the KATP current (ΔI from –110 to –50 mV, n = 3 cells from one animal). ns = P > 0.05, *P < 0.05, **P < 0.01. Error bars were calculated as ±s.e.m.
Fig. 7
Fig. 7. FAAzo-10 enables optical control of [Ca2+]i oscillations in pancreatic islets. [Ca2+]i oscillations were stimulated by a high glucose concentration (11 mM, G11) and monitored in intact mouse islets using the fluorescent [Ca2+]i indicator Fluo-8. (a, b) The application of Gw-9508 (50 μM) caused an increase in the [Ca2+]i oscillation frequency. Displayed as (a) a representative trace from a single islet and (b) the oscillation frequency averaged over multiple islets (n = 6 recordings). (c, d) The application of trans-FAAzo-10 (20 μM) also caused a marked increase in the oscillation frequency. Isomerization to cis-FAAzo-10 with 365 nm irradiation reversed this effect. Results are displayed as (c) a representative trace from a single islet and (d) the average oscillation frequency from multiple islets (n = 5 recordings). (e, f) FAAzo-10 enabled optical control of β-cell [Ca2+]i oscillations at 20 μM, but not at 2.5 μM (n = 4–5 recordings) (representative images cropped to show a single islet; scale bar = 25 μm). (g) FAAzo-10 (20 μM) did not afford a consistent effect on GSIS (3 mM glucose, G3). Gw-9508 (20 μM) also did not affect GSIS (n = 3–8 assays using islets from at least 3 animals) (* denotes significance between G3 and G11). Grey lines are raw traces (to show frequency effects), black lines are smoothed traces (to show amplitude effects). *P < 0.05 and **P < 0.01, ANOVA, with repeated measures as necessary. Error bars were calculated as ±s.e.m.

Similar articles

Cited by

References

    1. Meves H. Br. J. Pharmacol. 2008;155:4–16. - PMC - PubMed
    1. Salem N., Litman B., Kim H., Gawrisch K. Lipids. 2001;36:945–959. - PubMed
    1. Milligan G., Shimpukade B., Ulven T., Hudson B. D. Chem. Rev. 2017;117(1):67–110. - PubMed
    1. Boland L. M., Drzewiecki M. M. Cell Biochem. Biophys. 2008;52:59–84. - PubMed
    1. IUPAC Gold Book – Fatty Acids, ed. A. D. McNaught and A. Wilkinson, Blackwell Scientific Publications, Oxford, 2nd edn, 1997.