. 2018 Mar 20:6:2.
doi: 10.1186/s40170-018-0176-5. eCollection 2018.

Elevated circulatory levels of leptin and resistin impair therapeutic efficacy of dacarbazine in melanoma under obese state

Affiliations

Elevated circulatory levels of leptin and resistin impair therapeutic efficacy of dacarbazine in melanoma under obese state

Parmanand Malvi et al. Cancer Metab. .

Abstract

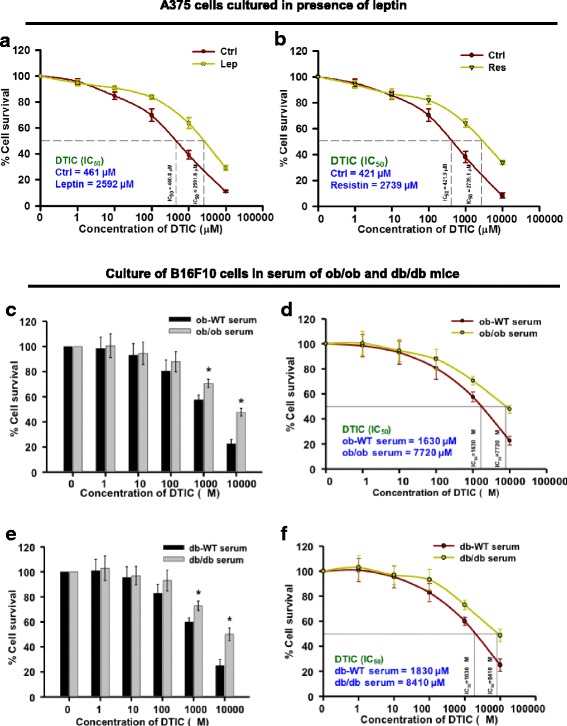
Background: Obesity is associated with increased risk, poor prognosis and outcome of therapy, in various cancers. Obesity-associated factors or adipokines, especially leptin and resistin, are purported to promote growth, survival, proliferation, and invasiveness of cancer cells. However, the mechanistic link between these adipokines and therapeutic response in malignancies is not clearly understood.

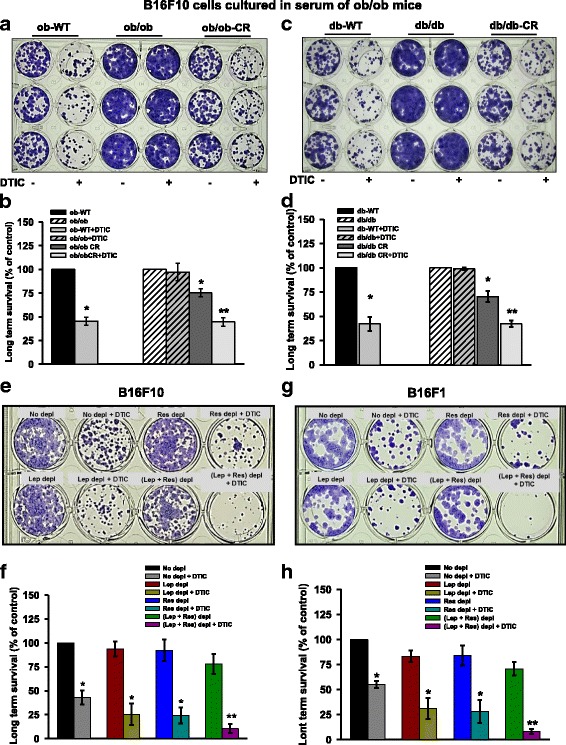
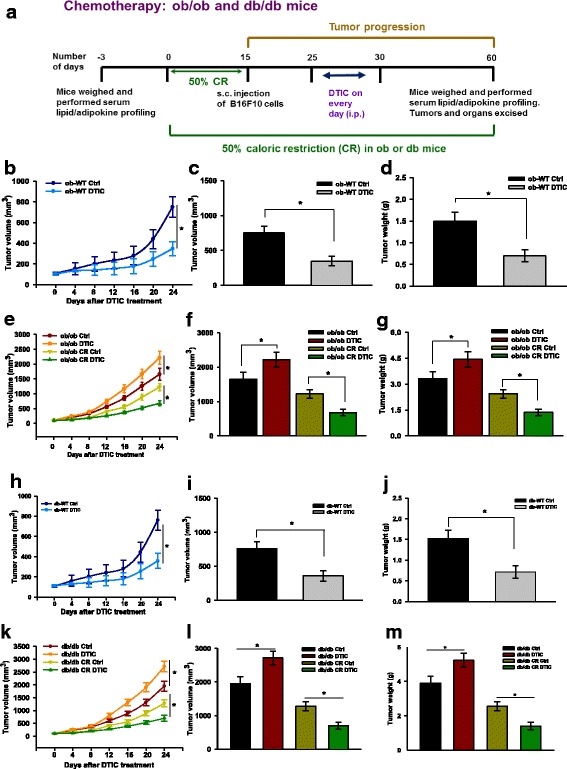
Methods: ob/ob and db/db mouse models were used in this study to evaluate the role of leptin and resistin towards the outcome of dacarbazine (DTIC) therapy in melanoma. Unique in vitro approaches were employed to complement in vivo findings by culturing melanoma cells in the serum collected from the experimental mice.

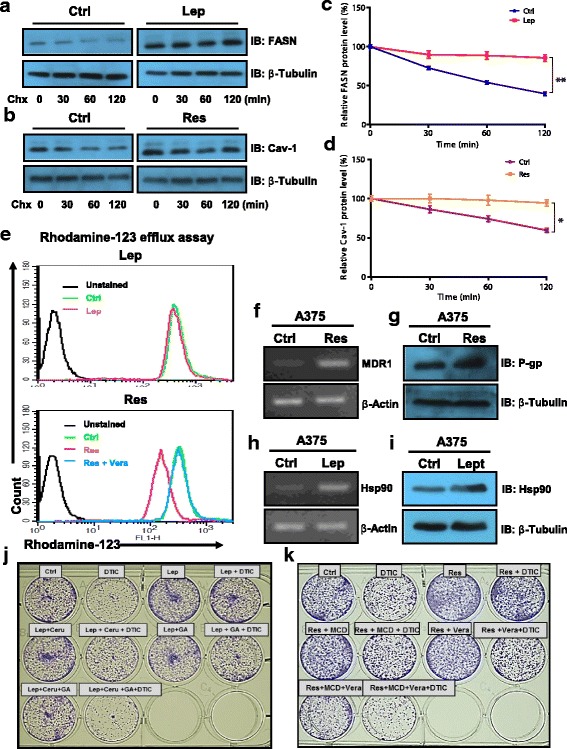
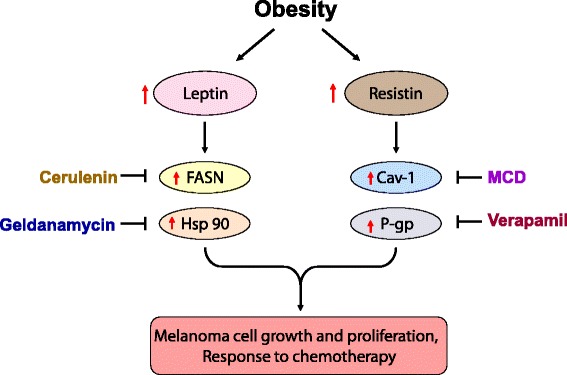
Results: Here, we have shown the role of important adipokines leptin and resistin in growth and the outcome of DTIC therapy in melanoma. Both leptin and resistin not only enhance proliferation of melanoma cells but also are involved in impairing the therapeutic efficacy of DTIC. Leptin and resistin treatment caused an increase in the protein levels of fatty acid synthase (FASN) and caveolin 1 (Cav-1) respectively, through their stabilization in A375 cells. Further, it was observed that leptin and resistin impaired the response of melanoma cells to DTIC via upregulation of heat shock protein 90 (Hsp90) and P-glycoprotein (P-gp) respectively.

Conclusion: These findings unraveled the involvement of adipokines (leptin and resistin) in melanoma progression, and more importantly, in the outcome of DTIC therapy.

Keywords: Chemotherapy; Leptin; Melanoma; Obesity; Resistin; Weight-control interventions.


Conflict of interest statement

All animal experiments were carried out as per the requirement and guidelines of the Committee for the Purpose of Control and Supervision of Experiments on Animals (CPCSEA), Government of India, and after obtaining the permission of the Institutional Animal Ethics Committee (IAEC).Not applicableThe authors declare that they have no competing interests.Springer Nature remains neutral with regard to jurisdictional claims in published maps and institutional affiliations.

Figures

Fig. 1
Fig. 1
Leptin and resistin impair the outcome of DTIC therapy in melanoma cells. a, b Effect of leptin (a) and resistin (b) on the outcome of DTIC in A375 cells. A375 (human melanoma) cells were plated in 96-well plates. After 24 h, cells were treated with 100 ng/ml of recombinant leptin or resistin in DMEM containing 1% FBS for 1 h. Then, cells were treated with DTIC at the indicated concentrations and incubated for 48 h. These cells were subjected to MTT assay, and IC50 of DTIC was calculated. cf Effect of ob/ob and db/db serum factors on the survival of B16F10 cells upon DTIC treatment. B16F10 cells were chronically grown in medium containing 5% serum collected from ob-WT or ob/ob mice for 15 days. These cells were then subjected to DTIC treatment at the indicated concentrations, for 48 h, and MTT assay was performed. c Survival of B16F10 cells in DMEM containing ob-WT or ob/ob serum. d Measurement of IC50 values of DTIC in DMEM containing ob-WT or ob/ob serum. e, f B16F10 cells were chronically grown in medium containing 5% serum collected from db-WT or db/db mice for 15 days. These cells were then subjected to DTIC treatment at the indicated concentrations, for 48 h, and MTT assay was performed. e Survival of B16F10 cells in DMEM containing db-WT or db/db serum. f Measurement of IC50 value of DTIC in DMEM containing db-WT or db/db serum. The data are representative of experiments performed three times in triplicate. The results are given as means ± standard error of the mean. All the experiments were performed three times. Statistical analysis was performed using two-tailed unpaired Student’s t test; *p < 0.05; Ctrl, control; Lep, leptin; Res, resistin
Fig. 2
Fig. 2
Effect of obesity-associated serum factors on the long-term survival of B16F10 and B16F1 cells treated with DTIC. a, b B16F10 cells were chronically grown in the medium containing 5% serum collected from experimental ob/ob mice for 15 days. Thereafter, these cells were subjected to DTIC treatment for 48 h. Then, the medium was changed and fresh medium was added. The medium was changed every 2–3 days. a Representative image showing the long-term survival of B16F10 cells. b Bar graph showing the quantitation of number of surviving population from the image shown in a. c, d Similar experiment was performed in B16F10 cells chronically grown in the serum from db/db mice. After 10 days, the cells were stained with 0.05% crystal violet, and images were taken using Olympus digital camera. eh B16F10 and B16F1 cells were cultured in serum (collected from C57BL/6J mice) which was immuno-depleted of leptin and or resistin for 48 h. Then, DTIC treatment was given, and cells were incubated for 48 h. Next, the medium was changed and fresh medium was added. e Representative image showing the long-term survival of B16F10 cells. f Bar graph showing the quantitation of number of surviving population from the image shown in e. g Representative image showing the long-term survival of B16F1 cells. h Bar graph showing the quantitation of number of surviving population from g. The data are representative of experiments performed two times at least in triplicates. The data were quantified using Image J software. The results are given as means ± standard error of the mean. Statistical analysis was performed using one-way ANOVA, followed by the Tukey multiple comparison test (for b and d), whereas two-tailed unpaired Student’s t test was used (for f and g). *p < 0.05, **p < 0.001; Ctrl, control; Lep, leptin; Res resistin
Fig. 3
Fig. 3
Molecular events associated with leptin and resistin induced impaired outcome of DTIC therapy in melanoma cells. a, b A375 cells were treated with leptin or resistin at a concentration of 100 ng/ml in DMEM containing 1% FBS for 48 h as described in the “Materials and methods” section. Thereafter, cycloheximide (100 μg/ml) treatment was given for the indicated time points. Representative immunoblot of FASN (a) and Cav-1 (b) in A375 cells treated with leptin or resistin respectively. c, d Bar graph showing the quantitation of band intensity of FASN and Cav-1 immunoblots. e Rhodamine-123 efflux assay in A375 cells treated with leptin (upper panel) or resistin (lower panel). A375 (human melanoma) cells were plated in 12-well plates. After 24 h, cells were treated with 100 ng/ml of recombinant leptin in DMEM containing 1% FBS for 48 h. Thereafter, these cells were subjected to Rh-123 efflux assay via flow cytometry. f, g RT-PCR (f) and immunoblotting (g) analysis of MDR and P-gp respectively in A375 cells treated with resistin. h, i RT-PCR (h) and immunoblotting (i) analysis of HSP90 in A375 cells treated with leptin. j, k Representative image showing the long-term survival of A375 cells grown in the presence or absence of leptin (j) or resistin (k) together with inhibitors. The results are given as means ± standard error of the mean. All the experiments were performed three times. Statistical analysis was performed using two-tailed unpaired Student’s t test for c and d. *p < 0.05, **p < 0.001; Ctrl, control; Lep, leptin; Res, resistin; Chx, cycloheximide; Ceru or C, cerulenin; GA or G, geldanamycin
Fig. 4
Fig. 4
Impact of leptin on melanoma progression and on the outcome of DTIC therapy in ob/ob and db/db mice. a Layout of the in vivo experiments. bd ob-WT mice were injected with B16F10 cells (2 × 105 cells/mouse in 100 μl PBS). After the tumor formation, vehicle or DTIC treatment (N = 6 per each group) was given as per the experimental layout shown in a. b Tumor progression, c tumor volume, and d tumor weight. eg ob/ob mice were divided into two major groups. One group was fed ad libitum on normal diet. In the second group, caloric intake was restricted to 50% by providing half the quantity of feed in normal before inoculating B16F10 cells. After 15 days, mice of all groups were injected subcutaneously with B16F10 cells (2 × 105 cells/mouse in 100 μl PBS). After tumor formation, vehicle or DTIC treatment (N = 6 per each group) was given as per the experimental layout shown in a. e Trend of tumor progression, f tumor volume, and g tumor weight. hj db-WT mice were injected with B16F10 cells (2 × 105 cells/mouse in 100 μl PBS). After tumor formation, vehicle or DTIC treatment (N = 6 per each group) was given as per the experimental layout shown in a. h Trend of tumor progression, i tumor volume, and j tumor weight. km db/db mice were divided into two major groups. One group was fed ad libitum on normal diet. In the second group, caloric intake was restricted to 50% by providing half the quantity of feed in normal before inoculating B16F10 cells. After 15 days, mice of all groups were injected subcutaneously with B16F10 cells (2 × 105 cells/mouse in 100 μl PBS). After tumor formation, vehicle or DTIC treatment (N = 6 per each group) was given as per the experimental layout shown in a. At the end of the experiment, mice were sacrificed and tumors were collected. k Trend of tumor progression, l tumor volume, and m tumor weight. The results are given as means ± standard error of the mean. Statistical analysis was performed using two-tailed unpaired Student’s t test (b, h), whereas one-way ANOVA, followed by the Tukey multiple comparison test was used for e and k. *p < 0.05, when compared to respective controls
Fig. 5
Fig. 5
Proposed model of study on impact of leptin on melanoma growth and the outcome of dacarbazine therapy. Leptin modulates FASN and Hsp90 levels while resistin modulates Cav-1 and P-gp, thereby enhancing melanoma growth. Collectively, these events are responsible in part for impaired outcome of DTIC therapy. Inhibition of these molecules restricts melanoma growth and improves the outcome of chemotherapy

References

    1. Tremblay A, Doucet E. Obesity: a disease or a biological adaptation? Obes Rev. 2000;1:27–35. doi: 10.1046/j.1467-789x.2000.00006.x. - DOI - PubMed
    1. Khandekar MJ, Cohen P, Spiegelman BM. Molecular mechanisms of cancer development in obesity. Nat Rev Cancer. 2011;11:886–895. doi: 10.1038/nrc3174. - DOI - PubMed
    1. Gregor MF, Hotamisligil GS. Inflammatory mechanisms in obesity. Annu Rev Immunol. 2011;29:415–445. doi: 10.1146/annurev-immunol-031210-101322. - DOI - PubMed
    1. Lumeng CN, Saltiel AR. Inflammatory links between obesity and metabolic disease. J Clin Invest. 2011;121:2111–2117. doi: 10.1172/JCI57132. - DOI - PMC - PubMed
    1. van Kruijsdijk RC, van der Wall E, Visseren FL. Obesity and cancer: the role of dysfunctional adipose tissue. Cancer Epidemiol Biomark Prev. 2009;18:2569–2578. doi: 10.1158/1055-9965.EPI-09-0372. - DOI - PubMed

LinkOut - more resources