

HIV epidemic drivers in South Africa: A model-based evaluation of factors accounting for inter-provincial differences in HIV prevalence and incidence trends
- PMID: 29568631
- PMCID: PMC5843035
- DOI: 10.4102/sajhivmed.v18i1.695
HIV epidemic drivers in South Africa: A model-based evaluation of factors accounting for inter-provincial differences in HIV prevalence and incidence trends
Abstract
Background: HIV prevalence differs substantially between South Africa's provinces, but the factors accounting for this difference are poorly understood.
Objectives: To estimate HIV prevalence and incidence trends by province, and to identify the epidemiological factors that account for most of the variation between provinces.
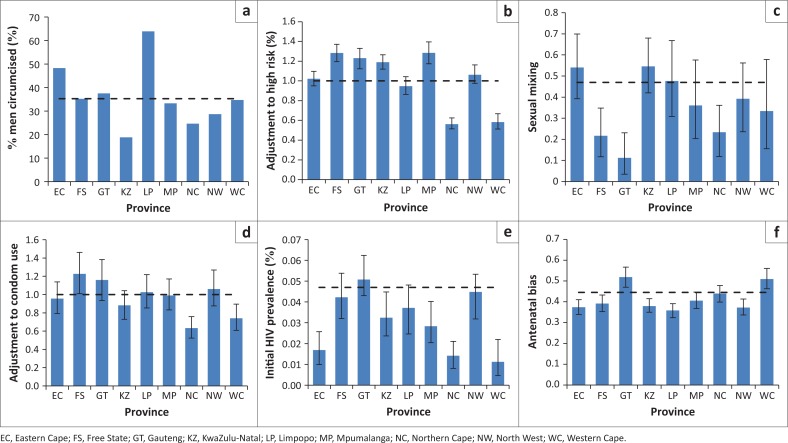
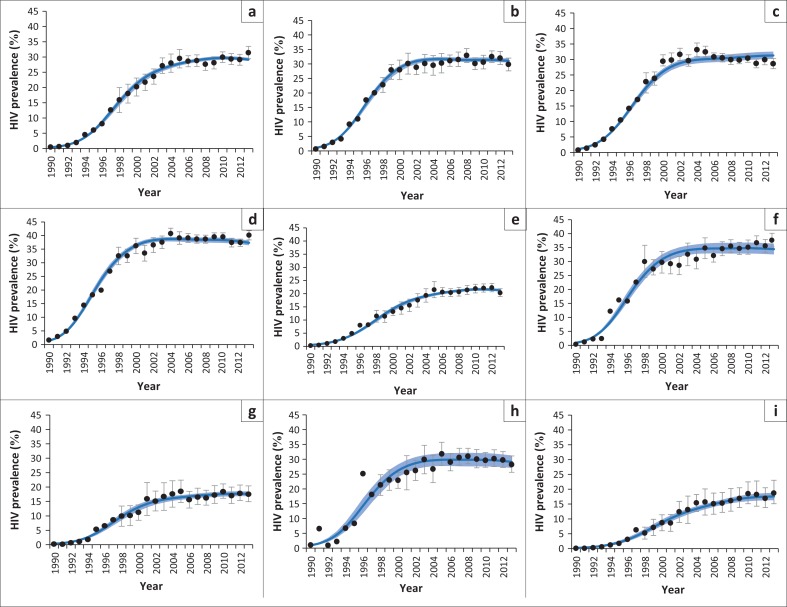
Methods: A mathematical model of the South African HIV epidemic was applied to each of the nine provinces, allowing for provincial differences in demography, sexual behaviour, male circumcision, interventions and epidemic timing. The model was calibrated to HIV prevalence data from antenatal and household surveys using a Bayesian approach. Parameters estimated for each province were substituted into the national model to assess sensitivity to provincial variations.
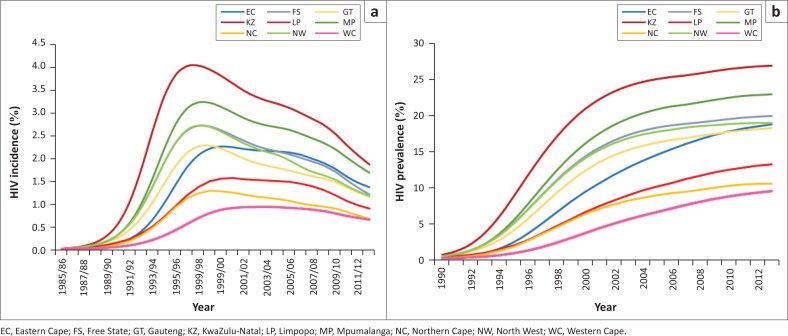
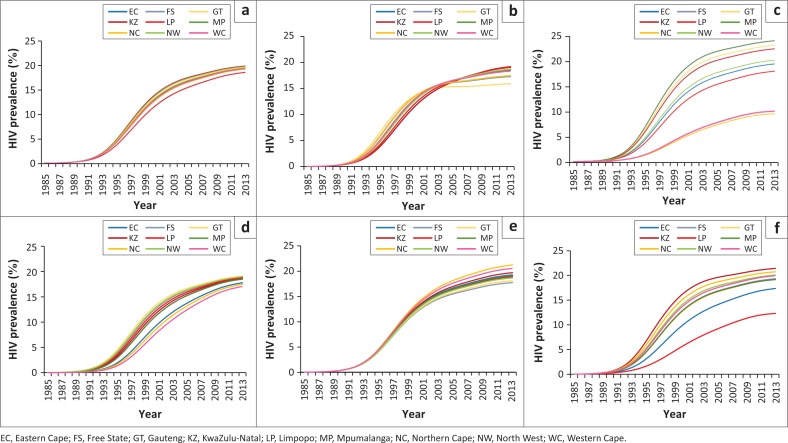
Results: HIV incidence in 15-49-year-olds peaked between 1997 and 2003 and has since declined steadily. By mid-2013, HIV prevalence in 15-49-year-olds varied between 9.4% (95% CI: 8.5%-10.2%) in Western Cape and 26.8% (95% CI: 25.8%-27.6%) in KwaZulu-Natal. When standardising parameters across provinces, this prevalence was sensitive to provincial differences in the prevalence of male circumcision (range 12.3%-21.4%) and the level of non-marital sexual activity (range 9.5%-24.1%), but not to provincial differences in condom use (range 17.7%-21.2%), sexual mixing (range 15.9%-19.2%), marriage (range 18.2%-19.4%) or assumed HIV prevalence in 1985 (range 17.0%-19.1%).
Conclusion: The provinces of South Africa differ in the timing and magnitude of their HIV epidemics. Most of the heterogeneity in HIV prevalence between South Africa's provinces is attributable to differences in the prevalence of male circumcision and the frequency of non-marital sexual activity.
Conflict of interest statement
The authors declare that they have no financial or personal relationships that may have inappropriately influenced them in writing this article.
Figures
References
-
- Shisana O, Rehle T, Simbayi LC, et al. South African National HIV prevalence, incidence, and behaviour survey, 2012 [homepage on the Internet]. Cape Town: Human Sciences Research Council; 2014. [cited 2014 Apr 16]. Available from: http://www.hsrc.ac.za/en/research-outputs/view/6871
-
- Anderson SJ, Cherutich P, Kilonzo N, et al. Maximising the effect of combination HIV prevention through prioritisation of the people and places in greatest need: A modelling study. Lancet. 2014;384(9939):249–256. https://doi.org/10.1016/S0140-6736(14)61053-9 - DOI - PubMed
-
- Gerberry DJ, Wagner BG, Garcia-Lerma JG, Heneine W, Blower S. Using geospatial modelling to optimize the rollout of antiretroviral-based pre-exposure HIV interventions in sub-Saharan Africa. Nat Commun. 2014;5:5454 https://doi.org/10.1038/ncomms6454 - DOI - PMC - PubMed
-
- Verguet S. Efficient and equitable HIV prevention: A case study of male circumcision in South Africa. Cost Eff Resour Alloc. 2013;11(1):1 https://doi.org/10.1186/1478-7547-11-1 - DOI - PMC - PubMed
-
- Bor J, Brennan A, Fox M, et al. District prevalence of unsuppressed HIV in South African women: Monitoring programme performance and progress towards 90-90-90 [Abstract TUAC0205]. 21st International AIDS Conference; 2016 Jul 18–22; Durban, South Africa.
LinkOut - more resources
Full Text Sources
Other Literature Sources