

Both activated and less-activated regions identified by functional MRI reconfigure to support task executions
- PMID: 29568689
- PMCID: PMC5853621
- DOI: 10.1002/brb3.893
Both activated and less-activated regions identified by functional MRI reconfigure to support task executions
Abstract
Introduction: Functional magnetic resonance imaging (fMRI) has become very important for noninvasively characterizing BOLD signal fluctuations, which reflect the changes in neuronal firings in the brain. Unlike the activation detection strategy utilized with fMRI, which only emphasizes the synchronicity between the functional nodes (activated regions) and the task design, brain connectivity and network theory are able to decipher the interactive structure across the entire brain. However, little is known about whether and how the activated/less-activated interactions are associated with the functional changes that occur when the brain changes from the resting state to a task state. What are the key networks that play important roles in the brain state changes?
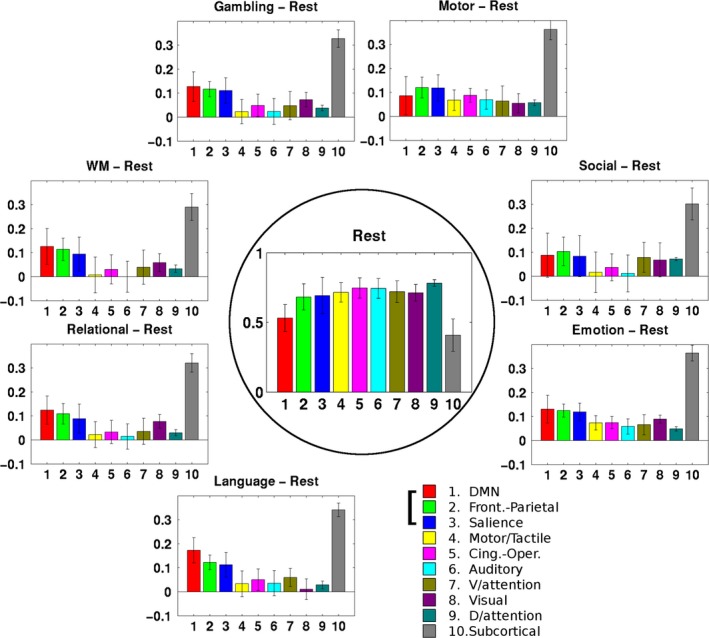
Methods: We used the fMRI data from the Human Connectome Project S500 release to examine the changes of network efficiency, interaction strength, and fractional modularity contributions of both the local and global networks, when the subjects change from the resting state to seven different task states.
Results: We found that, from the resting state to each of seven task states, both the activated and less-activated regions had significantly changed to be in line with, and comparably contributed to, a global network reconfiguration. We also found that three networks, the default mode network, frontoparietal network, and salience network, dominated the flexible reconfiguration of the brain.
Conclusions: This study shows quantitatively that contributions from both activated and less-activated regions enable the global functional network to respond when the brain switches from the resting state to a task state and suggests the necessity of considering large-scale networks (rather than only activated regions) when investigating brain functions in imaging cognitive neuroscience.
Keywords: activation; brain network; functional connectivity; functional magnetic resonance imaging; network reconfiguration.
Figures


Similar articles
-
Reconfiguration of Brain Network Architectures between Resting-State and Complexity-Dependent Cognitive Reasoning.J Neurosci. 2017 Aug 30;37(35):8399-8411. doi: 10.1523/JNEUROSCI.0485-17.2017. Epub 2017 Jul 31. J Neurosci. 2017. PMID: 28760864 Free PMC article.
-
Mapping cognitive and emotional networks in neurosurgical patients using resting-state functional magnetic resonance imaging.Neurosurg Focus. 2020 Feb 1;48(2):E9. doi: 10.3171/2019.11.FOCUS19773. Neurosurg Focus. 2020. PMID: 32006946 Free PMC article. Review.
-
Correspondence between evoked and intrinsic functional brain network configurations.Hum Brain Mapp. 2017 Apr;38(4):1992-2007. doi: 10.1002/hbm.23500. Epub 2017 Jan 4. Hum Brain Mapp. 2017. PMID: 28052450 Free PMC article.
-
Comparison of whole-brain task-modulated functional connectivity methods for fMRI task connectomics.Commun Biol. 2024 Oct 26;7(1):1402. doi: 10.1038/s42003-024-07088-3. Commun Biol. 2024. PMID: 39462101 Free PMC article.
-
Graph theory approach for the structural-functional brain connectome of depression.Prog Neuropsychopharmacol Biol Psychiatry. 2021 Dec 20;111:110401. doi: 10.1016/j.pnpbp.2021.110401. Epub 2021 Jul 12. Prog Neuropsychopharmacol Biol Psychiatry. 2021. PMID: 34265367 Review.
Cited by
-
Scan Once, Analyse Many: Using Large Open-Access Neuroimaging Datasets to Understand the Brain.Neuroinformatics. 2022 Jan;20(1):109-137. doi: 10.1007/s12021-021-09519-6. Epub 2021 May 11. Neuroinformatics. 2022. PMID: 33974213 Free PMC article.
-
Large-scale intrinsic connectivity is consistent across varying task demands.PLoS One. 2019 Apr 10;14(4):e0213861. doi: 10.1371/journal.pone.0213861. eCollection 2019. PLoS One. 2019. PMID: 30970031 Free PMC article.
-
Brain Network Modularity During a Sustained Working-Memory Task.Front Physiol. 2020 May 8;11:422. doi: 10.3389/fphys.2020.00422. eCollection 2020. Front Physiol. 2020. PMID: 32457647 Free PMC article.
-
Task-related brain functional network reconfigurations relate to motor recovery in chronic subcortical stroke.Sci Rep. 2021 Apr 19;11(1):8442. doi: 10.1038/s41598-021-87789-5. Sci Rep. 2021. PMID: 33875691 Free PMC article.
-
Activation-based association profiles differentiate network roles across cognitive loads.Hum Brain Mapp. 2019 Jun 15;40(9):2800-2812. doi: 10.1002/hbm.24561. Epub 2019 Mar 10. Hum Brain Mapp. 2019. PMID: 30854745 Free PMC article.
References
-
- Achard, S. , & Bullmore, E. (2007). Efficiency and cost of economical brain functional networks. PLoS computational biology, 3, e17 https://doi.org/10.1371/journal.pcbi.0030017 - DOI - PMC - PubMed
-
- Barch, D. M. , Burgess, G. C. , Harms, M. P. , Petersen, S. E. , Schlaggar, B. L. , Corbetta, M. , … Consortium, W. U.‐M. H. (2013). Function in the human connectome: Task‐fMRI and individual differences in behavior. NeuroImage, 80, 169–89. https://doi.org/10.1016/j.neuroimage.2013.05.033 - DOI - PMC - PubMed
-
- Bassett, D. S. , Porter, M. A. , Wymbs, N. F. , Grafton, S. T. , Carlson, J. M. , & Mucha, P. J. (2013). Robust detection of dynamic community structure in networks. Chaos, 23, 013142 https://doi.org/10.1063/1.4790830 - DOI - PMC - PubMed
-
- Bassett, D. S. , Yang, M. , Wymbs, N. F. , & Grafton, S. T. (2015). Learning‐induced autonomy of sensorimotor systems. Nature Neuroscience, 18, 744–751. https://doi.org/10.1038/nn.3993 - DOI - PMC - PubMed
-
- Beckmann, C. F. , Jenkinson, M. , & Smith, S. M. (2003). General multilevel linear modeling for group analysis in FMRI. NeuroImage, 20, 1052–1063. https://doi.org/10.1016/S1053-8119(03)00435-X - DOI - PubMed
Publication types
MeSH terms
Grants and funding
LinkOut - more resources
Full Text Sources
Other Literature Sources
Medical
