Review
. 2018 Apr 23;47(8):2873-2920.
doi: 10.1039/C7CS00612H.

Ratiometric optical nanoprobes enable accurate molecular detection and imaging

Affiliations
Review

Ratiometric optical nanoprobes enable accurate molecular detection and imaging

Xiaolin Huang et al. Chem Soc Rev. .

Abstract

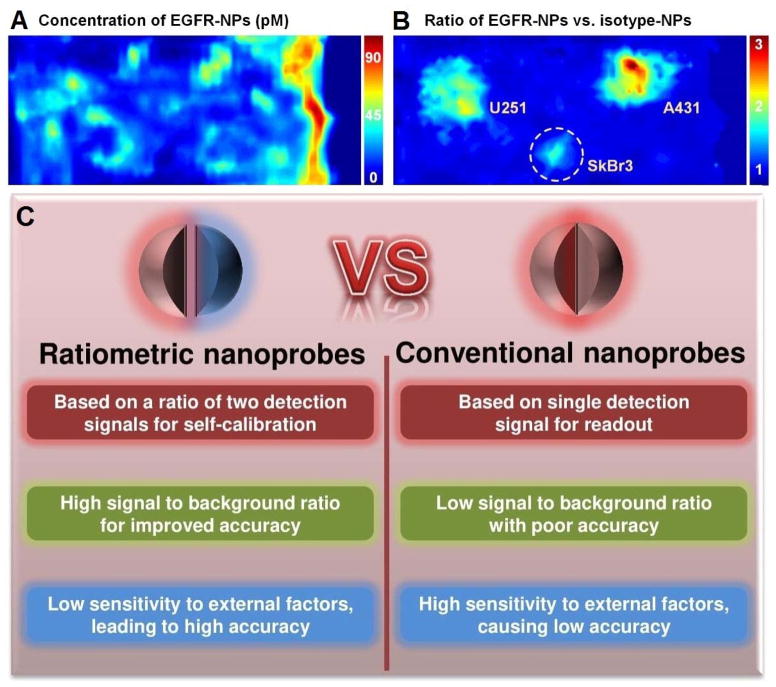
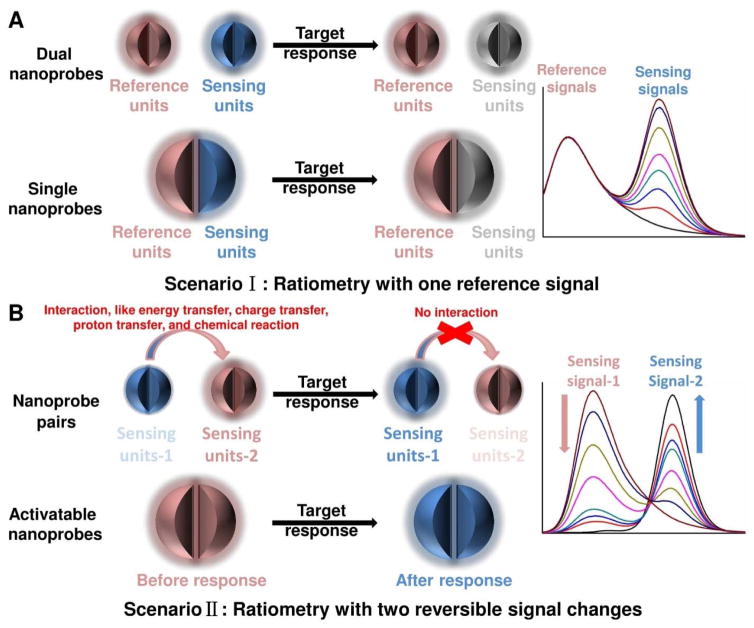
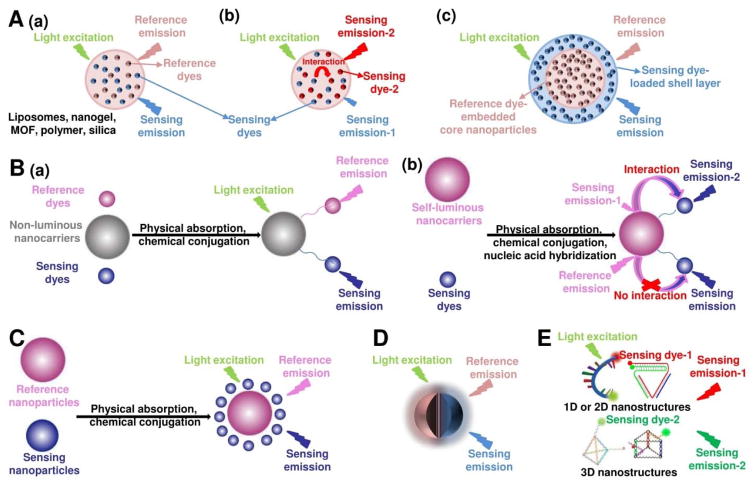
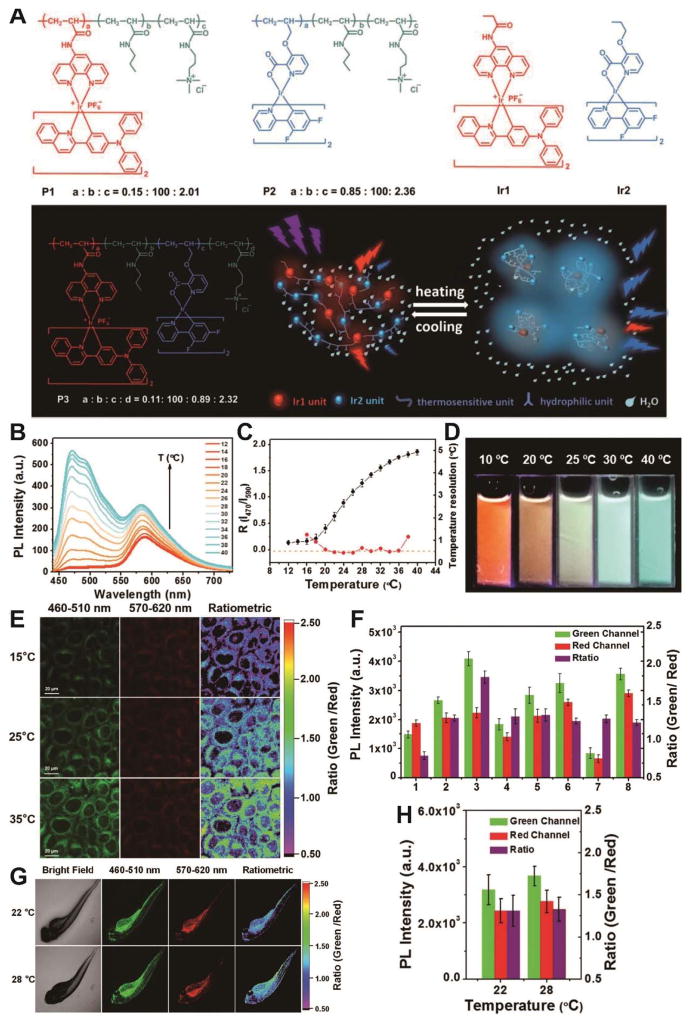
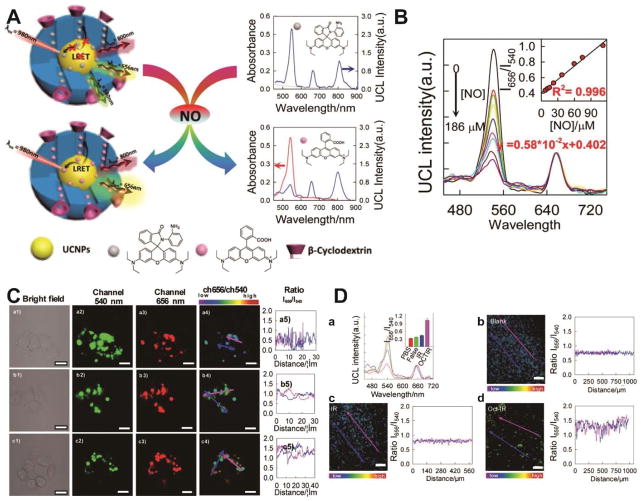
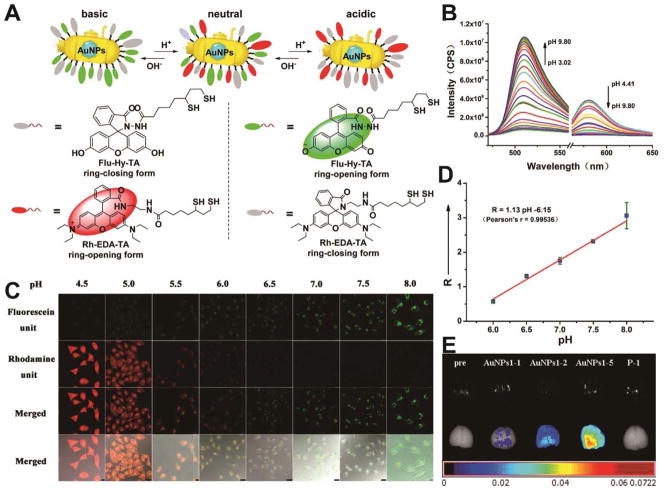
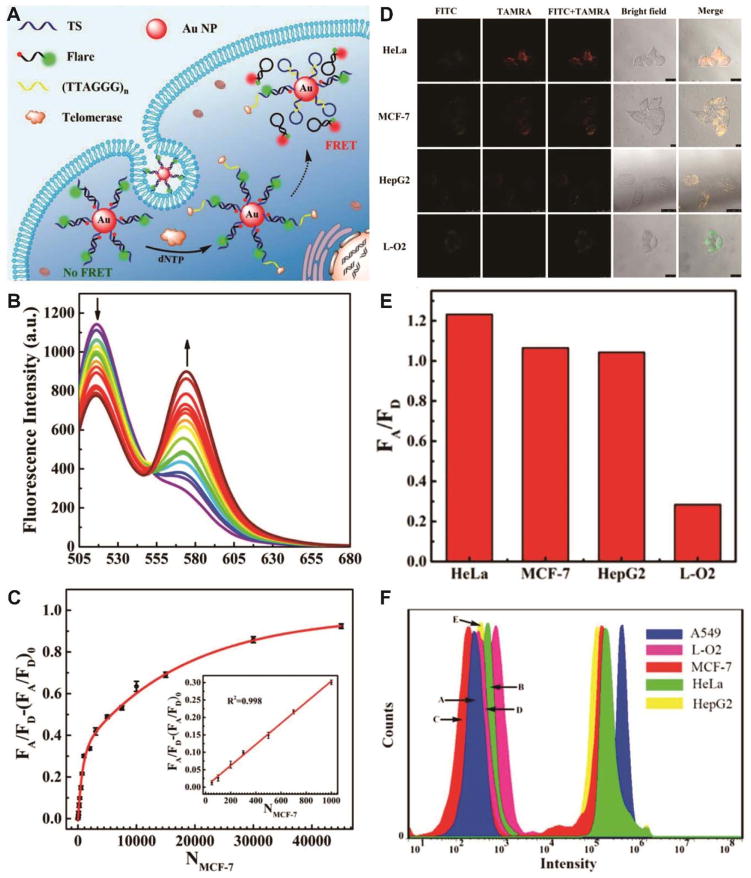
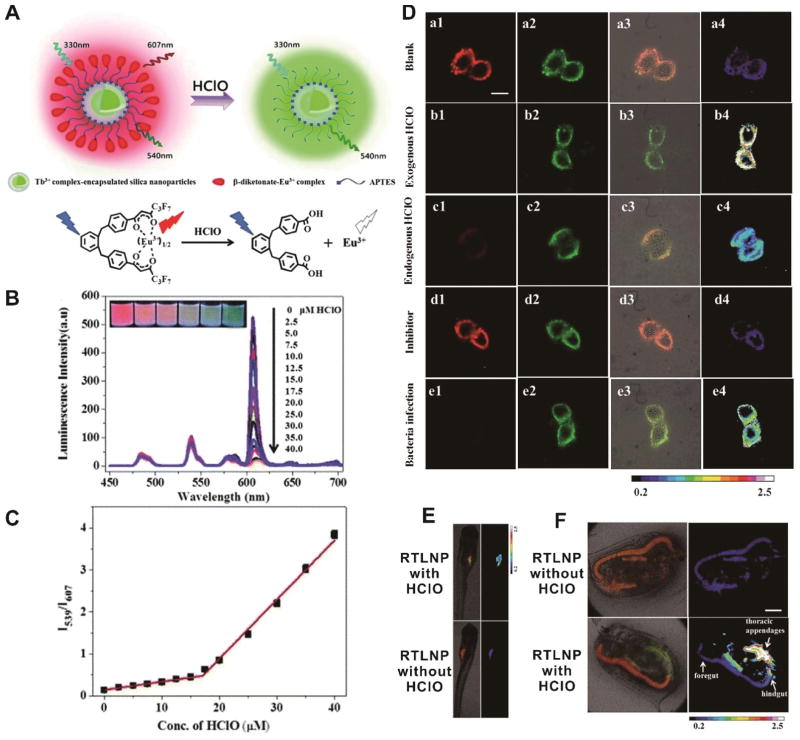
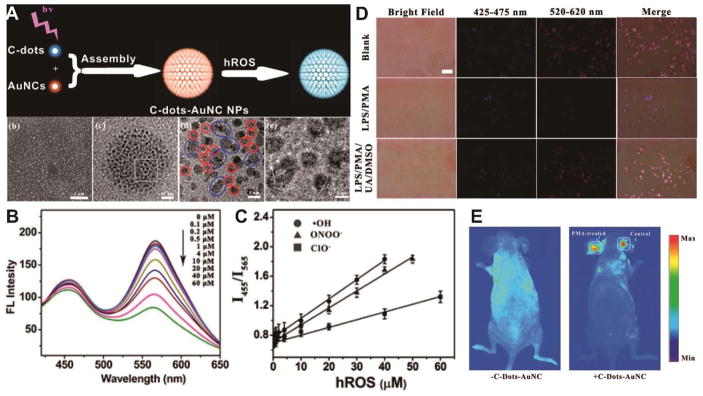
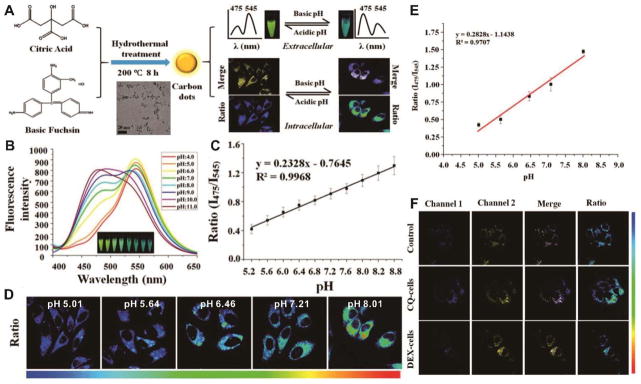
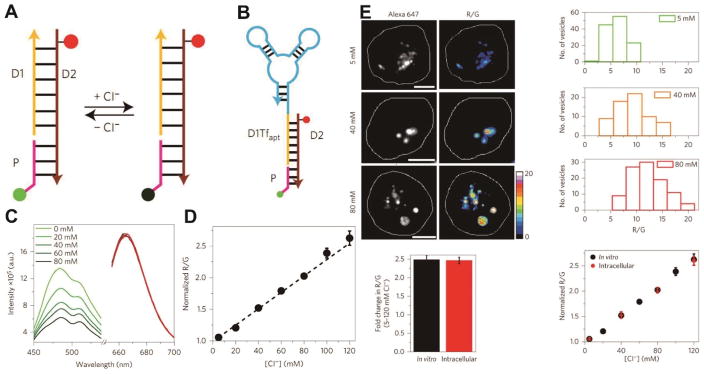
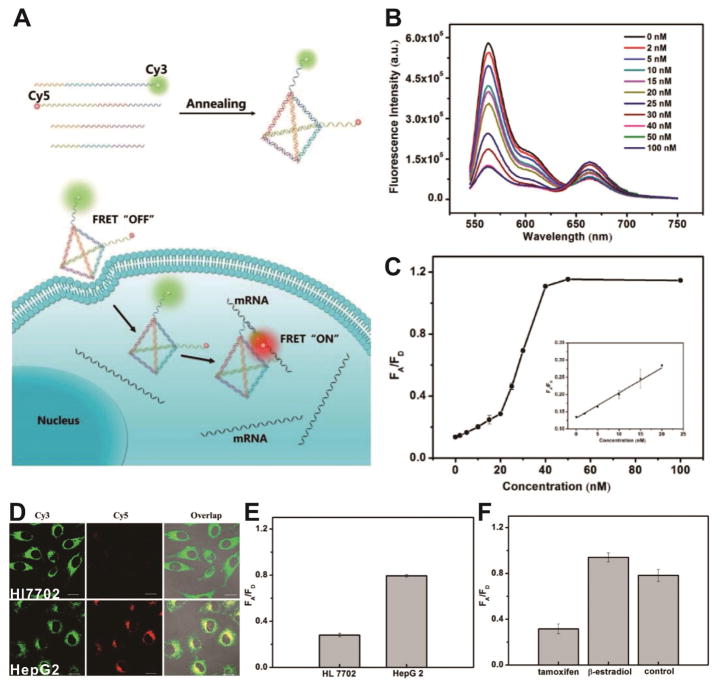
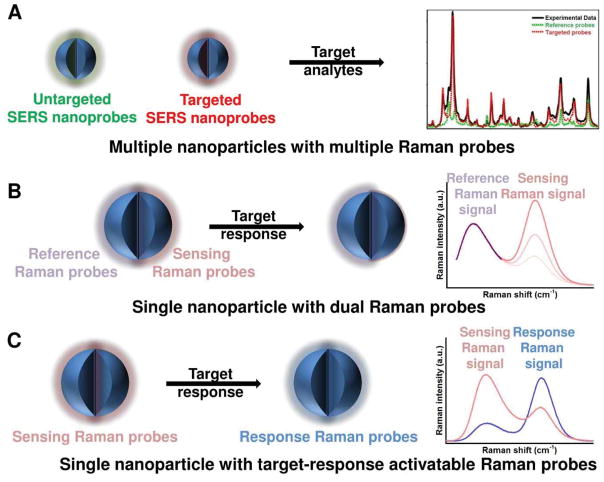
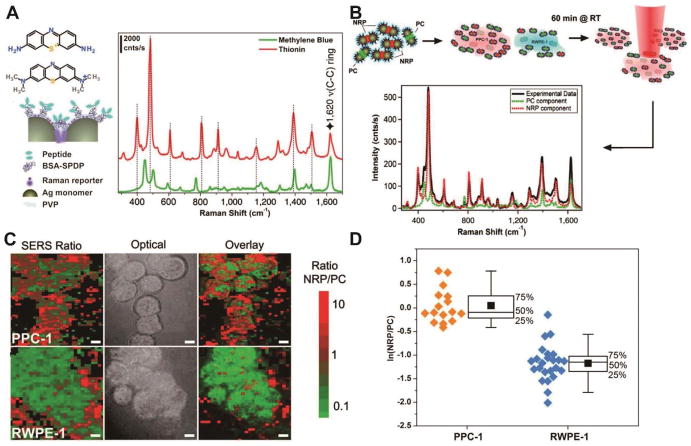
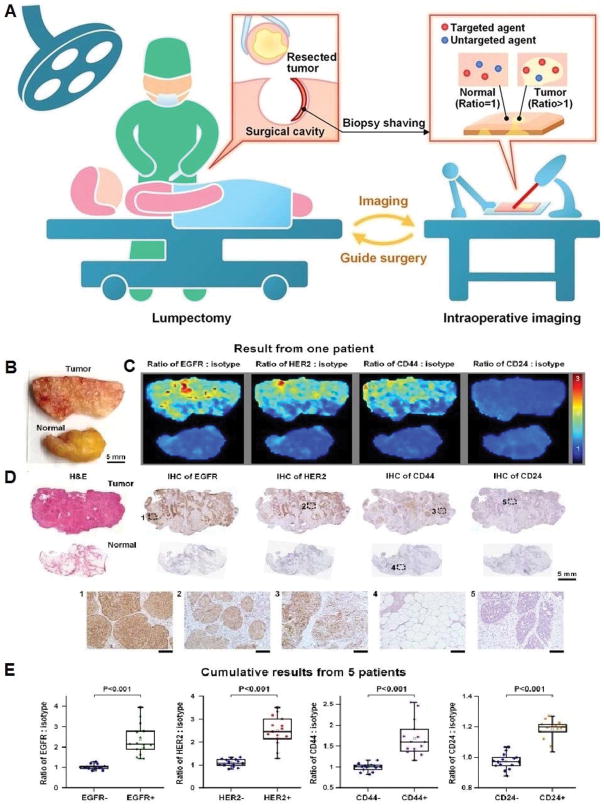
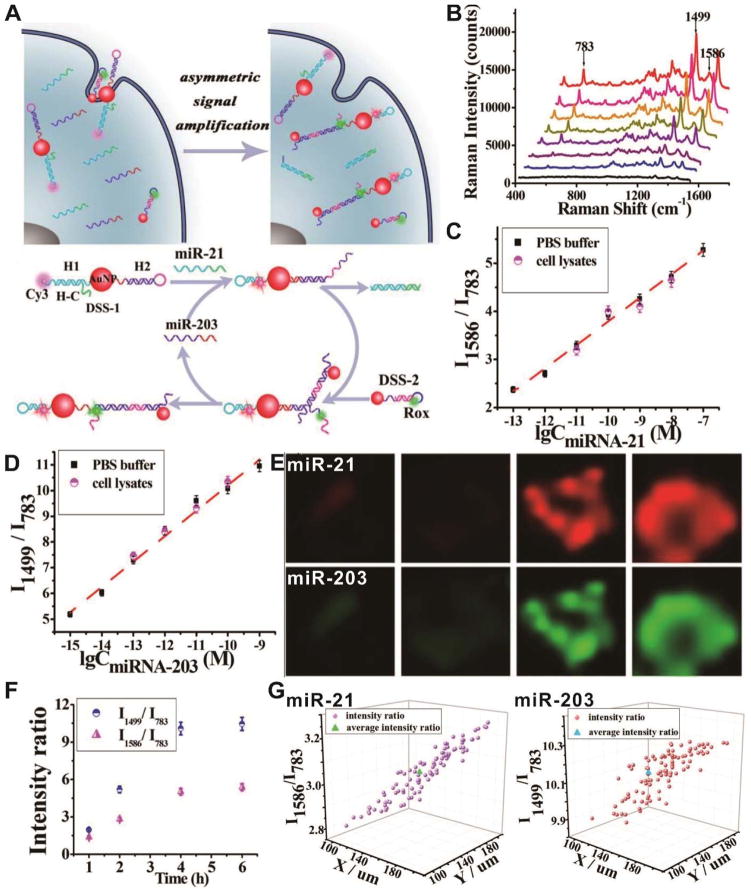
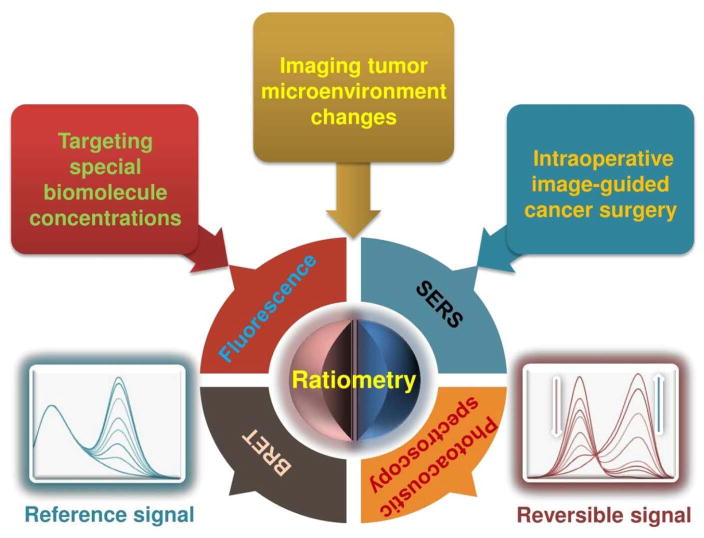
Exploring and understanding biological and pathological changes are of great significance for early diagnosis and therapy of diseases. Optical sensing and imaging approaches have experienced major progress in this field. Particularly, an emergence of various functional optical nanoprobes has provided enhanced sensitivity, specificity, targeting ability, as well as multiplexing and multimodal capabilities due to improvements in their intrinsic physicochemical and optical properties. However, one of the biggest challenges of conventional optical nanoprobes is their absolute intensity-dependent signal readout, which causes inaccurate sensing and imaging results due to the presence of various analyte-independent factors that can cause fluctuations in their absolute signal intensity. Ratiometric measurements provide built-in self-calibration for signal correction, enabling more sensitive and reliable detection. Optimizing nanoprobe designs with ratiometric strategies can surmount many of the limitations encountered by traditional optical nanoprobes. This review first elaborates upon existing optical nanoprobes that exploit ratiometric measurements for improved sensing and imaging, including fluorescence, surface enhanced Raman scattering (SERS), and photoacoustic nanoprobes. Next, a thorough discussion is provided on design strategies for these nanoprobes, and their potential biomedical applications for targeting specific biomolecule populations (e.g. cancer biomarkers and small molecules with physiological relevance), for imaging the tumor microenvironment (e.g. pH, reactive oxygen species, hypoxia, enzyme and metal ions), as well as for intraoperative image guidance of tumor-resection procedures.


Figures

Fig. 1
Fig. 1
Ex vivo imaging of the modified rat esophagus. (A) An image showing the measured concentration of EGFR nanoprobes (EGFR-NPs in pM), which is ambiguous due to uneven delivery and nonspecific retention. (B) A ratiometric image for mitigating these confounding effects by imaging the concentration ratio of EGFR-NPs versus isotype nanoprobes (isotype-NPs). Reproduced with permission from ref. . Copyright 2015 Optical Society of America. (C) Comparison of convention optical nanoprobes and ratiometric optical nanoprobes.
Fig. 2
Fig. 2
General principles for designing ratiometric optical nanoprobes. (A) Ratiometry with one reference signal. (B) Ratiometry with two reversible signal changes.
Fig. 3
Fig. 3
Design strategies for ratiometric fluorescence nanoprobes. (A) Two-dye-embedded nanoparticles: nanoparticles with dyes randomly distributed in the interior without or with interaction (a and b), and nanoparticles with dyes located within the core and shell (c). (B) Nanoparticle-dye nanoconjugates with dyes attached to the surface: non-luminous nanocarriers with two dyes (a), and self-luminous nanocarriers with one dye (b). (C) Hybrid nanoparticles. (D) Single nanoparticles with intrinsic dual emission. (E) Dual-emission DNA nanostructures.
Fig. 4
Fig. 4
(A) Schematic diagram and chemical structures of polymers and iridium(III) complexes. (B) Emission spectra of P3 in phosphate buffered saline (PBS) at various temperatures. (C) Temperature-dependent ratio of phosphorescence intensity at 470 and 590 nm (black, left axis) and temperature resolution (red, right axis). (D) Photographs of P3 in aqueous solution at different temperatures. (E) Confocal laser scanning microscopy images of HeLa cells labeled with P3 at 15 °C (top), 25 °C (middle), and 35 °C (bottom). (F) Luminescence intensity of HeLa cells recorded from the green channel (green) and the red channel (red) and the intensity ratio green/red (purple). (G) Bright images and confocal laser scanning microscopy images of living zebrafish larva after injection of P3 at 22 °C (top) and 28 °C (bottom). Ratiometric luminescence images were from the green channel to red channel. (H) Luminescence intensity of zebrafish recorded from the green channel (green) and the red channel (red) and the intensity ratio (green/red) (purple) at 22 or 28 °C. Reproduced with permission from ref. . Copyright 2016, WILEY-VCH Verlag GmbH & Co. KGaA, Weinheim.
Fig. 5
Fig. 5
(A) Schematic illustration showing a dual-emission nanoprobe that can sense changes in the environmental pH, based on the concept of pH-responsive FRET of a biocompatible polyelectrolyte, NPCS, conjugated with a donor (Cy3) or an acceptor (Cy5) moiety. (B) FRET spectra, and (C) Dual-emission pH images of Cy3-/Cy5-NPCS-15% nanoparticle suspensions. (D) Mapping spatial pH changes in living cells. Dual-emission fluorescence images (scale bar, 20 μm) of cells treated with Cy3-/Cy5-NPCS NPs for distinct durations taken by a confocal laser scanning microscope at 543 nm. The corresponding pseudocolored ratio images were obtained by analyzing the ratio of the signal intensities of Cy5 to Cy3 imaging channels. Reproduced with permission from ref. . Copyright 2010, American Chemical Society.
Fig. 6
Fig. 6
(A) Schematic illustration of the cross-linked triple-labeled polyacrylamide nanoparticle. (B) In vitro calibration of the triple-labeled sensor with both OG and FS, and two dual-labeled sensors with either OG or FS. (C) Uptake of the triple-labeled sensor by a HepG2 cell after 24 h incubation and washing and imaged with confocal microscopy. Reproduced with permission from ref. . Copyright 2011, American Chemical Society.
Fig. 7
Fig. 7
(A) Schematic illustration of organelle-differentiated multilocal and multicolor fluorescence imaging of endogenous HClO in macrophage cells using the organic nanoprobe cocktails composed of lysosome-targeted nanoprobe (LNP) and mitochondria-targeted nanoprobe (MNP). (B) Normalized fluorescence spectra of the cocktail nanoprobe solution with different HClO concentrations under the excitation of 405 nm (left) and 570 nm (right) light, respectively. (C and D) The logarithmic value of ratiometric fluorescence signals (ln(I472/I535)) and (ln(I610/I690)) as a function of HClO concentration. (E) Multilocal and multicolor imaging of HClO in murine macrophage cells (RAW 264.7): (a) without any treatment, (b) with LPS/IFN-γ, (c) with LPS/IFN-γ and NAC. (F) Quantification of the ratiometric fluorescence signals of the blue (orange) channel to that of the green (red) channel (IBlue/IGreen) or (IOrange/IRed) and their logarithmic values from macrophage cells with different treatments of E. Reproduced with permission from ref. . Copyright 2017, WILEY-VCH Verlag GmbH & Co. KGaA, Weinheim.
Fig. 8
Fig. 8
(A) Design concept of core-shell typed ratiometric nanoprobes. (B) Schematic diagram of the preparation of iridium(III) silane analogue from complex 1, and recognition mechanism of complex 2 toward HClO. (C) Phosphorescence spectral traces of SiO2-1@mSiO2-2 in PBS at different HClO concentrations. (D) Plots of I598nm/I500nm as a function of HClO concentration. (E) Luminescence images of RAW264.7 cells treated with SiO2-1@mSiO2-2 (top), followed by incubation with NaClO (middle), and RAW 264.7 cells stimulated with LPS and PMA, and incubated with SiO2-1@mSiO2-2 (bottom). (F) Luminescence intensity of RAW264.7 cells recorded from the blue window (blue) and the red window (red) and the intensity ratio of Ired/Iblue (green). Reproduced with permission from ref. . Copyright 2015, The Royal Society of Chemistry.
Fig. 9
Fig. 9
(A) Schematic illustration of the sensing principle of upconversion nanoprobes for ratiometric luminescent measurement of nitric oxide. (B) In vitro response of this nanoprobe to different concentrations of nitric oxide. (C) Confocal microscopy luminescence images of HeLa cells after treatment with UCNP@RdMMSN@βCD and different concentrations of nitric oxide: (a) 0, (b) 0.2 mM, and (c) 0.4 mM, respectively. (D) UCL spectra and luminescence intensity ratios (inset) of the nanoprobes in serum (a), and luminescence ratiometric images at a depth of 300 μm of rat liver tissue slices incubated with the nanoprobes, and the corresponding intensity profile of a linear region across the liver tissue slices. Reproduced with permission from ref. . Copyright 2017, American Chemical Society.
Fig. 10
Fig. 10
(A) Structures of Rh-EDA-TA and Flu-Hy-TA at different pH. (B) Fluorescence emission spectral changes of “gold nano-submarines” at different pH values. (C) Confocal microscopy images of HeLa cells clamped at pH 4.5, 5.0, 5.5, 6.0, 6.5, 7.0, 7.5, and 8.0, respectively. (D) Intracellular pH calibration curve of “gold nano-submarines” in HeLa cells. (E) Examination of the intact BBB penetration of “gold nano-submarines” in mice. Reproduced with permission from ref. . Copyright 2016, American Chemical Society.
Fig. 11
Fig. 11
(A) Schematic illustration of the FRET nanoprobe for ratiometric imaging of intracellular telomerase. (B) Fluorescence emission spectra of the designed probe in response to telomerase from different numbers of MCF-7 cells. (C) The relationship between the fluorescence ratio of acceptor to donor (FA/FD) and the number of cells. (D) Confocal images of HeLa, MCF-7, HepG2, and L-O2 cells after incubation with the FRET nanoprobe. (E) Fluorescence ratio values of different cell lines. (F) Flow cytometric analysis of various cell lines after incubation with or without the FRET nanoprobe. Reproduced with permission from ref. . Copyright 2017, American Chemical Society.
Fig. 12
Fig. 12
(A) Design concept of a ratiometric luminescence probe based on crown-like dual-emissive silica nanoparticles modified by Tb3+ and Eu3+ complexes, and the luminescence quenching mechanism. (B) Time-gated emission spectra of the RTLNP in the presence of different concentrations of HClO. (C) The I539/I607 ratio response of the RTLNP to different concentrations of HClO. (D) Time-gated luminescence images of the RAW 264.7 cells with different treatments: (a) RTLNP without HClO, (b) RTLNP with HClO, (c) with LPS/IFN-γ/PMA and RTLNP, (d) with LPS/IFN-γ/PMA/4-ABAH and RTLNP, and (e) with Escherichia coli and RTLNP, respectively. (E and F) Time-gated luminescence images of RTLNP-loaded 5-day-old zebrafish (E) and Daphnia magna (F) with or without the treatment of HClO, respectively. Reproduced with permission from ref. . Copyright 2017, The Royal Society of Chemistry.
Fig. 13
Fig. 13
(A) Schematic illustration for FRET-based ratiometric sensing of mitochondrial H2O2 in living cells by the nanoprobe. (B) Fluorescence spectra of the Mito-CD-PF1 nanoprobe in the presence of different amounts of H2O2. (C) Fluorescence intensity ratio of Mito-CD-PF1 as a function of H2O2 concentration in HEPES buffer. (D) Confocal fluorescence images of Mito-CD-PF1-stained L929 cells upon addition of 0 (control), 50 μM, and 200 μM H2O2 in the culture media. (D) Ratiometric fluorescence images of Mito-CD-PF1-stained Raw 264.7 cells with the PMA treatment at concentrations of 0, 1, and 2 μg mL−1. Reproduced with permission from ref. . Copyright 2013, Wiley-VCH Verlag GmbH & Co. KGaA, Weinheim.
Fig. 14
Fig. 14
(A) Schematic illustration for experimental design and proposed mechanism for the UCL detection of H2S. (B) UCL spectra of CHC1-UCNPs in HEPES buffer upon gradual addition of H2S at different concentrations, and plots of the UCL emission ratio intensity of UCL541/UCL800 as a function of H2S concentration (the inset). (C) Ratiometric UCL images of Hela cells with or without the treatment of cysteine. (D) Ratiometric UCL images of endogenous H2S levels in live mouse tissues, and the average ratiometric UCL intensities of tissues. Reproduced with permission from ref. . Copyright 2014, Wiley-VCH Verlag GmbH & Co. KGaA, Weinheim.
Fig. 15
Fig. 15
(A) Schematic illustration of the synthesis of UCNPs-hCy7 and its sensing of MeHg+ with a change in UCL emission. (B) UCL spectra of hCy7-UCNPs in the aqueous solution with different concentrations of MeHg+. (C) The ratio of UCL660nm/800nm as a function of MeHg+ concentration. (D) Ratiometric UCL images in living HeLa cells (top, a–d) and MeHg+-pretreated Hela Cells (bottom, e–h) incubated with hCy7-UCNPs, with ratiometric UCL images from the ratio of red to green channels. (E) In vivo UCL images of hCy7-UCNPs-pretreated living mice injected intravenously with normal saline (left mouse) or MeHg+ solution (right mouse) (top, a), and the corresponding UCL images of the livers (bottom, b). Reproduced with permission from ref. . Copyright 2013, American Chemical Society.
Fig. 16
Fig. 16
(A) Schematic illustration of the DEFN synthesis, and its sensing ability for hROS detection. (B) Fluorescence spectral responses of the DEFN to hROS of varying concentrations. (C) Working curves of the DEFN-based ratiometric sensor in response to hROS, including •OH (triangle), ONOO (circle), and ClO (dot). (D) Confocal fluorescence microscopy images of HL-60 cells with different treatments of (a) no stimulation, (b) H2O2, and (c) H2O2 and ABAH, after incubating with DEFN, respectively. Reproduced with permission from ref. . Copyright 2013, American Chemical Society.
Fig. 17
Fig. 17
(A) Schematic illustration of the construction of Cdots-AuNC and the working principle of the detection of hROS, and the corresponding SEM and TEM images of Cdots-AuNC (a–d). (B) Fluorescence spectra of Cdots-AuNC in the presence of hROS at various concentrations. (C) Ratiometric fluorescence as a function of the hROS concentration. (D) Bright field and fluorescence images of live murine macrophages (RAW 264.7) under different treatments of only Cdots-AuNC (top), LPS/PMA/Cdots-AuNC (middle), and LPS/PMA/UA/DMSO/Cdots-AuNC, respectively. (E) In vivo imaging of hROS using Cdots-AuNC in an acute local inflammation in the ear by topical application of PMA. The left ears of the mice were treated with PMA, while the right ears were set as control. Reproduced with permission from ref. . Copyright 2013, American Chemical Society.
Fig. 18
Fig. 18
(A) Schematic diagram for the preparation of label-free Cdots and their application for intracellular pH sensing. (B) Fluorescence spectrum of Cdots in PBS with different pH values ranging from 4.0 to 11.0. (C) Linear relationship of the ratiometric fluorescence intensity (I475 nm/I545 nm) versus pH values. (D) Ratiometric calibration of pH in living cells. (E) Calibration curve from D. Reproduced with permission from ref. . Copyright 2016, American Chemical Society.
Fig. 19
Fig. 19
(A) Structure and working principle of Clensor. P, sensing module (pink line) containing a Cl-sensitive fluorophore, BAC (green filled circle); D2, normalizing module (brown line) containing a Cl-insensitive fluorophore, Alexa 647 (red filled circle); D1, targeting module (orange line). In the presence of Cl, BAC undergoes collisional quenching, whereas the fluorescence of Alexa 647 is Cl-independent. (B) Modified sensor design for targeting to the recycling pathway (ClensorTf). D1Tfapt, targeting module modified with an RNA aptamer (Tfapt) against the human transferrin receptor (cyan line). (C) Fluorescence emission spectra of Clensor at different concentrations of Cl. (D) In vitro Cl calibration profile of Clensor showing normalized Alexa 647 and BAC fluorescence intensity ratio (R/G) versus chloride concentrations. (E) Quantitative performance of Clensor within subcellular organelles. Reproduced with permission from ref. . Copyright 2015, Macmillan Publishers Limited. All rights reserved.
Fig. 20
Fig. 20
(A) Schematic illustration of synthesis and mechanism of the DTNT nanoprobe for tumor-related mRNA detection in living cells. (B) Fluorescence response in the presence of different concentrations of synthetic DNA targets, ranging from 0 to 100 nM. (C) The relationship between the fluorescence emission ratio of acceptor to donor (FA/FD) and target concentration. (D) Fluorescence image of TK1 mRNA in HepG2 and HL7702 cells by DTNT nanoprobe. (E) Histogram of the relative fluorescence intensity (A/D) of the above two cell lines from D. (F) Histogram of the relative fluorescence intensity (A/D) of the following three groups, including tamoxifen-treated group, the β-estradiol-treated group, and control group. Reproduced with permission from ref. . Copyright 2017 American Chemical Society.
Fig. 21
Fig. 21
Design strategies for ratiometric SERS nanoprobes. (A) Multiple nanoparticles with multiple Raman probes. (B) Single nanoparticles with dual Raman probes. (C) Single nanoparticles with target-response activatable Raman probes.
Fig. 22
Fig. 22
(A) Structural description of SBT system and spectra. (B) Schematic of the SERS cell mapping experiment. NRP- and PC-SBTs are synthesized, combined, and added to either noncancerous or cancer cells suspended in DMEM supplemented with 10% FBS. (C) Two-dimensional mappings for cancer (PPC-1) and normal cells (RWPE-1). (D) Box plots of the NRP/PC ratio for both PPC-1 and RWPE-1 populations after application of the logarithmic transformation to render both distributions normal. Reproduced with permission from ref. . Copyright 2011, National Academy of Sciences.
Fig. 23
Fig. 23
(A) Schematic of a REMI-based intraoperative imaging guidance of lumpectomy to rapidly identify residual tumors at the margins of freshly resected tissues for guiding breast-conserving surgeries. A ratiometric strategy (right inset) quantifies biomarker expression by comparing the signal from targeted NPs and nontargeted NPs. Reproduced with permission from ref. . Copyright 2016, Nature Publishing Group. (B) Photograph of a human breast tumor and a normal tissue specimen from one patient. (C) Ratiometric images of EGFR-NPs versus isotype-NPs, HER2-NPs versus isotype-NPs, CD44-NPs versus isotype-NPs and CD24-NPs versus isotype-NPs. (D) Validation data: H&E and IHC for EGFR, HER2, CD44, and CD24. Unlabeled scale bars represent 200 μm. (E) Cumulative results from multiple regions of interest from a total of 5 patient specimens: measured NP ratios on IHC-validated biomarker-negative and biomarker-positive tissue regions. Each data point in the plots is the average ratio from one region of interest. Reproduced with permission from ref. . Copyright 2016 Wiley-VCH Verlag GmbH & Co. KGaA, Weinheim.
Fig. 24
Fig. 24
(A) Schematic illustration of detection of microRNA-21 (miR-21) and microRNA-203 (miR-203) in living cells using the developed nanoprobes, and mechanism for sensing the asymmetric signal amplification of the nanoprobes for miR-21 and miR-203. (B) SERS spectra for increasing concentrations of miR-21 and miR-203. (C and D) Variances of the I1586/I783 and I1499/I783 with the concentration of miR-21 and miR-203, respectively. (E) SERS images for miR-21 and miR-203. (F) Average SERS intensity ratios for one peak in a single MCF-7 cell incubated with the proposed probes for 1, 2, 4, and 6 h. (G) Comparison of the SERS intensity ratios in each living cell versus the average intensity ratio from 100 cells, miR-21 (left) and miR-203 (right), respectively. Reproduced with permission from ref. . Copyright 2017 American Chemical Society.
Fig. 25
Fig. 25
(A) SERS nanosensors for monitoring endogenous H2S in living cells. (B) SERS spectra of AuNPs/4-AA in PBS in the presence of NaHS at various concentrations. (C) Plots of ratiometric peak intensities versus logarithmic NaHS concentration based on I709/I1161 and I1626/I1161. (D) SERS monitoring of endogenous H2S in living cells (rat C6 glioma cells) under SAM stimulation: bright-field images (a), DFM images (b), SERS monitoring of rat-mediated H2S with AuNPs/4-AA nanosensors under SAM stimulation with different times of 0, 10, 30, 60, 90, and 120 min (c), and the corresponding ratiometric peak intensities from c of I709/I1161 and I1626/I1161 versus time of SAM stimulation (d). Reproduced with permission from ref. . Copyright 2015, Wiley-VCH Verlag GmbH & Co. KGaA, Weinheim.
Fig. 26
Fig. 26
Design strategies for ratiometric photoacoustic nanoprobes. (A) Nanoparticle-dye nanocomplex with dual photoacoustic absorption. (B) Target-response activatable photoacoustic absorption switch.
Fig. 27
Fig. 27
(A) Schematic illustration for nanoprobe design of PET-amplified PA imaging of pH, doping-induced PA amplification, and pH-sensing mechanism. (B) UV-vis absorption spectra of SON50 at different pH. (C) PA images of the SON50 solution at pH = 7.4, 6.4, or 5.5. A pulsed laser was tuned to 680 or 750 nm for ratiometric imaging. (D) PA spectra of SON50 at different pH. (E) Quantification of the ratiometric PA signals (PA680/PA750) of SON50 at different pH. The blue line represents linear fitting from pH = 7.4 to 5.5 (R2 = 0.991). (F and G) PA images and ratiometric signals (ΔPA680/ΔPA750) of muscle and tumor with local administration of SON50. Reproduced with permission from ref. . Copyright 2016, Wiley-VCH Verlag GmbH & Co. KGaA, Weinheim.
Fig. 28
Fig. 28
(A) Schematic illustration of the proposed strategy for ratiometric photoacoustic imaging of MeHg+. (B) Absorbance response of LP-hCy7 as a function of MeHg+ concentration in an aqueous solution. (C) Plot of PA860/PA690 of LP-hCy7 against the concentration of MeHg+ ions. (D) 3D ultrasonic (US) image of zebrafish for illustration of photoacoustic imaging in transection of abdomen (a). (b) merged US and PA images of untreated zebrafish (b1-b3), LP-hCy7 incubated zebrafish (b4-b6), and MeHg+/LP-hCy7 treated zebrafish (b7-b9) at 690 (left) and 860 nm (right), respectively. (E) Corresponding quantified PA intensity at 690 nm (blue) and 860 nm (red) for D-b. (F) Ratios of PA860/PA690 obtained from D-b. Reproduced with permission from ref. . Copyright 2017, Wiley-VCH Verlag GmbH & Co. KGaA, Weinheim.
Fig. 29
Fig. 29
(A) Structure of bacteriopheophorbide-lipid with axes showing the Qy and Qx transition dipoles for the chromophore. (B) Schematic of the J-aggregating nanoparticle (JNP) prepared with 15% Bchl-lipid, 80% host phospholipid, and 5% mPEG2000-DPPE. Insets: (left) Representative transmission electron micrograph of JNP prepared with dipalmitoylphosphatidylcholine (DPPC) (JNP16) and (right) color photographs of JNP16 sample below and above phase transition temperature. (C) Absorption spectra of JNP16 in the intact (blue) and detergent disrupted (red) state. (D) Representative near-infrared absorption spectrum of JNP prepared with dipalmitoylphosphotidylcholine (JNP16) upon heating from 25 to 50 °C. Reproduced with permission from ref. . Copyright 2014 American Chemical Society.
Fig. 30
Fig. 30
(A) Schematic illustration of the proposed BTeam biosensor. (B) ATP-dependent luminescence spectral changes of purified BTeam. (C) ATP-dependent BRET ratio changes of purified BTeam. (D) Standard curve for calculation of ATP concentration based on the BRET ratio values (mean ± SD) of purified BTeam. (E) Comparison of intracellular ATP concentrations determined by BTeam (closed bar) and firefly luciferase (open bar). (F) Luminescence images of NLuc (left) and YFP (middle), and BRET ratio (right, pseudocolored) of HeLa cells stably expressing cyt-BTeam (upper) or transiently expressing mit-BTeam (bottom). (G) Comparison of BRET ratio values between cytosol and mitochondria at the single HeLa cell level. Reproduced with permission from ref. . Copyright 2016, Nature Publishing Group.
Scheme 1
Scheme 1
Schematic representation of ratiometric optical nanoprobes for molecular sensing and imaging in vitro and in vivo.

References

    1. Chen M, He X, Wang K, He D, Yang X, Shi H. TrAC, Trends Anal Chem. 2014;58:120–129.
    1. Schulz A, McDonagh C. Soft Matter. 2012;8:2579–2585.
    1. Ueno T, Nagano T. Nat Methods. 2011;8:642–645. - PubMed
    1. Stich MI, Fischer LH, Wolfbeis OS. Chem Soc Rev. 2010;39:3102–3114. - PubMed
    1. Lanza GM, Winter PM, Caruthers SD, Morawski AM, Schmieder AH, Crowder KC, Wickline SA. J Nucl Cardiol. 2004;11:733–743. - PubMed