

Cytochrome P450 3A Induction Predicts P-glycoprotein Induction; Part 1: Establishing Induction Relationships Using Ascending Dose Rifampin
- PMID: 29569723
- PMCID: PMC6282691
- DOI: 10.1002/cpt.1073
Cytochrome P450 3A Induction Predicts P-glycoprotein Induction; Part 1: Establishing Induction Relationships Using Ascending Dose Rifampin
Abstract
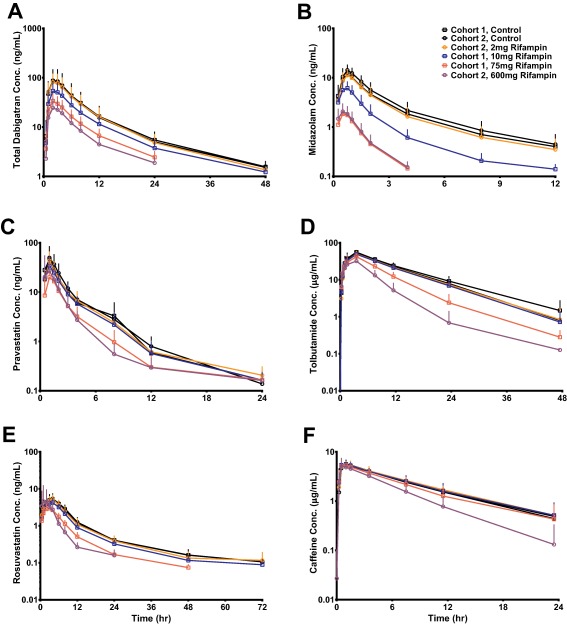
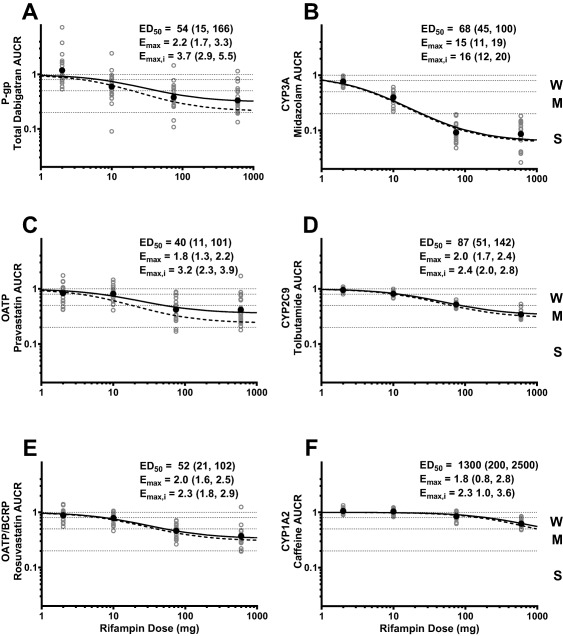
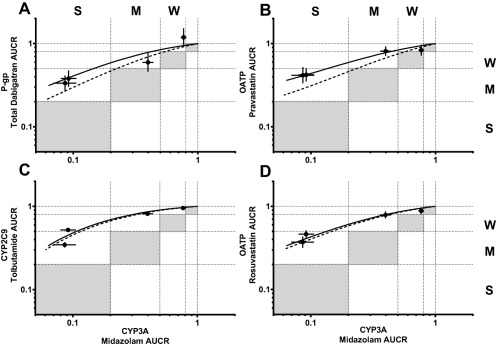
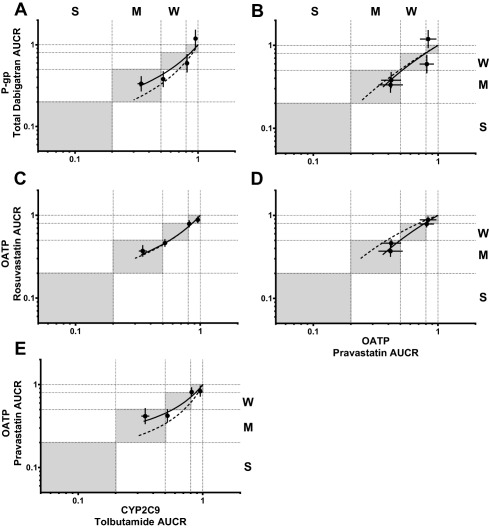
Drug transporter and cytochrome P450 expression is regulated by shared nuclear receptors and, hence, an inducer should induce both, although the magnitude may differ. The objective of this study was to establish relative induction relationships between CYP3A and drug transporters (P-glycoprotein (P-gp), organic anion transporting polypeptide (OATP), and breast cancer resistance protein (BCRP)) or other P450s (CYP2C9 and CYP1A2) using ascending doses of the prototypical pregnane xenobiotic receptor (PXR) agonist, rifampin, to elicit weak, moderate, and strong PXR agonism. Healthy subjects received dabigatran etexilate, pravastatin, rosuvastatin, and a midazolam/tolbutamide/caffeine cocktail before and after rifampin 2, 10, 75, or 600 mg q.d. Unlike CYP3A, only moderate induction of P-gp, OATP, and CYP2C9 was observed and dose-dependent induction of P-gp, OATP, and CYP2C9 was always one drug-drug interaction category lower than observed for CYP3A, even when correcting for probe drug sensitivity. Data from this study establish proof-of-concept that P450 induction data can be leveraged to inform on the effect on transporters.
© 2018 The Authors. Clinical Pharmacology & Therapeutics published by Wiley Periodicals, Inc. on behalf of American Society for Clinical Pharmacology and Therapeutics.
Figures
Similar articles
-
Cytochrome P450 3A Induction Predicts P-glycoprotein Induction; Part 2: Prediction of Decreased Substrate Exposure After Rifabutin or Carbamazepine.Clin Pharmacol Ther. 2018 Dec;104(6):1191-1198. doi: 10.1002/cpt.1072. Epub 2018 Apr 26. Clin Pharmacol Ther. 2018. PMID: 29569712 Free PMC article. Clinical Trial.
-
Evaluation of the Potential for Cytochrome P450 and Transporter-Mediated Drug-Drug Interactions for Cilofexor, a Selective Nonsteroidal Farnesoid X Receptor (FXR) Agonist.Clin Pharmacokinet. 2023 Apr;62(4):609-621. doi: 10.1007/s40262-023-01214-w. Epub 2023 Mar 11. Clin Pharmacokinet. 2023. PMID: 36906733 Free PMC article.
-
Drug-Drug Interaction Potential of Darolutamide: In Vitro and Clinical Studies.Eur J Drug Metab Pharmacokinet. 2019 Dec;44(6):747-759. doi: 10.1007/s13318-019-00577-5. Eur J Drug Metab Pharmacokinet. 2019. PMID: 31571146 Free PMC article. Clinical Trial.
-
Effect of P-glycoprotein (P-gp) Inducers on Exposure of P-gp Substrates: Review of Clinical Drug-Drug Interaction Studies.Clin Pharmacokinet. 2020 Jun;59(6):699-714. doi: 10.1007/s40262-020-00867-1. Clin Pharmacokinet. 2020. PMID: 32052379 Free PMC article. Review.
-
Pregnane X receptor: molecular basis for species differences in CYP3A induction by xenobiotics.Chem Biol Interact. 2001 May 16;134(3):283-9. doi: 10.1016/s0009-2797(01)00163-6. Chem Biol Interact. 2001. PMID: 11336976 Review.
Cited by
-
Cytochrome P450 3A Induction Predicts P-glycoprotein Induction; Part 2: Prediction of Decreased Substrate Exposure After Rifabutin or Carbamazepine.Clin Pharmacol Ther. 2018 Dec;104(6):1191-1198. doi: 10.1002/cpt.1072. Epub 2018 Apr 26. Clin Pharmacol Ther. 2018. PMID: 29569712 Free PMC article. Clinical Trial.
-
Drug-Drug Interaction Study to Assess the Effect of Cytochrome P450 Inhibition and Induction on the Pharmacokinetics of the Novel Cereblon Modulator Avadomide (CC-122) in Healthy Adult Subjects.J Clin Pharmacol. 2019 Dec;59(12):1620-1631. doi: 10.1002/jcph.1453. Epub 2019 Jun 6. J Clin Pharmacol. 2019. PMID: 31172535 Free PMC article.
-
Unraveling pleiotropic effects of rifampicin by using physiologically based pharmacokinetic modeling: Assessing the induction magnitude of P-glycoprotein-cytochrome P450 3A4 dual substrates.CPT Pharmacometrics Syst Pharmacol. 2021 Dec;10(12):1485-1496. doi: 10.1002/psp4.12717. Epub 2021 Nov 2. CPT Pharmacometrics Syst Pharmacol. 2021. PMID: 34729944 Free PMC article.
-
Rifampicin Induces Gene, Protein, and Activity of P-Glycoprotein (ABCB1) in Human Precision-Cut Intestinal Slices.Front Pharmacol. 2021 Jun 9;12:684156. doi: 10.3389/fphar.2021.684156. eCollection 2021. Front Pharmacol. 2021. PMID: 34177592 Free PMC article.
-
In vitro and clinical investigations to determine the drug-drug interaction potential of entrectinib, a small molecule inhibitor of neurotrophic tyrosine receptor kinase (NTRK).Invest New Drugs. 2022 Feb;40(1):68-80. doi: 10.1007/s10637-021-01156-9. Epub 2021 Aug 21. Invest New Drugs. 2022. PMID: 34417912 Free PMC article.
References
-
- Christians, U. , Schmitz, V. & Haschke, M. Functional interactions between P‐glycoprotein and CYP3A in drug metabolism. Expert Opin. Drug Metab. Toxicol. 1, 641–654 (2005). - PubMed
-
- Francis, G.A. , Fayard, E. , Picard, F. & Auwerx, J. Nuclear receptors and the control of metabolism. Annu. Rev. Physiol. 65, 261–311 (2003). - PubMed
-
- Gerbal‐Chaloin, S. et al Induction of CYP2C genes in human hepatocytes in primary culture. Drug Metab. Dispos. 29, 242–251 (2001). - PubMed
-
- Lemmen, J. , Tozakidis, I.E. & Galla, H.J. Pregnane X receptor upregulates ABC‐transporter Abcg2 and Abcb1 at the blood‐brain barrier. Brain Res. 1491, 1–13 (2013). - PubMed
-
- Synold, T.W. , Dussault, L. & Forman, B.M. The orphan nuclear receptor SXR coordinately regulates drug metabolism and efflux. Nat. Med. 7, 584–590 (2001). - PubMed
Publication types
MeSH terms
Substances
LinkOut - more resources
Full Text Sources
Other Literature Sources
Miscellaneous
