. 2018 Jan 22;62(1):2847.
doi: 10.4081/ejh.2018.2847.

LOX-1 deficient mice show resistance to zymosan-induced arthritis

Affiliations

LOX-1 deficient mice show resistance to zymosan-induced arthritis

Kazuhiko Hashimoto et al. Eur J Histochem. .

Abstract

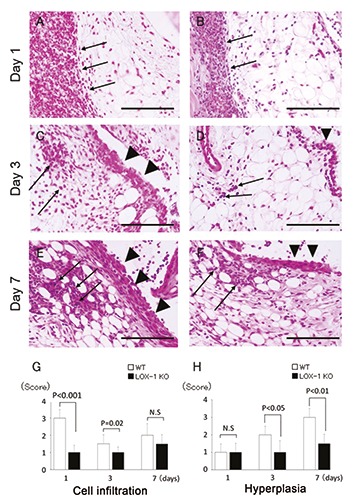
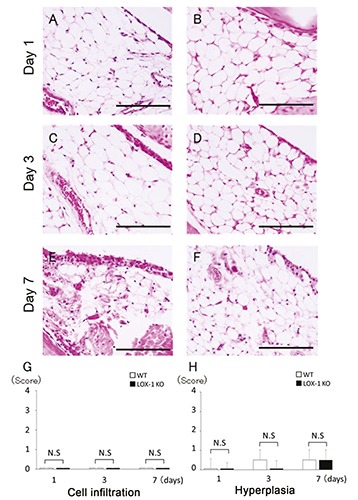
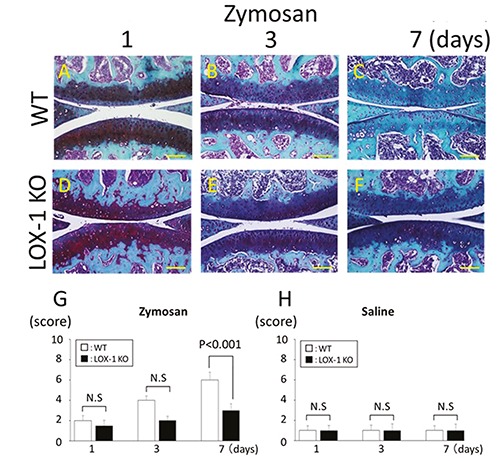
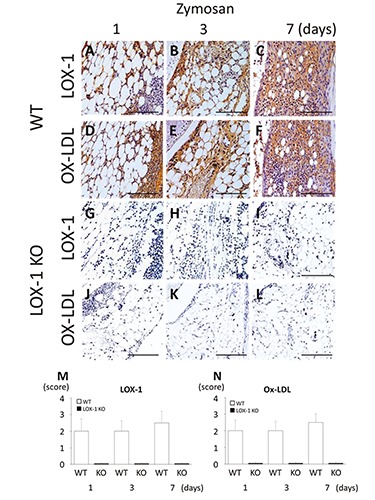
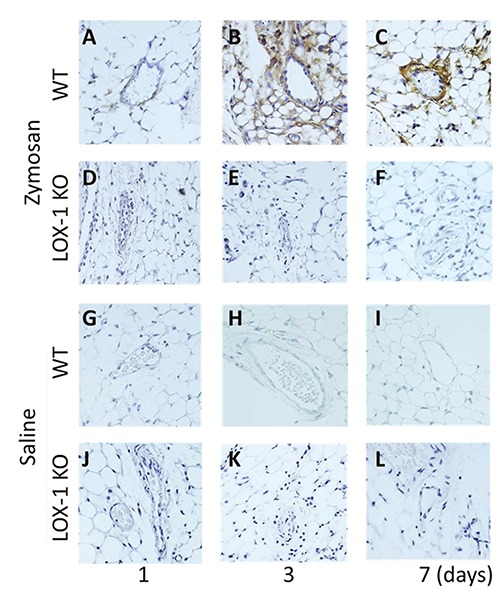
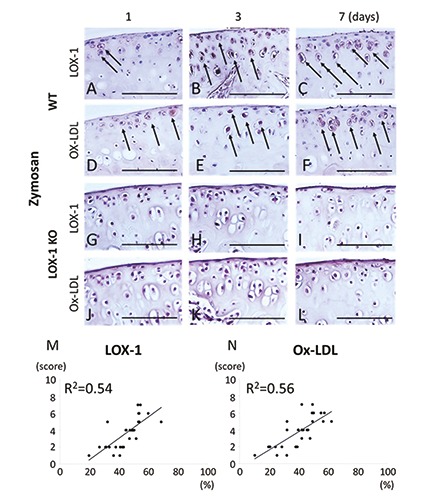
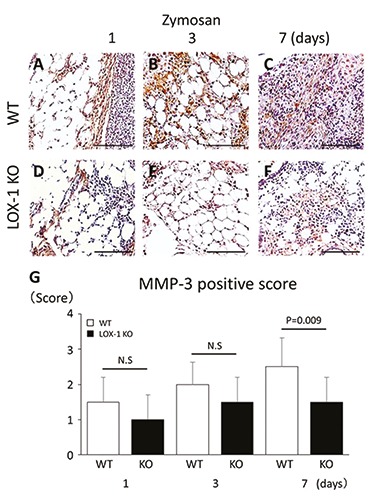
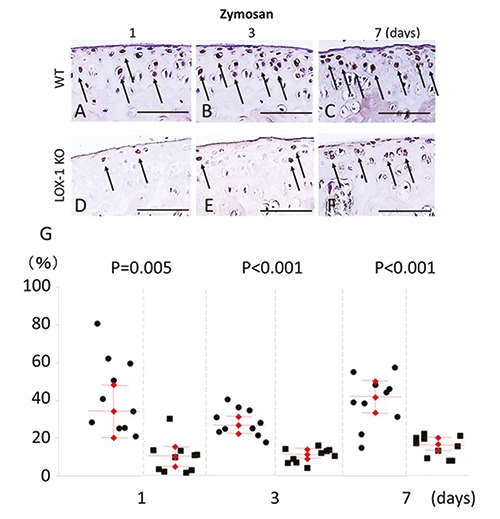
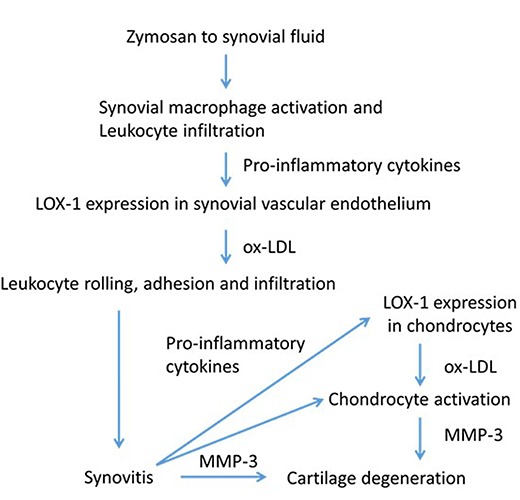
Recent data suggest that the lectin-like oxidized low-density lipoprotein (ox-LDL) receptor-1 (LOX-1)/ox-LDL system may be involved in the pathogenesis of arthritis. We aimed to demonstrate the roles of the LOX-1/ox-LDL system in arthritis development by using LOX-1 knockout (KO) mice. Arthritis was induced in the right knees of C57Bl/6 wild-type (WT) and LOX-1 KO mice via zymosan injection. Saline was injected in the left knees. Arthritis development was evaluated using inflammatory cell infiltration, synovial hyperplasia, and cartilage degeneration scores at 1, 3, and 7 days after administration. LOX-1, ox-LDL, and matrix metalloproteinase-3 (MMP-3) expression in the synovial cells and chondrocytes was evaluated by immunohistochemistry. The LOX-1, ox-LDL, and MMP-3 expression levels in synovial cells were scored on a grading scale. The positive cell rate of LOX-1, ox-LDL, and MMP-3 in chondrocytes was measured. The correlation between the positive cell rate of LOX-1 or ox-LDL and the cartilage degeneration score was also examined. Inflammatory cell infiltration, synovial hyperplasia, and cartilage degeneration were significantly reduced in the LOX-1 KOmice with zymosan-induced arthritis (ZIA) compared to WT mice with ZIA. In the saline-injected knees, no apparent arthritic changes were observed. LOX-1 and ox-LDL expression in synovial cells and chondrocytes were detected in the knees of WT mice with ZIA. No LOX-1 and ox-LDL expression was detected in the knees of LOX-1 KOmice with ZIA or the saline-injected knees of both mice. MMP-3 expression in the synovial cells and chondrocytes was also detected in knees of both mice with ZIA, and was significantly less in the LOX-1 KO mice than in WT mice. The positive cell rate of LOX-1 or ox-LDL and the cartilage degeneration score showed a positive correlation. Our data show the involvement of the LOX-1/ox-LDL system in murine ZIA development. LOX-1-positive synovial cells and chondrocytes are potential therapeutic targets for arthritis prevention.

Keywords: Arthritis; Lectin-like oxidized low-density lipoprotein receptor-1 (LOX-1); oxidized low-density lipoprotein (ox-LDL).


Conflict of interest statement

Conflict of interest: The authors declare no conflict of interest.

Figures

Figure 1.
Figure 1.
The panels show representative synovium in zymosan-injected group stained with H&E (A-F) at 400× magnification. Synovium of WT mice (A, C, E) and LOX-1 KO mice (B, D, F) at day 1, 3, and 7 after the zymosan injection. The graphs show the score of inflammatory cell infiltration (G) and synovial hyperplasia (H) in zymosan-injected groups at each experimental time. Inflammatory cell infiltration is observed less in the synovium of LOX-1 KO mice (B, D) than in that of WT mice (A, C) at day 1 and 3. Synovial hyperplasia was also observed less in the synovium of LOX-1 KO mice (D, F) than in that of WT mice (C, E) at day 3 and 7. Arrows show the infiltrated inflammatory cells to synovium. Arrowheads show the synovial hyperplasia. Data are presented as mean ± SD (n= 10, in each group); significant difference (P<0.05, Student’s t-test) are indicated between the score of WT and that of LOX- 1 KO mice). N.S, not significant. Scale bars: 100 μm.
Figure 2.
Figure 2.
The panels show representative synovium in saline-injected group stained with H&E (A-F) at 400× magnification. Synovium of WT mice (A, C, E) and LOX-1 KO mice (B, D, F) at day 1, 3, and 7 after the saline injection. No inflammatory cell infiltration was observed in the saline-injected knees of both WT (A, C, E) and LOX-1 KO mice (B, D, and F). No obvious synovial hyperplasia was observed in the saline-injected knees of both WT (A, C, E) and LOX-1 KO mice (B, D, F). The graphs show the score of inflammatory cell infiltration (G) and synovial hyperplasia (H) in saline-injected groups at each experimental time. Data are presented as mean ± SD (n= 10, in each group); P<0.05 was regarded as a significant difference (Student’s t-test). N.S, not significant. Scale bars: 100 μm.
Figure 3.
Figure 3.
The panels show representative articular cartilage staining with SFO (A-F). Articular cartilage of WT mice at day 1, 3, and 7 after zymosan injection (A-C). Articular cartilage of LOX-1 KO mice at day 1, 3, and 7 after zymosan injection (D-F). All specimens are in the sagittal direction. The graphs show the score of cartilage degeneration in the zymosan-injected knees (G), and saline-injected knees (H) at each experimental time. Cartilage degeneration was lesser in the cartilage of LOX-1 KO mice (D-F) than in WT mice (A-C) during all experimental times. Data are presented as mean ± SD (n= 10, in each group); P<0.05 was regarded as a significant difference (Student’s ttest). N.S, not significant. Scale bars: 100 μm.
Figure 4.
Figure 4.
The panels show representative synovial tissues with immunostaining for LOX-1 (A-C) and ox-LDL (D-F) at 200× magnification. LOX-1 expression in the synovial cells of WT mice at day 1, 3 and 7 after zymosan injection (A-C). Ox-LDL expression in the synovial cells of WT mice at day 1, 3 and 7 after zymosan injection (D-F). LOX-1 expression in the synovial cells of LOX-1 KO mice at day 1, 3 and 7 after zymosan injection (G-I). Ox-LDL expression in the synovial cells of LOX-1 KO mice at 1, 3 and 7 days after injection of zymosan (J-L). The graphs show the positive cell score of LOX-1 (M) and ox-LDL (N) expression in the synovium of WT and LOX-1 KO mice at each experimental time. The antibodies used in the study were rabbit anti-mouse LOX-1 polyclonal antibody and rabbit antimouse ox-LDL polyclonal antibody. Data are presented as mean ± SD (n= 10, in each group). Scale bars: 100 μm.
Figure 5.
Figure 5.
Representative synovial vascular endothelium with LOX-1 immunostaining (A-L). LOX-1 expression in the synovial vascular endothelium of WT mice at day 1, 3 and 7 after zymosan injection (A-C) at 400× magnification. LOX-1 expression in the synovial vascular endothelium of LOX-1 KO mice at day 1, 3, and 7 after zymosan injection (D-F). LOX-1 expression in the synovial vascular endothelium of WT mice at day 1, 3, and 7 after saline injection (G-I). LOX-1 expression in the synovial vascular endothelium of LOX-1 KO mice at day 1, 3, and 7 after saline injection (J-L). The expression is observed only in the synovial vascular endothelium of WT mice with zymosaninjected groups during all the experimental times (A-C). The antibodies used in the study were rabbit anti-mouse LOX-1 polyclonal antibody and rabbit anti-mouse ox-LDL polyclonal antibody.
Figure 6.
Figure 6.
The panels show representative tibial cartilage immunostaining of LOX-1 and ox-LDL (A-L) at 400× magnification. LOX-1 expression in the cartilage of WT mice at day 1, 3 and 7 after zymosan injection (A-C). Ox-LDL expression in the cartilage of WT mice at day 1, 3 and 7 after zymosan injection (D-F). LOX-1 expression in the cartilage of LOX-1 KO mice at day 1, 3 and 7 after zymosan injection (G-I). Ox-LDL expression in the cartilage of LOX-1 KO mice at day 1, 3 and 7 after zymosan injection (J-L). Although LOX-1 and ox- LDL positive cells are observed in WT mice (A-F), no positive cells are observed in LOX-1 KO mice (G-L) during all the experimental time. The graphs show the correlation between the positive cell rate for LOX-1 (M), ox-LDL (N) and the cartilage degeneration score in WT mice. The positive correlation is observed between positive cell rate for LOX-1 or ox-LDL in chondrocytes and the cartilage degeneration score. Arrows show the LOX-1 or ox-LDL positive chondrocytes. The antibodies used were rabbit anti-mouse LOX-1 polyclonal antibody and rabbit anti-mouse ox-LDL polyclonal antibody. Scale bars: 100 μm.
Figure 7.
Figure 7.
The panels show representative synovial tissues with immunostaining of MMP-3 (A-F). MMP-3 expression in the synovial cells of WT mice at day 1, 3 and 7 after zymosan injection (A-C) at 200× magnification. MMP-3 expression in the synovial cells of LOX-1 KO mice at day 1, 3 and 7 after zymosan injection (D-F). MMP-3 positive cells are observed both in synovial cells of WT (A-C) and LOX-1 KO mice (D-F) during all the experience time. At day 7, MMP-3 in synovium of LOX-1 KO mice (F) is stained weaker than in that of WT mice (C). The graphs show the positive cell score of MMP-3 expression in the synovium of WT and LOX-1 KO mice after zymosan injection at each experimental time (G). The antibodies used were rabbit anti-mouse MMP-3 polyclonal antibody. Data are presented as mean ± SD (n= 10, in each group); P<0.05 was regarded as a significant difference (Student’s t-test). N.S, not significant. Scale bars: 100 μm.
Figure 8.
Figure 8.
The panels show representative tibial chondrocyte immunostaining of MMP-3 (A-F). MMP-3 expression in the chondrocyte of WT mice at day 1, 3 and 7 after zymosan injection (A-C) at 400× magnification. MMP-3 expression in the chondrocyte of LOX-1 KO mice at day 1, 3 and 7 after zymosan injection (D-F). MMP-3 positive cells are observed both in chondrocyte of WT (A-C) and LOX-1 KO mice (D-F) during all the experimental time. MMP-3 in chondrocytes of LOX-1 KO mice (D-F) is stained weaker than in that of WT mice (AC) during all the experimental time. The graphs show the positive cell score of MMP-3 expression in the chondrocytes of WT and LOX-1 KO mice after zymosan injection at each experimental time (G). Arrows show the MMP-3 positive chondrocytes. The antibodies used were rabbit anti-mouse MMP-3 polyclonal antibody. Scale bars: 100 m.
Figure 9.
Figure 9.
Flow chart summarizing the results of the present study and the assumed relevance of the oxidized low-density lipoprotein (ox-LDL)/lectin-like ox-LDL receptor 1 (LOX-1) system to the pathogenesis of ZIA. The flowchart shows the activation of synovial cells and chondrocytes by LOX-1/ox-LDL system via pro-inflammatory cytokines.

Similar articles

Cited by

References

    1. Zhang PY, Xu X, Li XC. Cardiovascular diseases: oxidative damage and antioxidant protection. Eur Rev Med Pharmacol Sci 2014;18:3091-6. - PubMed
    1. Sawamura T, Kume N, Aoyama T, Moriwaki H, Hoshikawa H, Aiba Y, et al. An endothelial receptor for oxidized low-density lipoprotein. Nature 1997;386:73-7. - PubMed
    1. Kume N, Murase T, Moriwaki H, Aoyama T, Sawamura T, Masaki T, et al. Inducible expression of lectin-like oxidized LDL receptor-1 in vascular endothelial cells. Circ Res 1998;83: 322-7. - PubMed
    1. Aoyama T, Fujiwara H, Masaki T, Sawamura T. Induction of lectin-like oxidized LDL receptor by oxidized LDL and lysophosphatidylcholine in cultured endothelial cells. J Mol Cell Cardiol 1999;31:2101-14. - PubMed
    1. Hofnagel O, Luechtenborg B, Stolle K, Lorkowski S, Eschert H, Plenz G, et al. Proinflammatory cytokines regulate LOX-1 expression in vascular smooth muscle cells. Arterioscler Thromb Vasc Biol 2004;24:1789-95. - PubMed