The penetration of methanol into bovine cardiac and hepatic tissues is faster than ethanol and formalin
- PMID: 29569879
- PMCID: PMC5820526
- DOI: 10.4081/ejh.2018.2880
The penetration of methanol into bovine cardiac and hepatic tissues is faster than ethanol and formalin
Abstract
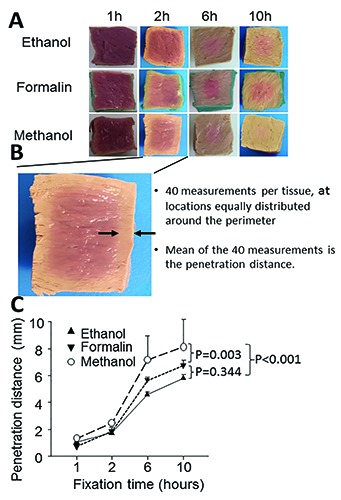
Methanol, ethanol and formalin are commonly used as fixatives to preserve biological tissues from decay in the preparation of histological sections. Fixation of the inner layers of the tissue depends on the ability of the fixative to diffuse into the tissue. It is unknown whether methanol penetrates tissues at similar rates to other fixatives. This study aimed to compare the penetration rates of methanol, ethanol and formalin into bovine heart and liver tissues. The penetration distance and tissue shrinkage or expansion were measured by analysing the digital images of tissue before and after immersion in different fixatives for 1, 2, 6 or 10 h. Data were analysed using two-way ANOVA, followed by Bonferroni's post-hoc test. The penetration distance of methanol was significantly greater in both heart and liver tissues compared with that of ethanol (N=4, P<0.001). Methanol or ethanol immersion led to similar shrinkage of both tissues (P>0.05). The penetration rate of formalin was similar to that of ethanol in both tissues however it was significantly slower than methanol (N=4, P<0.005 in the heart; P<0.001 in the liver). The mean penetration coefficients of methanol, formalin and ethanol in the heart tissue were 2.609, 1.994 and 1.801, respectively, and 3.012, 2.153 and 2.113, respectively, in the liver tissue. The penetration coefficient of methanol was significantly greater than that of ethanol or formalin in both tissues (P<0.001 for each comparison). In conclusion, methanol penetrates tissue significantly faster than ethanol and formalin.
Keywords: Ethanol; formalin; methanol; penetration coefficient; penetration rate..
Conflict of interest statement
Conflict of interest: The authors declare no conflict of interest.
Figures


Similar articles
-
The concentration of ethanol affects its penetration rate in bovine cardiac and hepatic tissues.Folia Histochem Cytobiol. 2018;1(2):92-97. doi: 10.5603/FHC.a2018.0009. Epub 2018 Jun 6. Folia Histochem Cytobiol. 2018. PMID: 29873057
-
Modified formalin and methanol fixation methods for molecular biological and morphological analyses.Pathol Int. 1997 Oct;47(10):685-91. doi: 10.1111/j.1440-1827.1997.tb04442.x. Pathol Int. 1997. PMID: 9361102
-
Penetration of formaldehyde based fixatives into heart.Folia Med Cracov. 2017;57(4):63-70. Folia Med Cracov. 2017. PMID: 29337978
-
Commercial formalin substitutes for histopathology.Biotech Histochem. 1997 Sep;72(5):273-82. doi: 10.3109/10520299709082252. Biotech Histochem. 1997. PMID: 9408588
-
Formalin fixation in the '-omics' era: a primer for the surgeon-scientist.ANZ J Surg. 2012 Jun;82(6):395-402. doi: 10.1111/j.1445-2197.2012.06092.x. Epub 2012 May 9. ANZ J Surg. 2012. PMID: 22571596 Review.
Cited by
-
T staging esophageal tumors with x rays.Optica. 2024 Apr 19;11(4):569-576. doi: 10.1364/OPTICA.501948. eCollection 2024 Apr 20. Optica. 2024. PMID: 39006164 Free PMC article.
-
Twenty years of histochemistry in the third millennium, browsing the scientific literature.Eur J Histochem. 2020 Dec 29;64(4):3213. doi: 10.4081/ejh.2020.3213. Eur J Histochem. 2020. PMID: 33478199 Free PMC article.
-
Alcohol Ablation of Cardiac Tissues Quantified and Evaluated Using CIELAB Euclidean Distances.Tex Heart Inst J. 2020 Aug 1;47(4):265-270. doi: 10.14503/THIJ-19-7140. Tex Heart Inst J. 2020. PMID: 33472218 Free PMC article.
-
Zinc-based fixative as a novel approach for histological preservation: A comparative study with formalin-based fixatives.Open Vet J. 2024 Oct;14(10):2599-2608. doi: 10.5455/OVJ.2024.v14.i10.9. Epub 2024 Oct 31. Open Vet J. 2024. PMID: 39545193 Free PMC article.
References
-
- Werner M, Chott A, Fabiano A, Battifora H. Effect of formalin tissue fixation and processing on immunohistochemistry. Am J Surg Pathol 2000;24: 1016-9. - PubMed
-
- Harrison PT. An ethanol-acetic acid-formol saline fixative for routine use with special application to the fixation of non-perfused rat lung. Lab Anim 1984; 18:325-31. - PubMed
Publication types
MeSH terms
Substances
LinkOut - more resources
Full Text Sources
Other Literature Sources