. 2018 Apr 11;18(4):2738-2745.
doi: 10.1021/acs.nanolett.8b00860. Epub 2018 Mar 28.

Double Barrel Nanopores as a New Tool for Controlling Single-Molecule Transport

Affiliations

Double Barrel Nanopores as a New Tool for Controlling Single-Molecule Transport

Paolo Cadinu et al. Nano Lett. .

Abstract

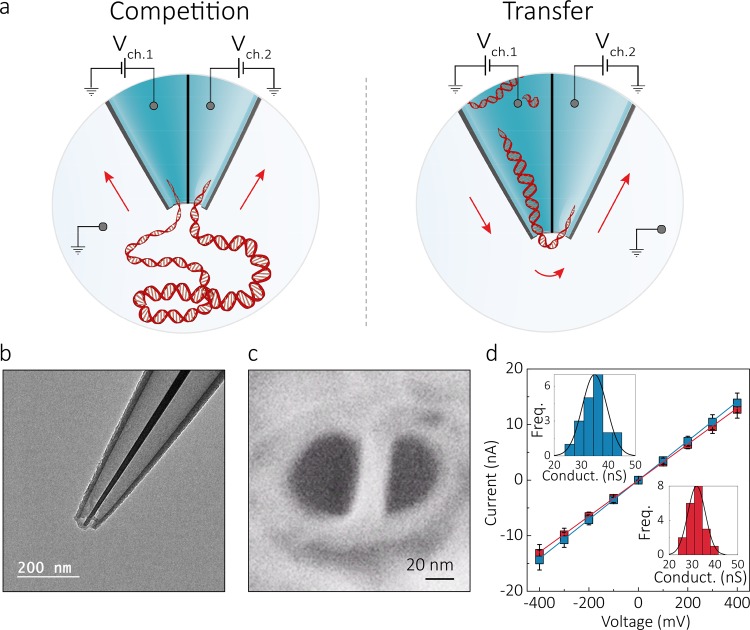
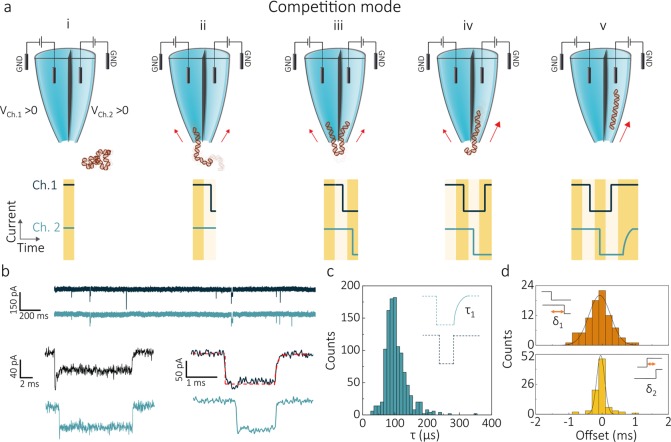
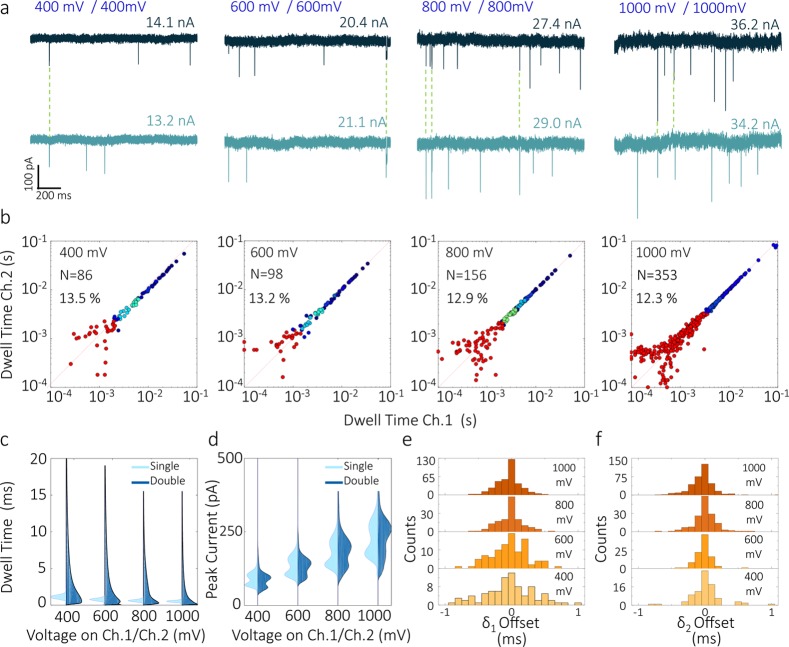
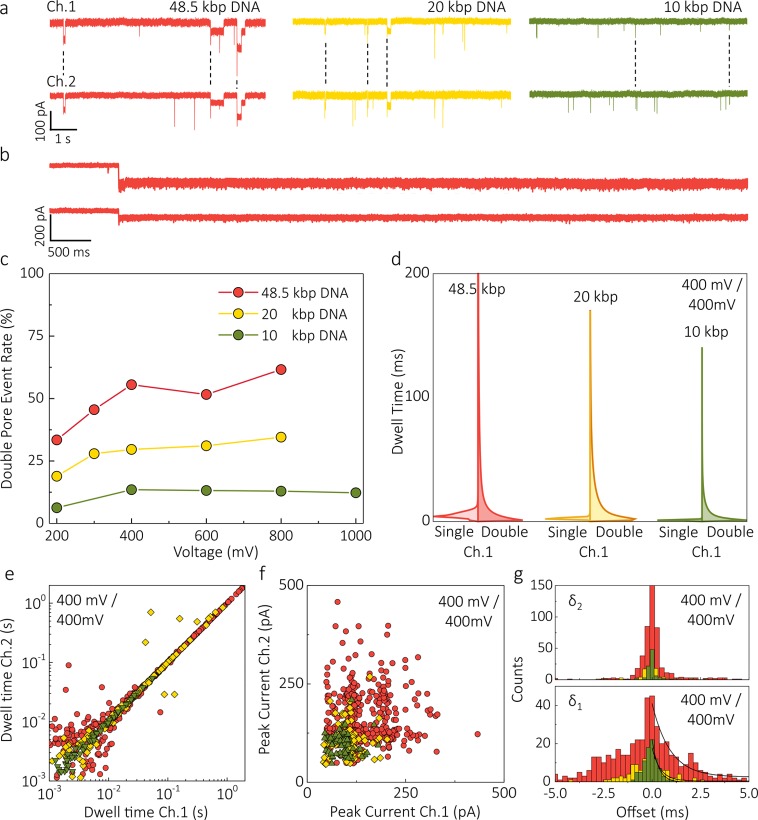
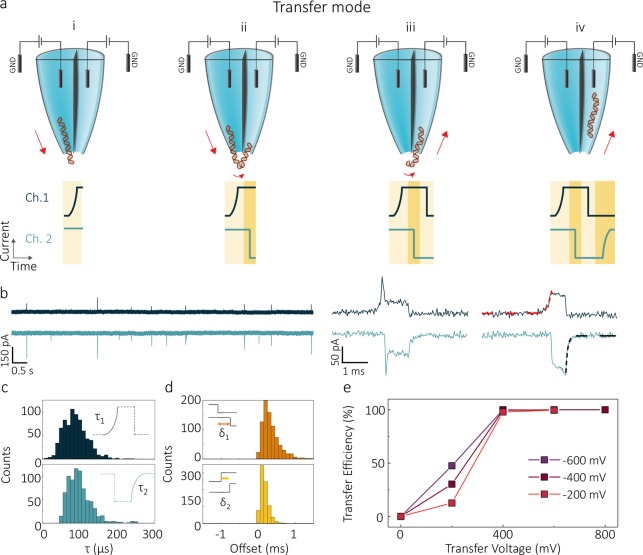
The ability to control the motion of single biomolecules is key to improving a wide range of biophysical and diagnostic applications. Solid-state nanopores are a promising tool capable of solving this task. However, molecular control and the possibility of slow readouts of long polymer molecules are still limited due to fast analyte transport and low signal-to-noise ratios. Here, we report on a novel approach of actively controlling analyte transport by using a double-nanopore architecture where two nanopores are separated by only a ∼ 20 nm gap. The nanopores can be addressed individually, allowing for two unique modes of operation: (i) pore-to-pore transfer, which can be controlled at near 100% efficiency, and (ii) DNA molecules bridging between the two nanopores, which enables detection with an enhanced temporal resolution (e.g., an increase of more than 2 orders of magnitude in the dwell time) without compromising the signal quality. The simplicity of fabrication and operation of the double-barrel architecture opens a wide range of applications for high-resolution readout of biological molecules.

Keywords: Single-molecule sensing; biophysics; double nanopore architecture.


Conflict of interest statement

The authors declare no competing financial interest.

Figures

Figure 1
Figure 1
Experimental setup and characterization of the double nanopore platform. (a) Schematic representation of the experimental setup showing a double barrel nanopore. In all experiments, the ground electrode was placed in the bath along with the DNA, while each barrel contained an independent working electrode, allowing each nanopore to be addressed individually. Depending on the polarity of the bias applied to the channels, two modes of operation are possible: competition and transfer mode. In the competition mode, where a positive bias is applied to both barrels, DNA molecules are attracted toward the two pores and can result in a single molecule being trapped between them. In the transfer mode, the pores are biased with voltages of opposite polarity enabling DNA molecules to be ejected from one pore and immediately threaded into the second one. (b,c) TEM and SEM images of the double barrel quartz nanopipette, respectively, showing pore diameters of approximately 23 ± 9 nm (n = 4 devices) separated by ≃20 nm gap and a cone angle of ∼0.11 radians. (d) Current–voltage characteristics of the two barrels measured in 2 M LiCl buffered in TE at pH 8 showing comparable a pore size. Errors denote one standard deviation. Insets show conductance histograms of the two pores.
Figure 2
Figure 2
DNA translocations in competition mode. (a) Schematic of a DNA molecule being trapped between the two pores in competition mode. A positive bias is applied to each of the barrels, causing a DNA molecule to move from the bath toward the tip of the nanopipette (i). Subsequently, the molecule starts threading into one of the pores (ii) inducing a sharp drop in the ionic current of the corresponding channel. Given the proximity of the two apertures, the nontranslocated part of the molecule can get captured by the second pore (iii) resulting in a double pore event. Competing forces are exerted on the DNA by each of the nanopores, leading to a prolonged residence time across the pores. Eventually, the molecule slips out of the channel exerting the weakest force on the DNA sharply ending the current blockade of its recording (iv), and escapes through the other nanopore (v). Notably, when the DNA completes its translocation into the second nanopore, the corresponding ionic current recording returns to baseline following an exponential profile. (b) Current–time traces of the two detection channels acquired for 300 pM 10 kbp DNA molecules in 2 M LiCl at 400 mV bias applied to both barrels. At the bottom of the panel, two examples of double pore event current traces are shown. The exit channel recording (Ch.1 top current trace in both examples) of the double pore events shows the characteristic monoexponential profile with time-constant τ. (c) A histogram of τ revealed a peak maximum of ∼100 μs. (d) Histograms of the time offset at the start (δ1) and end (δ2) of double pore events.
Figure 3
Figure 3
Voltage dependence analysis of DNA translocations in competition mode. Equal voltages ranging from 400 to 1000 mV were applied to both nanopores. Detection was carried out using 300 pM 10 kbp DNA in 2 M LiCl. (a) Representative current–time traces measured at the two detection channels at the different voltages. (b) Scatter plots of dwell times of double pore events plotted for channel 2 versus channel 1. Distributions are symmetric with respect to the diagonal of the plot (dotted line) meaning that the recorded dwell times are comparable for both channels. (c,d) Voltage dependence of dwell time and peak current for double pore (dark blue) and single pore (light blue) events. Double pore events experience a significant increase in dwell times, compared to single pore events. Both double pore and single pore events show peak currents increasing and dwell times decreasing with increasing voltages. (e,f) Distribution of start (δ1) and end (δ2) offsets for the different voltages. The width of the distributions narrows as voltages increase, with δ12 < |1| ms at 400 mV and δ12 < |0.5| ms at 1000 mV.
Figure 4
Figure 4
DNA size dependence in competition mode. (a) Ionic current traces recorded in competition mode for 50 pM 48.5 kbp DNA (red), 150 pM 20 kbp DNA (yellow), and 300 pM 10 kbp DNA (green) when 400 mV is applied to both nanopores (the color code for different DNA length is maintained throughout the whole figure). (b) Representative examples of 48.5 kbp DNA molecule trapped between the pores when 200 mV was applied to both nanopores. The molecule could only be released after reversing the potential in one of the channels. (c) Double pore event rate versus voltage for 10, 20, and 48.5 kbp DNA (2 M LiCl in TE buffered at pH 8.0). The rates show a strong dependence on the DNA size and a moderate dependence on the voltage applied. (d) Comparison between the probability density function of dwell times for double pore and single pore events recorded at 400 mV. (e,f) Scatter plots of the dwell times and peak current of double pore events. (g) Start (δ1) and end (δ2) offset distributions. For all DNA lengths, double pore events show longer start offsets compared to end offsets with the majority of the double pore translocations of 48.5 kbp molecules having δ1 < |5 ms| and δ2 < |1 ms|. The width of both distributions decreases with decreasing DNA length: the time constant of the exponential fittings for the start offset was calculated to be 0.93 ± 0.14, 0.43 ± 0.07, and 0.32 ± 0.01 ms for 48.5, 20, and 10 kbp DNA respectively.
Figure 5
Figure 5
DNA translocations in transfer mode. (a) Schematic of a pore-to-pore translocation in transfer mode. Voltages of opposite polarity are applied to both detection channels. The exit of a DNA molecule from the nanopore held at negative bias can be observed as an exponential rise being recorded on the current time trace of Channel 1 which is defined as the delivery detection channel (dark blue) (i). Before being fully released into the bath, the molecule is attracted toward the second nanopore (recipient detection channel), inducing a sharp blockade onset in the current trace (light blue) (ii). The DNA then exits the delivery nanopore (iii) and translocates through the recipient nanopore (iv), resulting in an gradual rise in the ionic current of the recipient channel. (b) Current–time traces of the two channels acquired for 300 pM 10 kbp DNA in 2 M LiCl when a −400 mV (Ch. 1) and 400 mV (Ch. 2) are applied. At the bottom of the panel examples of double pore transfer events are shown. representative profiles of individual translocation event measured in the delivery (dark blue) and the recipient (blue) channel. Monoexponential fits are highlighted with red and black dashed fitting lines, respectively. (c) Histograms of exponential decay fittings of double pore transfer events recorded for both delivery (τ1) and transfer (τ2). (d) Distributions of start (δ1) and end (δ2) offsets of the transfer events. Transfer events show faster end offsets than beginning offsets, with δ1 < |1.5| ms and δ2 < |0.5| ms.(e) Transfer efficiency as a function of the bias applied to the recipient nanopore for voltages of −200, −400, and −600 mV, applied at the delivery channel.

References

    1. Dekker C. Solid-State Nanopores. Nat. Nanotechnol. 2007, 2, 209–215. 10.1038/nnano.2007.27. - DOI - PubMed
    1. Miles B. N.; Ivanov A. P.; Wilson K.; Doğan F.; Japrung D.; Edel J. B. Single Molecule Sensing with Solid-State Nanopores: Novel Materials, Methods, and Applications. Chem. Soc. Rev. 2013, 42, 15–28. 10.1039/C2CS35286A. - DOI - PubMed
    1. Siwy Z. S.; Howorka S. Engineered Voltage-Responsive Nanopores. Chem. Soc. Rev. 2010, 39, 1115–1132. 10.1039/B909105J. - DOI - PubMed
    1. Clarke J.; Wu H.; Jayasinghe L.; Patel A.; Reid S.; Bayley H. Continuous Base Identification for Single-Molecule Nanopore DNA Sequencing. Nat. Nanotechnol. 2009, 4, 265–270. 10.1038/nnano.2009.12. - DOI - PubMed
    1. Greninger A. L.; Naccache S. N.; Federman S.; Yu G.; Mbala P.; Bres V.; Stryke D.; Bouquet J.; Somasekar S.; Linnen J. M. Rapid Metagenomic Identification of Viral Pathogens in Clinical Samples by Real-Time Nanopore Sequencing Analysis. Genome Med. 2015, 7, 99. 10.1186/s13073-015-0220-9. - DOI - PMC - PubMed

Publication types