

Spatial Systems Lipidomics Reveals Nonalcoholic Fatty Liver Disease Heterogeneity
- PMID: 29570976
- PMCID: PMC5906754
- DOI: 10.1021/acs.analchem.7b05215
Spatial Systems Lipidomics Reveals Nonalcoholic Fatty Liver Disease Heterogeneity
Abstract
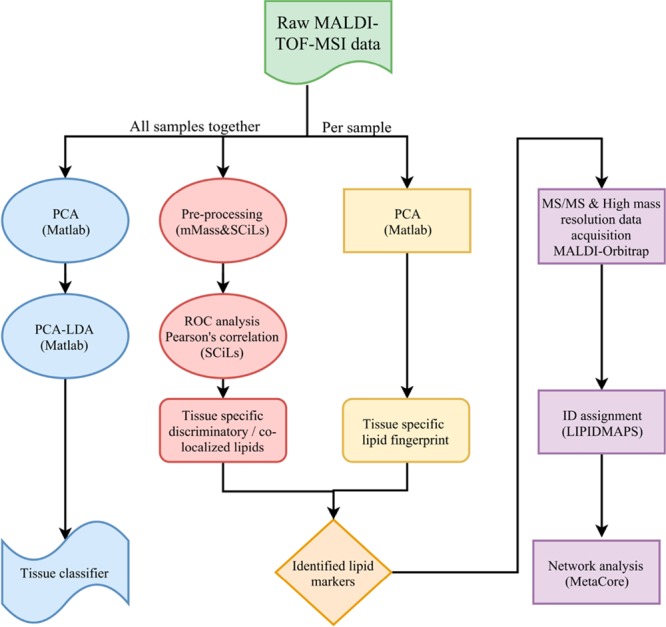
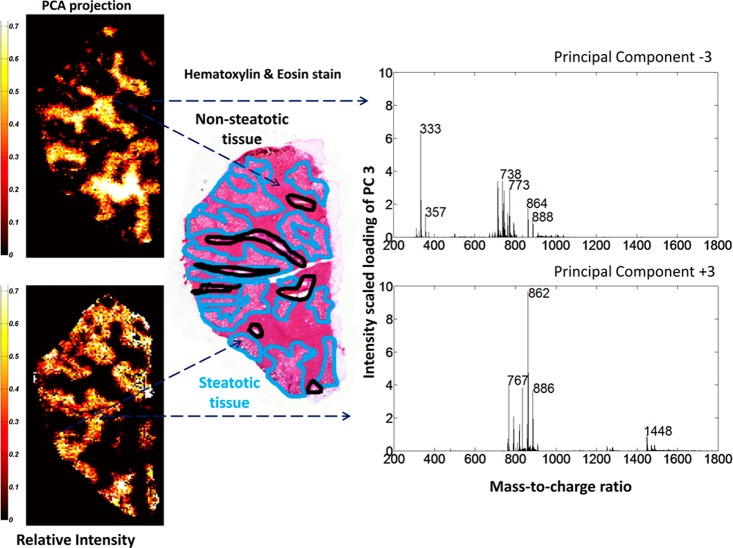
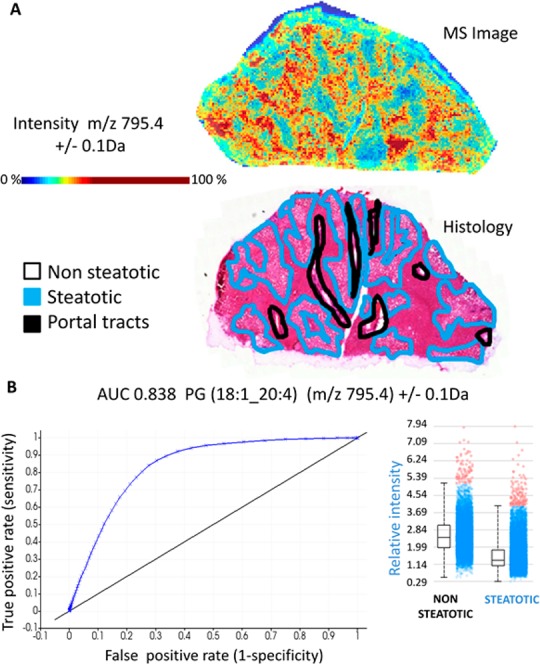
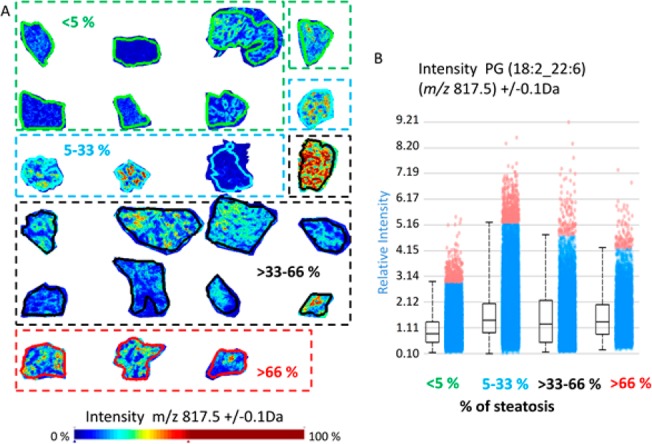
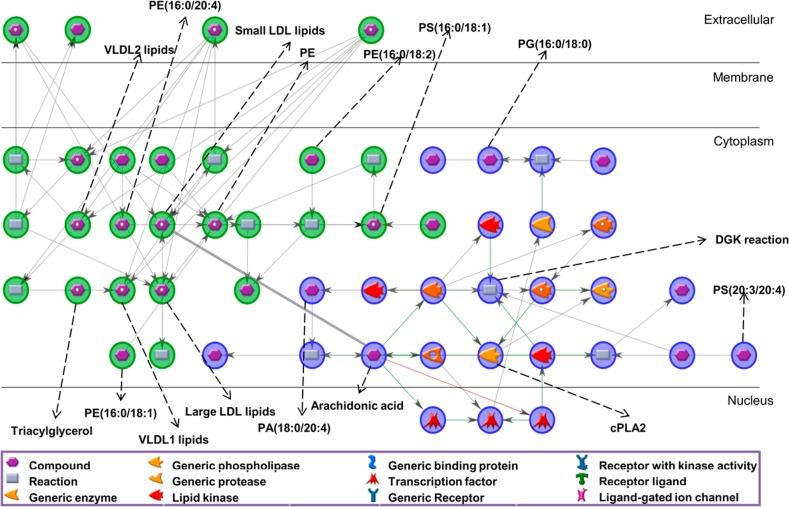
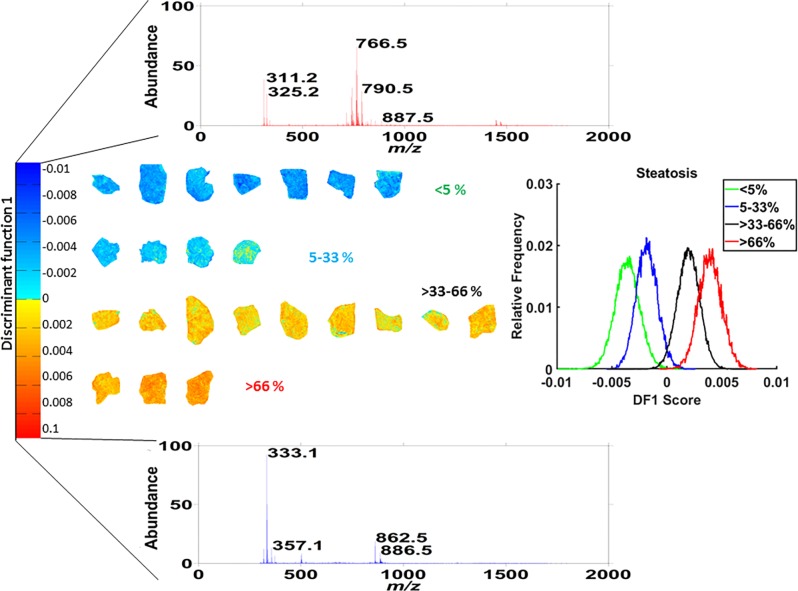
Hepatocellular lipid accumulation characterizes nonalcoholic fatty liver disease (NAFLD). However, the types of lipids associated with disease progression are debated, as is the impact of their localization. Traditional lipidomics analysis using liver homogenates or plasma dilutes and averages lipid concentrations, and does not provide spatial information about lipid distribution. We aimed to characterize the distribution of specific lipid species related to NAFLD severity by performing label-free molecular analysis by mass spectrometry imaging (MSI). Fresh frozen liver biopsies from obese subjects undergoing bariatric surgery ( n = 23) with various degrees of NAFLD were cryosectioned and analyzed by matrix-assisted laser desorption/ionization (MALDI)-MSI. Molecular identification was verified by tandem MS. Tissue sections were histopathologically stained, annotated according to the Kleiner classification, and coregistered with the MSI data set. Lipid pathway analysis was performed and linked to local proteome networks. Spatially resolved lipid profiles showed pronounced differences between nonsteatotic and steatotic tissues. Lipid identification and network analyses revealed phosphatidylinositols and arachidonic acid metabolism in nonsteatotic regions, whereas low-density lipoprotein (LDL) and very low-density lipoprotein (VLDL) metabolism was associated with steatotic tissue. Supervised and unsupervised discriminant analysis using lipid based classifiers outperformed simulated analysis of liver tissue homogenates in predicting steatosis severity. We conclude that lipid composition of steatotic and nonsteatotic tissue is highly distinct, implying that spatial context is important for understanding the mechanisms of lipid accumulation in NAFLD. MSI combined with principal component-linear discriminant analysis linking lipid and protein pathways represents a novel tool enabling detailed, comprehensive studies of the heterogeneity of NAFLD.
Conflict of interest statement
The authors declare no competing financial interest.
Figures
Similar articles
-
Mapping the triglyceride distribution in NAFLD human liver by MALDI imaging mass spectrometry reveals molecular differences in micro and macro steatosis.Anal Bioanal Chem. 2019 Feb;411(4):885-894. doi: 10.1007/s00216-018-1506-8. Epub 2018 Dec 5. Anal Bioanal Chem. 2019. PMID: 30515538 Free PMC article.
-
Steatohepatitis and liver fibrosis are predicted by the characteristics of very low density lipoprotein in nonalcoholic fatty liver disease.Liver Int. 2016 Aug;36(8):1213-20. doi: 10.1111/liv.13076. Epub 2016 Feb 24. Liver Int. 2016. PMID: 26815314 Free PMC article.
-
Oxidized low-density lipoprotein antibodies/high-density lipoprotein cholesterol ratio is linked to advanced non-alcoholic fatty liver disease lean patients.J Gastroenterol Hepatol. 2016 Sep;31(9):1611-8. doi: 10.1111/jgh.13335. J Gastroenterol Hepatol. 2016. PMID: 26946071
-
Genetic Factors in the Pathogenesis of Nonalcoholic Fatty Liver and Steatohepatitis.Biomed Res Int. 2015;2015:460190. doi: 10.1155/2015/460190. Epub 2015 Jul 27. Biomed Res Int. 2015. PMID: 26273621 Free PMC article. Review.
-
Surface analysis of lipids by mass spectrometry: more than just imaging.Prog Lipid Res. 2013 Oct;52(4):329-53. doi: 10.1016/j.plipres.2013.04.005. Epub 2013 Apr 24. Prog Lipid Res. 2013. PMID: 23623802 Review.
Cited by
-
Spatial metabolomics and its application in the liver.Hepatology. 2024 May 1;79(5):1158-1179. doi: 10.1097/HEP.0000000000000341. Epub 2023 Feb 23. Hepatology. 2024. PMID: 36811413 Free PMC article. Review.
-
MALDI-Mass Spectrometry Imaging to Investigate Lipid and Bile Acid Modifications Caused by Lentil Extract Used as a Potential Hypocholesterolemic Treatment.J Am Soc Mass Spectrom. 2019 Oct;30(10):2041-2050. doi: 10.1007/s13361-019-02265-9. Epub 2019 Aug 5. J Am Soc Mass Spectrom. 2019. PMID: 31385259 Free PMC article.
-
Lipoprotein Lipidomics as a Frontier in Non-Alcoholic Fatty Liver Disease Biomarker Discovery.Int J Mol Sci. 2024 Jul 29;25(15):8285. doi: 10.3390/ijms25158285. Int J Mol Sci. 2024. PMID: 39125855 Free PMC article. Review.
-
Evaluation of lipid coverage and high spatial resolution MALDI-imaging capabilities of oversampling combined with laser post-ionisation.Anal Bioanal Chem. 2020 Apr;412(10):2277-2289. doi: 10.1007/s00216-019-02290-3. Epub 2019 Dec 26. Anal Bioanal Chem. 2020. PMID: 31879798 Free PMC article.
-
Development and evaluation of matrix application techniques for high throughput mass spectrometry imaging of tissues in the clinic.Clin Mass Spectrom. 2019 Jan 28;12:7-15. doi: 10.1016/j.clinms.2019.01.004. eCollection 2019 Apr. Clin Mass Spectrom. 2019. PMID: 34841074 Free PMC article.
References
Publication types
MeSH terms
Substances
LinkOut - more resources
Full Text Sources
Other Literature Sources
Medical
