. 2018 Mar 22;173(1):140-152.e15.
doi: 10.1016/j.cell.2018.02.057.

A Neural Circuit for the Suppression of Pain by a Competing Need State

Affiliations

A Neural Circuit for the Suppression of Pain by a Competing Need State

Amber L Alhadeff et al. Cell. .

Abstract

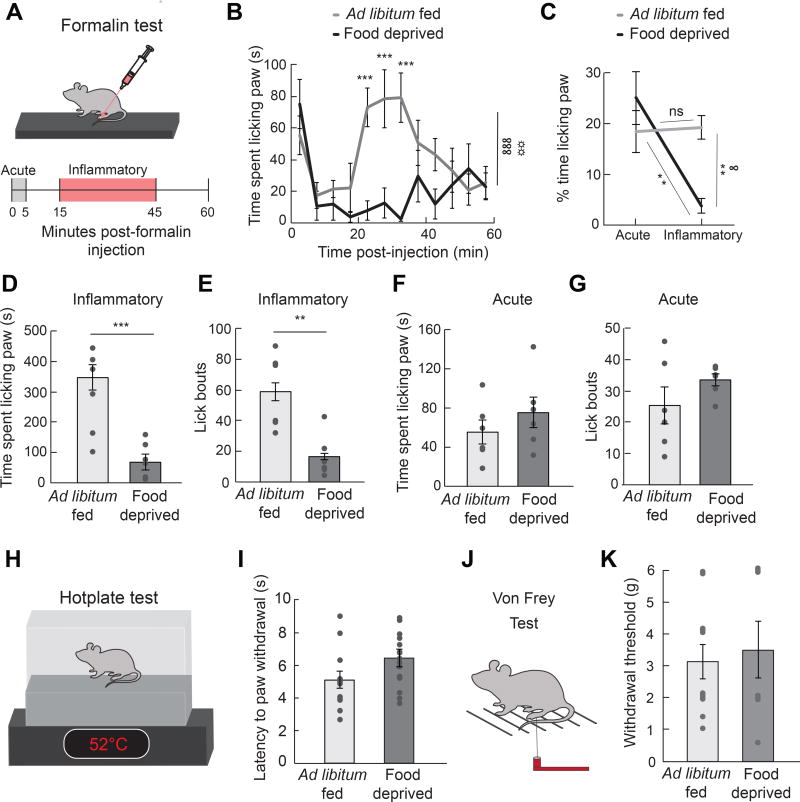
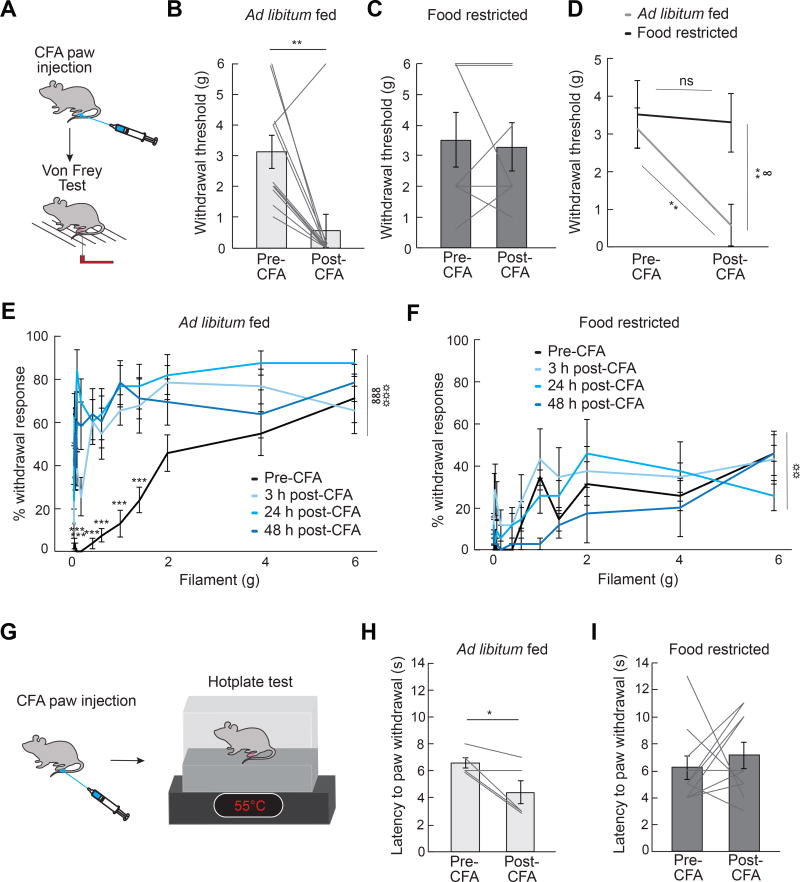
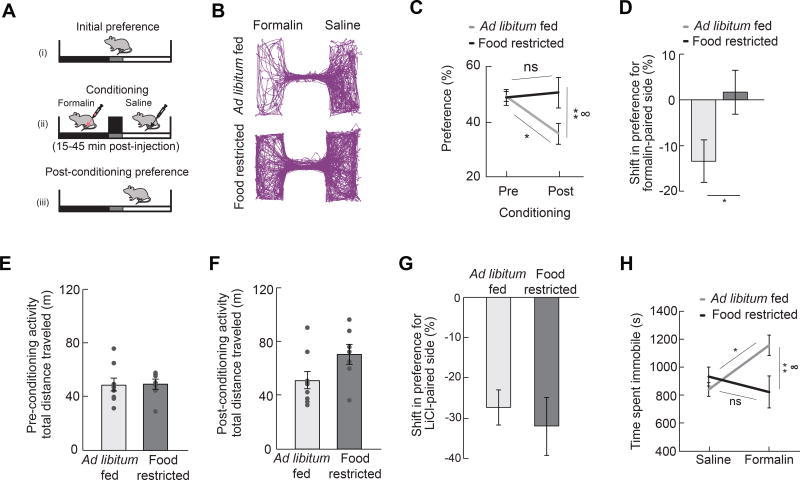
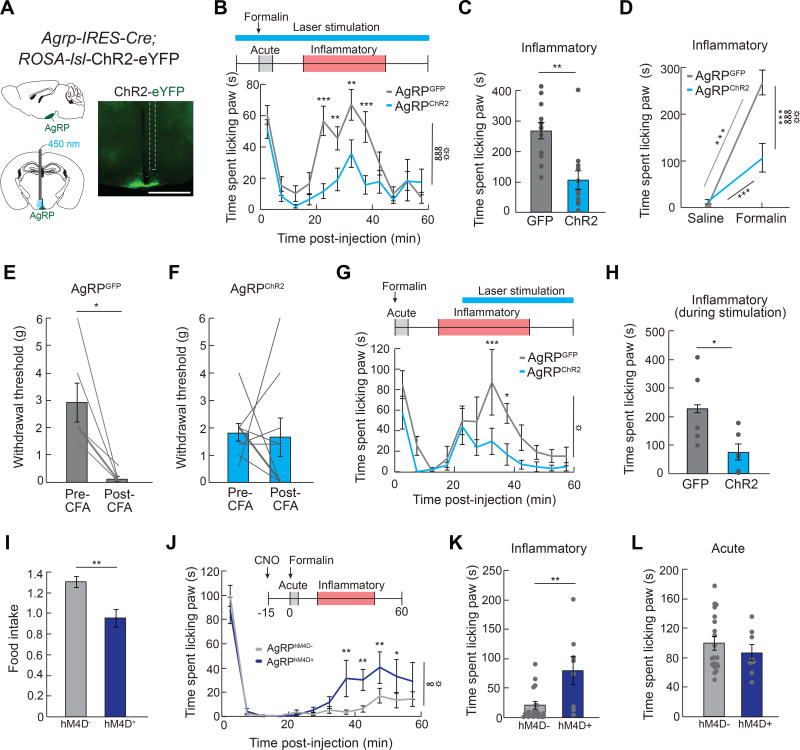
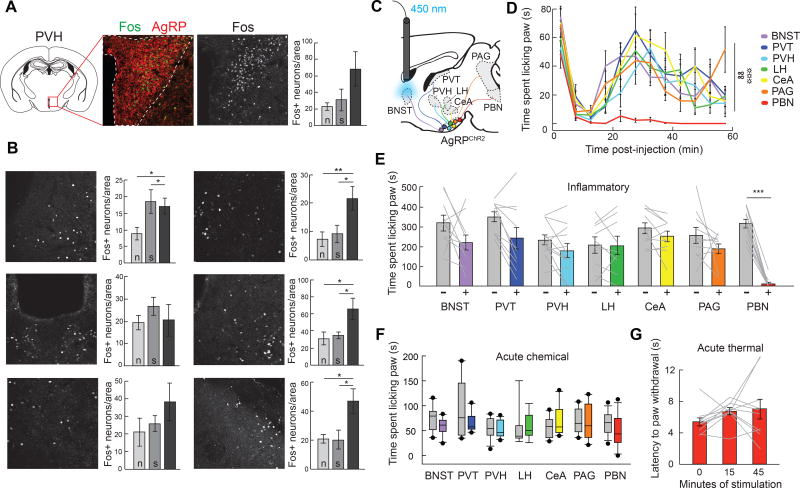
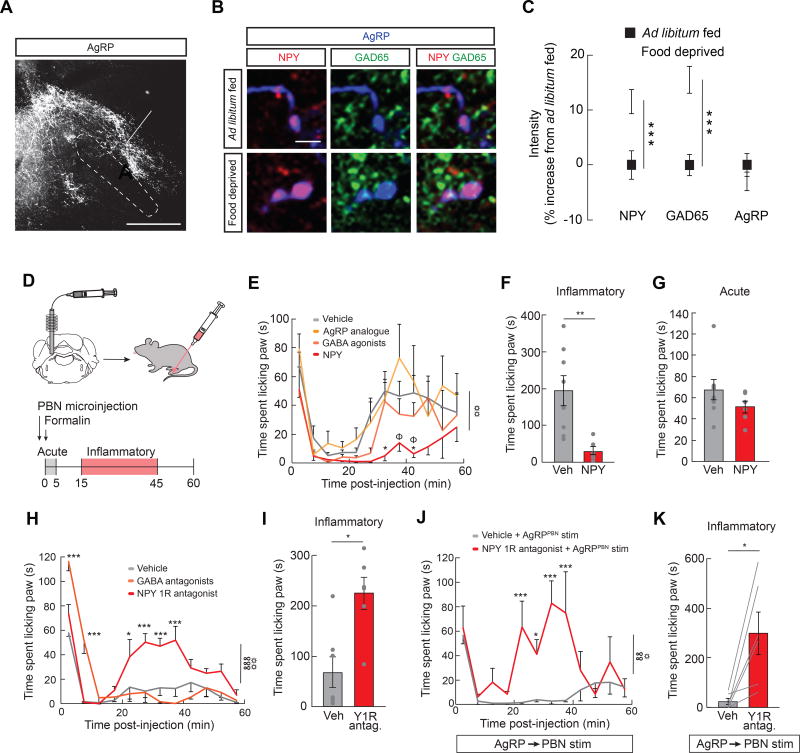
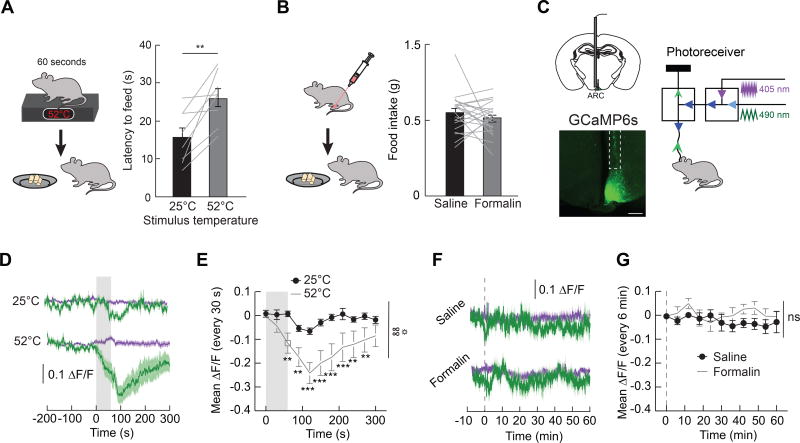
Hunger and pain are two competing signals that individuals must resolve to ensure survival. However, the neural processes that prioritize conflicting survival needs are poorly understood. We discovered that hunger attenuates behavioral responses and affective properties of inflammatory pain without altering acute nociceptive responses. This effect is centrally controlled, as activity in hunger-sensitive agouti-related protein (AgRP)-expressing neurons abrogates inflammatory pain. Systematic analysis of AgRP projection subpopulations revealed that the neural processing of hunger and inflammatory pain converge in the hindbrain parabrachial nucleus (PBN). Strikingly, activity in AgRP → PBN neurons blocked the behavioral response to inflammatory pain as effectively as hunger or analgesics. The anti-nociceptive effect of hunger is mediated by neuropeptide Y (NPY) signaling in the PBN. By investigating the intersection between hunger and pain, we have identified a neural circuit that mediates competing survival needs and uncovered NPY Y1 receptor signaling in the PBN as a target for pain suppression.

Keywords: AgRP neurons; analgesia; calcium imaging; hunger; inflammation; neuropeptide Y; nociception; optogenetics; pain; parabrachial nucleus.


Conflict of interest statement

Declaration of Interests

The authors declare no competing interests.

Figures

Figure 1
Figure 1. Hunger Attenuates Response to Inflammatory Pain
(A) Experimental design (formalin test): paw injection of 2% formalin was administered at 0 min; time spent licking paw was measured for 60 min and quantified during the acute phase (0–5 min) and the inflammatory phase (15–45 min). (B) Time spent licking paw following formalin injection displayed in 5 min time bins in ad libitum fed (n=6) and 24 h food deprived (n=6) mice (two-way repeated measures ANOVA, p<0.001). (C) % time spent paw licking during acute and inflammatory phases of formalin test (two-way repeated measures ANOVA, p<0.05). (D) Time spent paw licking during the inflammatory phase of formalin test in ad libitum fed and 24 h food deprived mice (unpaired t-test, p<0.001). (E) Lick bouts during the inflammatory phase of formalin test in ad libitum fed and 24 h food deprived mice (unpaired t-test, p<0.01). (F) Time spent paw licking during the acute phase of formalin test in ad libitum fed and 24 h food deprived mice (unpaired t-test, p=ns). (G) Lick bouts during the acute phase of formalin test in ad libitum fed and 24 h food deprived mice (unpaired t-test, p=ns). (H) Experimental design (hotplate test): Latency to withdraw paw from 52°C hotplate was measured. (I) Latency to withdraw paw in ad libitum fed (n=12) versus 24 h food deprived (n=14) mice during hotplate test (unpaired t-test, p=ns). (J) Experimental design (Von Frey): Paw withdrawal from Von Frey filaments was measured. (K) Withdrawal threshold (Von Frey filament at which mouse responded to >50% of trials) in ad libitum fed (n=11) versus 24 h food deprived (n=7) mice (unpaired t-test, p=ns). Data are expressed as mean ± SEM, ns p>0.05, t-tests and post-hoc comparisons: *p<0.05, **p<0.01, ***p<0.001; ANOVA interaction: ∞p<0.05, ∞∞∞p<0.001; ANOVA main effect of group: ☼☼p<0.01.
Figure 2
Figure 2. Hunger Attenuates Inflammation-Induced Sensitization to Mechanical and Thermal Pain
(A) Experimental design [Complete Freund’s Adjuvant (CFA) and Von Frey Test]: CFA was injected in the plantar surface of the hindpaw after a baseline Von Frey test. Mice were subjected again to a Von Frey test 3 h, 24 h, and 48 h post-CFA injection. (B) Withdrawal threshold (Von Frey filament at which mouse responded to >50% of trials) in ad libitum fed mice (n=11) before and 24 h post-CFA injection (paired t-test, p<0.01). (C) Withdrawal threshold in food restricted mice (n=7) before and 24 h post-CFA injection (paired ttest, p=ns). (D) Withdrawal threshold in ad libitum fed (n=11) and food restricted mice (n=7) before and 24 h post-CFA injection (two-way repeated measures ANOVA, p<0.05). (E) Percentage withdrawal from Von Frey filaments before and 3 h, 24 h, and 48 h post-CFA injection in ad libitum fed mice (n=11, two-way repeated measures ANOVA, p<0.001). (F) Percentage withdrawal from Von Frey filaments before and 3 h, 24 h, and 48 h post-CFA injection in food restricted mice (n=7, two-way repeated measures ANOVA, p=ns). (G) Experimental design (CFA and hotplate test): mice were injected with CFA after a baseline hotplate test. Mice were subjected again to a hotplate test 3 h, 24 h, and 48 h post-CFA injection. (H) Latency to paw withdrawal from hotplate in ad libitum fed mice (n=5) before and 48 h post-CFA injection (paired t-test, p<0.05). (I) Latency to paw withdrawal from hotplate in food restricted mice (n=10) before and 48 h post-CFA injection (paired t-test, p=ns). Data are expressed as mean ± SEM, ns p>0.05, t-tests and post-hoc comparisons: *p<0.05, **p<0.01, ***p<0.001; ANOVA interaction: ∞p<0.05, ∞∞∞p<0.001; ANOVA main effect of drug: ☼☼p<0.01, ☼☼☼p<0.001.
Figure 3
Figure 3. Hunger Attenuates Negative Affective Components of Pain
(A) Experimental design [conditioned place avoidance (CPA)]: one side of a two-sided chamber was paired with the inflammatory phase following formalin paw injection in either ad libitum fed or food restricted mice for 4 days and the post-conditioning preference was measured in replete animals. (B) Representative traces of locations of mice following formalin CPA. (C) Preference for formalinpaired side before and after conditioning in ad libitum fed (n=9) and food restricted (n=7) mice (two-way repeated measures ANOVA, p<0.05). (D) Shift in preference for formalin-paired side in ad libitum fed and food restricted mice (unpaired t-test, p<0.05). (E, F) Mice in ad libitum fed (n=9) and food restricted (n=7) groups exhibit similar locomotor activity both before (E) and after (F) CPA to inflammatory phase pain (unpaired t-tests, ps=ns). (G) Shift in preference for lithium chloride-paired side in ad libitum fed and food restricted mice (unpaired t-test, p=ns). (H) Time spent immobile in ad libitum fed and 24 h food deprived mice during inflammatory phase following formalin injection (n=7–10/group, two-way ANOVA, p<0.05). Data are expressed as mean ± SEM, ns p>0.05, t-tests and post-hoc comparisons: *p<0.05, **p<0.01; ANOVA interaction: ∞p<0.05.
Figure 4
Figure 4. AgRP Neurons Mediate Suppression of Inflammatory Pain
(A) Schematic and representative image of ChR2 in AgRP-IRES-Cre mice implanted with an optical fiber (white dashed line indicates fiber track) above the ARC. Scale bar, 1 mm. (B) Top, experimental design: 450 nm light pulse delivery began 10 min before formalin administration and continued for the duration of the formalin test. Bottom, graph: Time spent paw licking in AgRPGFP (n=12) and AgRPChR2 (n=12) mice following formalin administration (two-way repeated measures ANOVA, p<0.001) (C) Inflammatory phase formalin-induced paw licking (time) in AgRPGFP and AgRPChR2 mice (unpaired t-test, p<0.01) (D) Time spent licking paw during inflammatory phase following saline or formalin injection in AgRPGFP and AgRPChR2 mice (two-way repeated measures ANOVA, p<0.001). (E) Withdrawal threshold (Von Frey filament at which mouse responded to >50% of trials) in AgRPGFP mice (n=6) before and 24 h post-CFA injection (paired t-test, p<0.05) (F) Withdrawal threshold in AgRPChR2 mice (n=9) before and 24 h post-CFA injection (paired t-test, p=ns) (G) Top, experimental design: 450 nm light pulses were delivered beginning 25 min post-formalin injection and lasting through the duration of the session. Bottom, graph: time spent paw licking in AgRPGFP (n=6) and AgRPChR2 (n=6) mice [two-way repeated measures ANOVA, main effect of stimulation (AgRPGFP vs. AgRPChR2), p<0.05]. (H) Inflammatory phase formalin-induced paw licking (time) during laser stimulation (25–45 min) in AgRPGFP and AgRPChR2 mice (unpaired t-test, p<0.05). (I) Food intake in food deprived AgRPhM4D− (n=9) and AgRPhM4D+ (n=4) mice 4 h following CNO injection (unpaired t-test, p<0.01). (J) Time spent paw licking in AgRPhM4D− (n=20) and AgRPhM4D+ (n=8) mice following formalin injection (two-way repeated measures ANOVA, p<0.05). (K) Inflammatory phase formalin-induced paw licking (time) in AgRPhM4D− and AgRPhM4D+ mice (unpaired t-test, p<0.01). (L) Acute phase formalin-induced paw licking (time) in AgRPhM4D− and AgRPhM4D+ mice (unpaired t-test, p=ns). Data are expressed as mean ± SEM, ns p>0.05, t-tests and post-hoc comparisons: *p<0.05, **p<0.01, ***p<0.001; ANOVA interaction: ∞p<0.05, ∞∞∞p<0.001; ANOVA main effect of group: ☼p<0.05, ☼☼p<0.01.
Figure 5
Figure 5. AgRP→PBN Neuron Activity Suppresses Inflammatory Pain
(A) Immediate early gene protein expression analysis was performed to detect changes in neural activity in AgRP neuron target regions following formalin paw injection. Fos+ neurons in each target region (PVH depicted here) were quantified per unilateral brain section under the area of dense AgRP axonal projections (red, outlined by white dashed line). Scale bar, 150 µm. Graph depicts quantification of Fos+ neurons in the PVH under AgRP axons following no treatment (n), saline paw injection (s), or formalin paw injection (f). (B) Representative images and graphs depicting quantification of Fos+ neurons under AgRP axons following no treatment (n), saline paw injection (s), or formalin paw injection (f) (n=9, 2–4 images per mouse per target region, one-way ANOVA within brain region, p<0.05 for BNST, CeA, PAG, PBN). Scale bar, 150 µm. (C) Diagram of the major AgRP neuron projection subpopulations analyzed. Delivery of light to individual axon target fields of AgRP neurons (BNST shown here) allows for selective activation of discrete AgRP neuron projection subpopulations. (D) Time spent paw licking following formalin injection during optogenetic stimulation of AgRP neuron projection subpopulations (n=9–12/target region, twoway repeated measures ANOVA, p<0.01). (E) Inflammatory phase formalin-induced paw licking (time) with (+, colored boxes) and without (−, grey boxes) AgRP neuron stimulation of discrete projection subpopulations (paired t-tests with Bonferroni correction, all ps=ns except for PBN, p<0.001). (F) Acute phase formalin-induced paw licking (time) with (colored boxes) and without (grey boxes) AgRP neuron stimulation of discrete projection subpopulations (paired t-tests with Bonferroni correction, all ps=ns). (G) Latency to paw withdrawal from 52°C hotplate in AgRP→PBNChR2 mice (n=12, one-way ANOVA, p=ns). Data are expressed as mean ± SEM, ns p>0.05, t-tests and post-hoc comparisons: *p<0.05, **p<0.01, ***p<0.001; ANOVA interaction: ∞∞p<0.01; ANOVA main effect of group: ☼☼☼p<0.001.
Figure 6
Figure 6. Lateral PBN NPY Signaling Suppresses Inflammatory Pain
(A) Representative image of AgRP fibers terminating in the lateral PBN (lPBN) and locus coeruleus area. LC, locus coeruleus; lPBN, lateral PBN; scp, superior cerebellar peduncle. Scale bar, 500 µm. (B) Representative images of NPY (red), GAD65 (green) and AgRP (blue) immunofluorescence in AgRP→lPBN neuron boutons of ad libitum fed and 24 h food deprived mice. Scale bar, 5 µm. (C) Average intensity of NPY, GAD65, and AgRP immunofluorescence in 24 h food deprived mice (n=3 mice, 256 boutons) relative to ad libitum fed controls (n=2 mice, 366 boutons) (unpaired t-tests, ps<0.001). (D) Experimental design: lPBN microinjections were performed immediately before formalin paw injection. (E) Formalin-induced paw licking (time) in lPBN vehicle-, NPY-, GABA agonists-, and AgRP analogue-microinjected mice (n=6–8/group, two-way ANOVA, main effect of drug p<0.01). Post-hoc comparisons: *p<0.05 vehicle vs. NPY; Φp<0.05 NPY vs. AgRP analogue. (F) Inflammatory phase formalin-induced paw licking (time) in lPBN vehicle- and NPY-microinjected mice (unpaired t-test, p<0.01). (G) Acute phase formalin-induced paw licking (time) in lPBN vehicle- and NPY-microinjected mice (unpaired t-test, p=ns). (H) Formalin-induced paw licking (time) in lPBN vehicle-, Y1 receptor (Y1R) antagonist-, and GABA receptor antagonist-microinjected mice (n=6–7/group, two-way repeated measures ANOVA, p<0.001). (I) Inflammatory phase formalin-induced paw licking (time) in lPBN vehicle-and Y1R antagonist-microinjected mice (unpaired t-test, p<0.05). (J) Formalin-induced paw licking (time) in lPBN vehicle- and Y1 receptor (Y1R) antagonist-microinjected mice with AgRP→PBN neuron stimulation (n=6, two-way repeated measures ANOVA, p<0.01). (K) Inflammatory phase formalin-induced paw licking (time) in lPBN vehicle- and Y1R antagonist-microinjected mice with AgRP→PBN neuron stimulation (unpaired t-test, p<0.05). Data are expressed as mean ± SEM, ns p>0.05, t-tests and post-hoc comparisons: *p<0.05, **p<0.01, ***p<0.001; ANOVA interaction: ∞∞p<0.01, ∞∞∞p<0.001; ANOVA main effect of drug: ☼p<0.05, ☼☼p<0.01, ☼☼☼p<0.001.
Figure 7
Figure 7. Acute Pain Inhibits Feeding Behavior and Activity in AgRP Neurons
(A) Left, experimental design: latency to feed (first bite) was measured following 60 s exposure to a 52°C hotplate. Right, graph: latency to feed after 60 s exposure to either a 25°C or 52°C plate (n=8, paired t-test, p<0.01). (B) Left, experimental design: 1 h food intake was measured after formalin paw injection. Right, graph: 1 h food intake in food deprived mice after paw injection of saline or formalin (n=21, paired t-test, p=ns). (C) Left, schematic and representative image of expression of the calcium indicator GCaMP6s in AgRP neurons. Scale bar, 500 µm. Right, configuration for monitoring calcium dynamics in vivo using GCaMP6s expressed in AgRP neurons. The 490 nm excitation activates the calcium-dependent GCaMP6s signal and the 405 nm excitation activates the calcium-independent (isosbestic) GCaMP6s fluorescence. (D) Calcium-dependent (mean, dark green; SEM, green shading) and calcium-independent (mean, dark purple; SEM, purple shading) change in fluorescence (ΔF/F) in AgRP neurons following exposure to 25°C or 52°C plate (n=10). Grey shaded region indicates time exposed to hotplate. (E) Quantification of change in fluorescence (30 s time bins) in mice following exposure to 25°C or 52°C plate (n=10, two-way repeated measures ANOVA, p<0.01). (F) Calcium-dependent (mean, dark green; SEM, green shading) and calcium-independent (mean, dark purple; SEM, purple shading) change in fluorescence (ΔF/F) in AgRP neurons following saline or formalin paw injection (n=8). Dashed line indicates time of paw injection. (G) Quantification of change in fluorescence (6 min time bins) in mice following saline or formalin paw injection (n=8, two-way repeated measures ANOVA, p=ns). Data are expressed as mean ± SEM, ns p>0.05, t-tests and post-hoc comparisons: **p<0.01, ***p<0.001; ANOVA interaction: ∞∞p<0.01; ANOVA main effect of group: ☼p<0.05.

Comment in

  • Neural circuits: Balancing threats.
    Whalley K. Whalley K. Nat Rev Neurosci. 2018 May;19(5):254. doi: 10.1038/nrn.2018.35. Epub 2018 Apr 5. Nat Rev Neurosci. 2018. PMID: 29618806 No abstract available.
  • Hunger is a gatekeeper of pain in the brain.
    Ponomarenko A, Korotkova T. Ponomarenko A, et al. Nature. 2018 Apr;556(7702):445-446. doi: 10.1038/d41586-018-04759-0. Nature. 2018. PMID: 29686371 No abstract available.

References

    1. Alhadeff AL, Golub D, Hayes MR, Grill HJ. Peptide YY signaling in the lateral parabrachial nucleus increases food intake through the Y1 receptor. American journal of physiology Endocrinology and metabolism. 2015;309:E759–766. - PMC - PubMed
    1. Alhadeff AL, Holland RA, Zheng H, Rinaman L, Grill HJ, De Jonghe BC. Excitatory Hindbrain-Forebrain Communication Is Required for Cisplatin-Induced Anorexia and Weight Loss. J Neurosci. 2017;37:362–370. - PMC - PubMed
    1. Andermann ML, Lowell BB. Toward a Wiring Diagram Understanding of Appetite Control. Neuron. 2017;95:757–778. - PMC - PubMed
    1. Aponte Y, Atasoy D, Sternson SM. AGRP neurons are sufficient to orchestrate feeding behavior rapidly and without training. Nature neuroscience. 2011;14:351–355. - PMC - PubMed
    1. Atasoy D, Betley JN, Su HH, Sternson SM. Deconstruction of a neural circuit for hunger. Nature. 2012;488:172–177. - PMC - PubMed

Publication types

MeSH terms