. 2018 Mar 22;173(1):74-89.e20.
doi: 10.1016/j.cell.2018.02.008.

Impairment of an Endothelial NAD+-H2S Signaling Network Is a Reversible Cause of Vascular Aging

Affiliations

Impairment of an Endothelial NAD+-H2S Signaling Network Is a Reversible Cause of Vascular Aging

Abhirup Das et al. Cell. .

Erratum in

Abstract

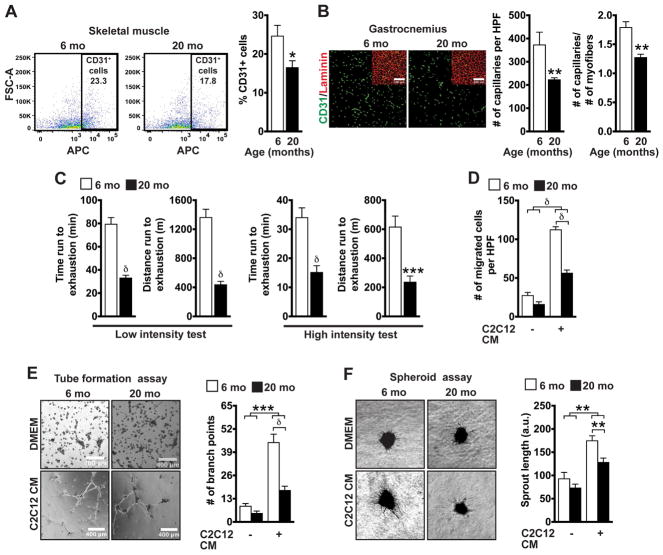
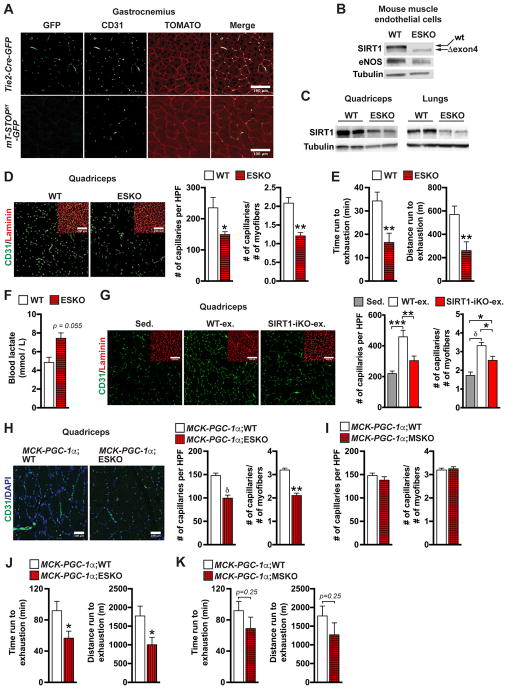
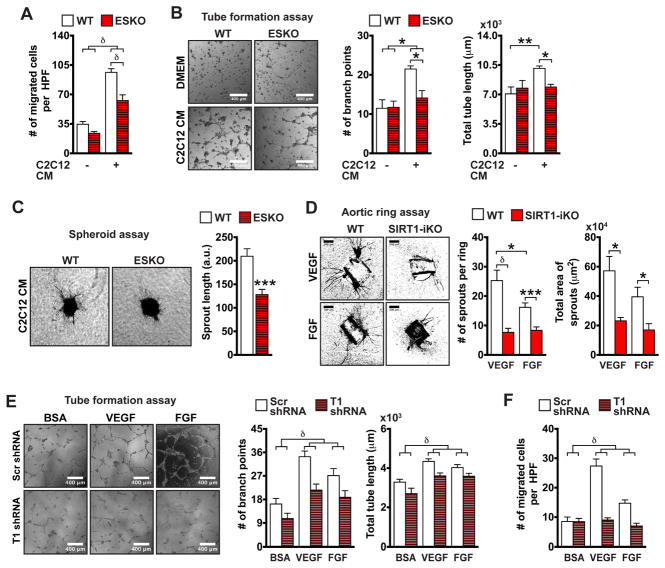
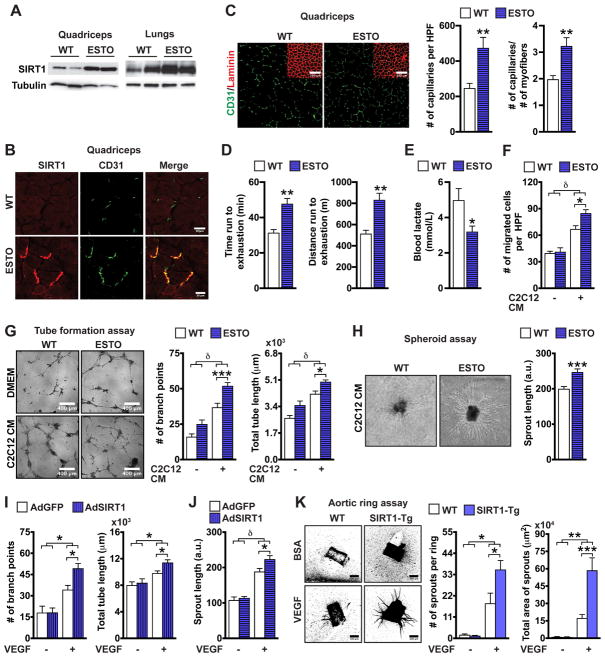
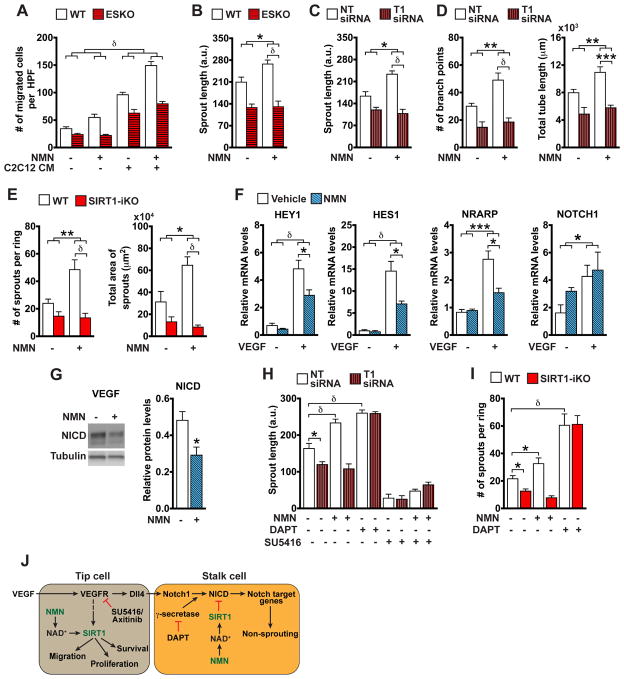
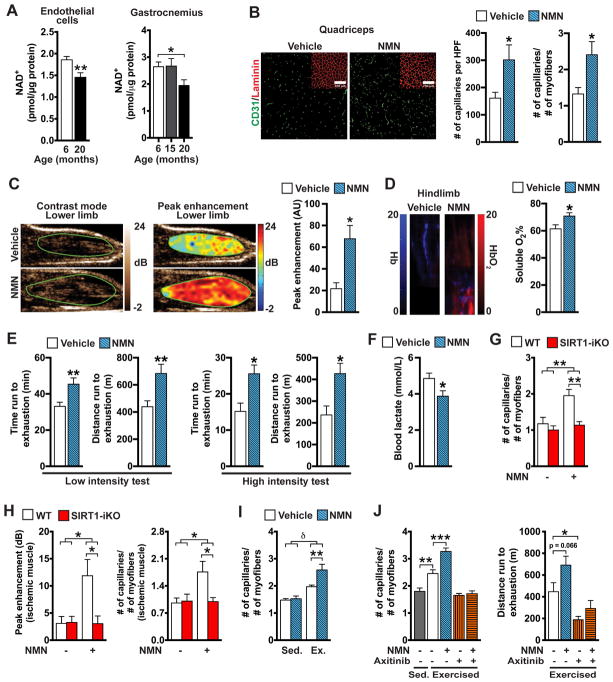
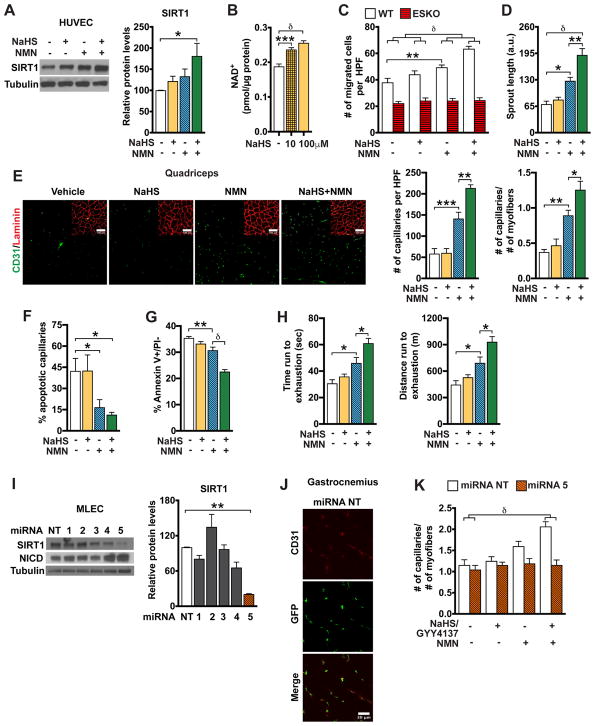
A decline in capillary density and blood flow with age is a major cause of mortality and morbidity. Understanding why this occurs is key to future gains in human health. NAD precursors reverse aspects of aging, in part, by activating sirtuin deacylases (SIRT1-SIRT7) that mediate the benefits of exercise and dietary restriction (DR). We show that SIRT1 in endothelial cells is a key mediator of pro-angiogenic signals secreted from myocytes. Treatment of mice with the NAD+ booster nicotinamide mononucleotide (NMN) improves blood flow and increases endurance in elderly mice by promoting SIRT1-dependent increases in capillary density, an effect augmented by exercise or increasing the levels of hydrogen sulfide (H2S), a DR mimetic and regulator of endothelial NAD+ levels. These findings have implications for improving blood flow to organs and tissues, increasing human performance, and reestablishing a virtuous cycle of mobility in the elderly.

Keywords: NAD(+); aging; angiogenesis; endurance; exercise; hydrogen sulfide; ischemia; nicotinamide mononucleotide; sirtuins; skeletal muscle capillaries.


Figures

Figure 1
Figure 1. Aging is associated with decreased muscle angiogenesis and endurance
(A) Flow cytometry plots and percent CD31+ ECs in skeletal muscle of young and old mice (n = 7). (B) Gastrocnemius sections (@20X) showing CD31 and laminin staining. Number of capillaries and capillary/fiber ratio per high power field (HPF) (n = 7). (C) Duration and distance run by mice until exhaustion (n = 11). (D) Number of migrated MLECs in a transwell (n = 10). (E) Images and number of branch points of tube networks formed by MLECs (n = 8). (F) Images and sprout length of MLEC spheroids (n = 10). Data expressed as mean ± SEM. *p < 0.05, **p < 0.005, ***p < 0.0005, δp < 0.00005 by Student’s t test (A–C) or two-way ANOVA with Bonferroni’s correction (D–F). See also Figure S1
Figure 2
Figure 2. Endothelial SIRT1 deletion mimics the effect of aging on capillary density and endurance
(A) Gastrocnemius sections (@40X) showing GFP, CD31 and mTOMATO protein expression. (B) SIRT1 and eNOS protein abundance in ECs isolated from skeletal muscle of WT and ESKO mice. SIRT1 exon 4 excision in ESKO results in SIRT1 band (Δ exon4) running slightly below the WT band. Tubulin serves as a loading control. (C) SIRT1 protein in lung and quadriceps. Tubulin serves as a loading control. (D) Quadriceps sections (@20X) showing CD31 and laminin staining. Number of capillaries and capillary/fiber ratio (6-month old, n = 8). (E) Duration and distance run until exhaustion in a high intensity treadmill test (6-month old, n = 8). (F) Post-exercise serum lactate levels (6-month old, n = 5). (G) Quadriceps sections (@20X) from sedentary (SIRT1-iKO + WT) and exercised mice showing CD31 and laminin staining. Number of capillaries and capillary/fiber ratio (10-month old, n = 6). (H) Quadriceps sections (@40X) showing DAPI and CD31 staining. Number of capillaries and capillary/fiber ratio (4-month old, n = 6). (I) Number of capillaries and capillary/fiber ratio in the quadriceps (4-month old, n = 6). (J) Duration and distance run until exhaustion in high intensity treadmill test (4-month old, n = 7). (K) Duration and distance run until exhaustion in high intensity treadmill test (4-month old, n = 7). Data expressed as mean ± SEM. *p < 0.05, **p < 0.005, ***p < 0.0005, δp < 0.00005 by Student’s t test (D–F and H, J, K) or one-way ANOVA with Bonferroni’s corrections (G). See also Figure S2 and Movie 1
Figure 3
Figure 3. SIRT1 is required for angiogenesis in vitro
(A) Number of migrated MLECs (n = 12). (B) Images, number of branch points and length of tube networks formed by MLECs (n = 5). (C) Images and sprout length of MLEC spheroids (n = 8). (D) Images, number and total area of microvessel sprouts in aortic rings (n = 8). (E) Images, number of branch points and length of tube networks formed by HAECs infected with lentivirus expressing scrambled (Scr) or SIRT1 (T1) shRNA (n = 8). (F) Number of migrated HAECs (n = 8). Data are expressed as mean ± SEM. *p < 0.05, **p < 0.005, ***p < 0.0005, δp < 0.00005 by Student’s t test (C), one-way (D–F) or two-way (A–B) ANOVA with Bonferroni’s corrections. See also Figure S3
Figure 4
Figure 4. Endothelial SIRT1 increases capillary density and exercise capacity
(A) SIRT1 protein abundance in quadriceps and lungs. Tubulin serves as a loading control. (B) Quadriceps sections (@60X) showing SIRT1 and CD31 expression. (C) Quadriceps sections (@20X) showing CD31 and laminin staining. Number of capillaries and capillary/fiber ratio (6-month old, n = 8). (D) Duration and distance run until exhaustion in a high intensity treadmill test (6-month old, n = 8). (E) Post-exercise blood lactate levels (n = 5). (F) Number of migrated MLECs (n = 10). (G) Images, number of branch points and length of tube networks formed by MLECs (n = 8). (H) Images and sprout length of MLEC spheroids (n = 8–9). (I) Images, number of branch points and length of tube networks formed by HUVECs infected with adenovirus expressing GFP or SIRT1 (n = 8–9). (J) Sprout length of HUVEC spheroids (n = 8). (K) Images, number and total area of microvessel sprouts in aortic rings (n = 9). Data expressed as mean ± SEM. *p < 0.05, **p < 0.005, ***p < 0.0005, δp < 0.00005 by Student’s t test (C–E and H) or two-way ANOVA with Bonferroni’s corrections (F, G and I–K). See also Figure S4 and Movie 2
Figure 5
Figure 5. Endothelial NAD+ sensitizes ECs to VEGF by suppressing Notch
(A) Number of migrated MLECs (n = 12). (B) Sprout length of MLEC spheroids (n = 8). (C) Sprout length of HAEC spheroids transfected with non-targeting (NT) or SIRT1 (T1) siRNAs (n = 8). (D) Number of branch points and length of HAEC tube networks (n = 13). (E) Number and total area of sprouts originating from aortic rings (18-month old, n = 8). (F) Relative mRNA levels of Notch target genes (HEY1, HES1 and NRARP) and NOTCH1 in HAECs stimulated with VEGF for 1 hr (n = 4). (G) Notch Intracellular Domain (NICD) protein and relative abundance in HAECs stimulated with VEGF for 5 hrs (n = 3). (H) Sprout length of VEGF-stimulated HAEC spheroids transduced with NT or T1 siRNAs (n = 8). (I) Number of sprouts in VEGF-stimulated aortic rings (18-month old, n = 8). (J) VEGF stimulation during sprouting angiogenesis upregulates expression of Dll4 ligand in the tip cells, activating Notch in the stalk cells, which triggers proteolytic cleavage of Notch receptor by γ-secretase complex to release NICD from the cell membrane so it translocates to the nucleus and induces transcription of target genes. Activation of SIRT1 by the NAD booster NMN promotes migration, proliferation and survival in VEGF-stimulated ECs. In stalk cells, NMN suppresses NICD during VEGF/Dll4 stimulation and Notch target gene activation, thereby promoting sprouting. VEGF receptor inhibitors SU5416 or axitinib block the effects of NMN on angiogenesis. Data expressed as mean ± SEM. *p < 0.05, **p < 0.005, ***p < 0.0005, δp < 0.00005 by Student’s t test (G), one-way (H and I) or two-way (A–F) ANOVA with Bonferroni’s corrections. See also Figure S5, Movie 3 and Movie 4
Figure 6
Figure 6. NAD repletion restores the microvasculature and exercise capacity of old mice
(A) NAD+ levels in MLECs (n = 6) and gastrocnemius muscles (n = 10) isolated from 6 and 20-month old mice. (B) Quadriceps sections (@20X) from 20-month old vehicle or NMN-treated mice showing CD31 and laminin staining. Number of capillaries and capillary/myofiber ratio (n = 8). (C) Contrast-mode and peak enhancement-mode contrast-enhanced ultrasound images of mouse hindlimb. Quantification of peak enhancement (20-month old, n = 5). (D) Total hemoglobin (Hb) and oxygenated Hb (HbO2) mean intensity in the hindlimbs of mice measured using photoacoustics tomography. Percent soluble O2 levels (n = 13). (E) Duration and distance run until exhaustion (20-month old, n = 13). (F) Post-exercise blood lactate levels (20-month old, n = 13). (G) Capillary/myofiber ratio in gastrocnemius sections (20-month old, n = 5). (H) Peak enhancement and capillary/myofiber ratio for ischemic hindlimbs (8-month old, n = 5). (I) Capillary/myofiber ratio in quadriceps of sedentary or exercised mice (10-month old, n = 5). (J) Capillary/myofiber ratio in quadriceps (5-month old, n = 5). Distance run until exhaustion at the end of the exercise paradigm (n = 5). Data are expressed as mean ± SEM. *p < 0.05, **p < 0.005, ***p < 0.0005, δp < 0.00005 by Student’s t test (A–F), one-way (J) or two-way (G–I) ANOVA with Bonferroni’s corrections. See also Figure S6 and Movie 5
Figure 7
Figure 7. Exogenous hydrogen sulfide activates SIRT1 and augments the effects of NMN
(A) SIRT1 protein and relative abundance in HUVECs treated for 24 hrs (n = 4). (B) NAD+ levels in HUVECs treated for 24 hrs (n = 6). (C) Number of migrated MLECs stimulated with C2C12 CM for 12 hrs (n=15). (D) Sprout length of VEGF-stimulated HUVEC spheroids (n = 7). (E) Quadriceps sections (@20X) showing CD31 and laminin staining. Capillary number and capillary/myofiber ratio (32-month old, n = 7). (F) Percent TUNEL+ capillaries in quadriceps sections (32-month old, n = 5). (G) Number of apoptotic HUVECs (Annexin V+/PI−) following exposure to H2O2 (n = 12). (H) Duration and distance run until exhaustion in a low intensity treadmill test (32-month old, n = 7). (I) SIRT1 and NICD proteins in MLECs transduced with lentiviruses expressing NT or SIRT1 miRNAs (miRNA # 1–5). Relative SIRT1 protein abundance (n = 3). (J) Images of gastrocnemius sections (@40X) immunostained with EGFP and CD31 from WT mice injected with lentiviral particles that transduced EGFP and NT miRNA. (K) Capillary/myofiber ratio in the gastrocnemii of mice infected with lentiviral particles transducing NT or SIRT1 # 5 miRNA (n = 6). Data are expressed as mean ± SEM. *p < 0.05, **p < 0.005, ***p < 0.0005, δp < 0.00005 by Student’s t test (I), one-way (A–B and D–H) or two-way (C and K) ANOVA with Bonferroni’s corrections. See also Figure S7 and Table S1

Comment in

References

    1. Arany Z, Foo SY, Ma Y, Ruas JL, Bommi-Reddy A, Girnun G, Cooper M, Laznik D, Chinsomboon J, Rangwala SM, et al. HIF-independent regulation of VEGF and angiogenesis by the transcriptional coactivator PGC-1alpha. Nature. 2008;451:1008–1012. - PubMed
    1. Bai P, Canto C, Brunyanszki A, Huber A, Szanto M, Cen Y, Yamamoto H, Houten SM, Kiss B, Oudart H, et al. PARP-2 regulates SIRT1 expression and whole-body energy expenditure. Cell Metab. 2011a;13:450–460. - PMC - PubMed
    1. Bai P, Canto C, Oudart H, Brunyanszki A, Cen Y, Thomas C, Yamamoto H, Huber A, Kiss B, Houtkooper RH, et al. PARP-1 inhibition increases mitochondrial metabolism through SIRT1 activation. Cell Metab. 2011b;13:461–468. - PMC - PubMed
    1. Baker M, Robinson SD, Lechertier T, Barber PR, Tavora B, D’Amico G, Jones DT, Vojnovic B, Hodivala-Dilke K. Use of the mouse aortic ring assay to study angiogenesis. Nat Protoc. 2012;7:89–104. - PubMed
    1. Baltgalvis KA, White K, Li W, Claypool MD, Lang W, Alcantara R, Singh BK, Friera AM, McLaughlin J, Hansen D, et al. Exercise performance and peripheral vascular insufficiency improve with AMPK activation in high-fat diet-fed mice. Am J Physiol Heart Circ Physiol. 2014;306:H1128–1145. - PMC - PubMed

Publication types

MeSH terms