

Grape proanthocyanidin-induced intestinal bloom of Akkermansia muciniphila is dependent on its baseline abundance and precedes activation of host genes related to metabolic health
- PMID: 29571008
- PMCID: PMC5971143
- DOI: 10.1016/j.jnutbio.2018.02.009
Grape proanthocyanidin-induced intestinal bloom of Akkermansia muciniphila is dependent on its baseline abundance and precedes activation of host genes related to metabolic health
Abstract
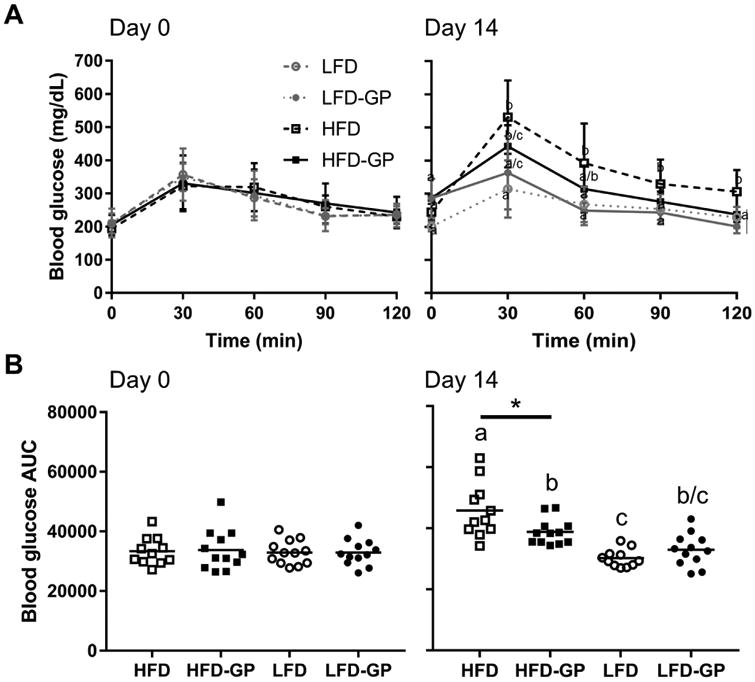
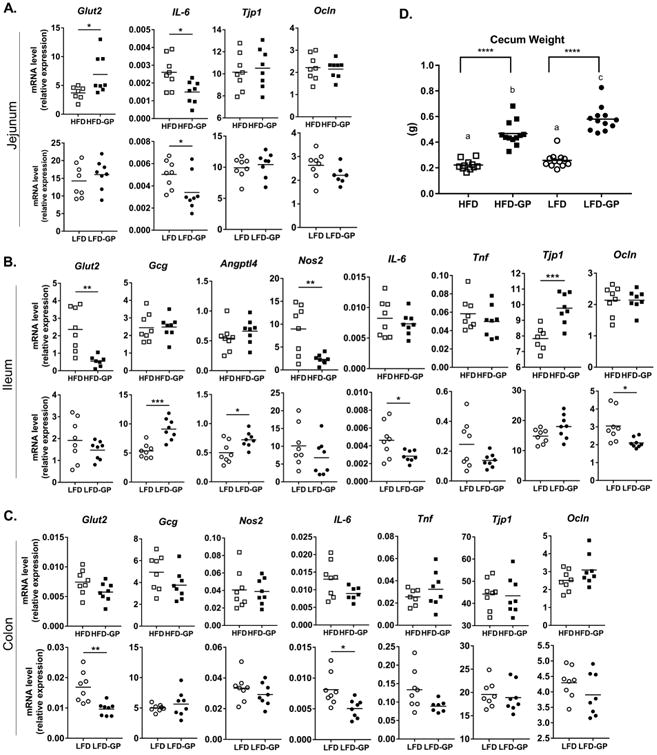
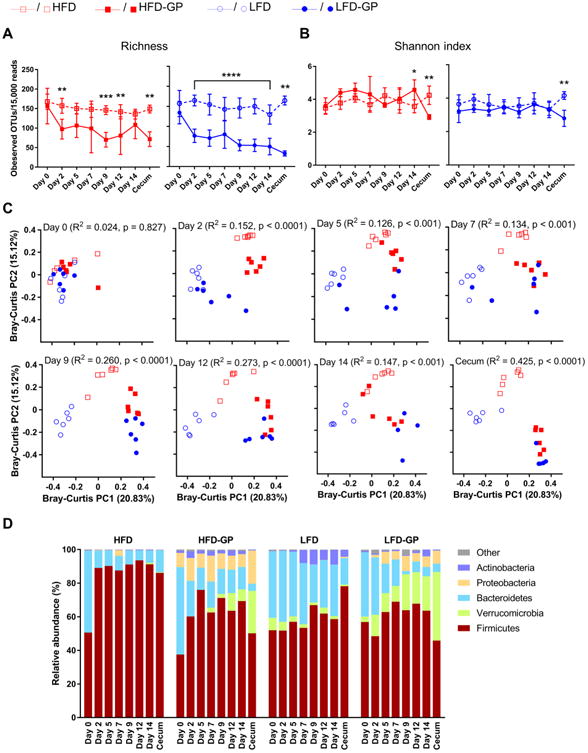
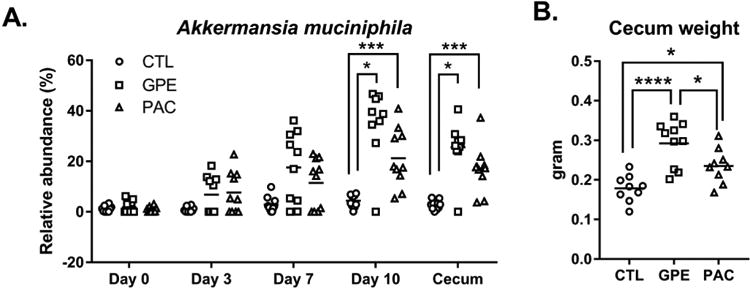
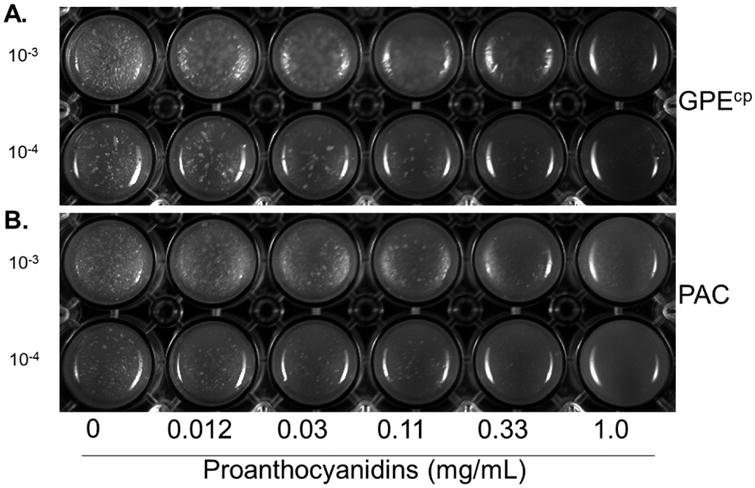
We previously showed that C57BL/6J mice fed high-fat diet (HFD) supplemented with 1% grape polyphenols (GP) for 12 weeks developed a bloom of Akkermansia muciniphila with attenuated metabolic syndrome symptoms. Here we investigated early timing of GP-induced effects and the responsible class of grape polyphenols. Mice were fed HFD, low-fat diet (LFD) or formulations supplemented with GP (HFD-GP, LFD-GP) for 14 days. Mice fed HFD-GP, but not LFD-GP, showed improved oral glucose tolerance compared to controls. A. muciniphila bloom occurred earlier in mice fed LFD-GP than HFD-GP; however, timing was dependent on baseline A. muciniphila levels rather than dietary fat. Mice gavaged for 10 days with GP extract (GPE) or grape proanthocyanidins (PACs), each delivering 360 mg PACs/kg body weight, induced a bloom of fecal and cecal A. muciniphila, the rate of which depended on initial A. muciniphila abundance. Grape PACs were sufficient to induce a bloom of A. muciniphila independent of specific intestinal gene expression changes. Gut microbial community analysis and in vitro inhibition of A. muciniphila by GPE or PACs suggest that the A. muciniphila bloom in vivo occurs via indirect mechanisms.
Keywords: Akkermansia; Grape; Gut; Microbes; Polyphenols; Proanthocyanidins.
Copyright © 2018 Elsevier Inc. All rights reserved.
Figures
Similar articles
-
Grape polyphenols reduce gut-localized reactive oxygen species associated with the development of metabolic syndrome in mice.PLoS One. 2018 Oct 11;13(10):e0198716. doi: 10.1371/journal.pone.0198716. eCollection 2018. PLoS One. 2018. PMID: 30308002 Free PMC article.
-
Impact of grape polyphenols on Akkermansia muciniphila and the gut barrier.AIMS Microbiol. 2022 Dec 22;8(4):544-565. doi: 10.3934/microbiol.2022035. eCollection 2022. AIMS Microbiol. 2022. PMID: 36694591 Free PMC article.
-
Dietary Polyphenols Promote Growth of the Gut Bacterium Akkermansia muciniphila and Attenuate High-Fat Diet-Induced Metabolic Syndrome.Diabetes. 2015 Aug;64(8):2847-58. doi: 10.2337/db14-1916. Epub 2015 Apr 6. Diabetes. 2015. PMID: 25845659 Free PMC article.
-
Polyphenols as Drivers of a Homeostatic Gut Microecology and Immuno-Metabolic Traits of Akkermansia muciniphila: From Mouse to Man.Int J Mol Sci. 2022 Dec 20;24(1):45. doi: 10.3390/ijms24010045. Int J Mol Sci. 2022. PMID: 36613488 Free PMC article. Review.
-
Akkermansia muciniphila and its role in regulating host functions.Microb Pathog. 2017 May;106:171-181. doi: 10.1016/j.micpath.2016.02.005. Epub 2016 Feb 11. Microb Pathog. 2017. PMID: 26875998 Review.
Cited by
-
The Gastrointestinal Tract as Prime Site for Cardiometabolic Protection by Dietary Polyphenols.Adv Nutr. 2019 Nov 1;10(6):999-1011. doi: 10.1093/advances/nmz038. Adv Nutr. 2019. PMID: 31144710 Free PMC article. Review.
-
Grape polyphenols reduce gut-localized reactive oxygen species associated with the development of metabolic syndrome in mice.PLoS One. 2018 Oct 11;13(10):e0198716. doi: 10.1371/journal.pone.0198716. eCollection 2018. PLoS One. 2018. PMID: 30308002 Free PMC article.
-
Health and Disease: Akkermansia muciniphila, the Shining Star of the Gut Flora.Research (Wash D C). 2023;6:0107. doi: 10.34133/research.0107. Epub 2023 Apr 3. Research (Wash D C). 2023. PMID: 37040299 Free PMC article.
-
Berries in Microbiome-Mediated Gastrointestinal, Metabolic, and Immune Health.Curr Nutr Rep. 2023 Mar;12(1):151-166. doi: 10.1007/s13668-023-00449-0. Epub 2023 Feb 4. Curr Nutr Rep. 2023. PMID: 36738429 Review.
-
Chitosan Oligosaccharide Ameliorates Metabolic Syndrome Induced by Overnutrition via Altering Intestinal Microbiota.Front Nutr. 2021 Oct 1;8:743492. doi: 10.3389/fnut.2021.743492. eCollection 2021. Front Nutr. 2021. PMID: 34660667 Free PMC article.
References
-
- IDF Diabetes Atlas. 7. International Diabetes Foundation; Brussels, Belgium: 2015.
-
- Visioli F, De La Lastra CA, Andres-Lacueva C, Aviram M, Calhau C, Cassano A, et al. Polyphenols and human health: a prospectus. Crit Rev Food Sci Nutr. 2011;51:524–46. - PubMed
-
- Felgines C, Krisa S, Mauray A, Besson C, Lamaison JL, Scalbert A, et al. Radiolabelled cyanidin 3-O-glucoside is poorly absorbed in the mouse. Br J Nutr. 2010;103:1738–45. - PubMed
Publication types
MeSH terms
Substances
Grants and funding
LinkOut - more resources
Full Text Sources
Other Literature Sources
Molecular Biology Databases
