. 2018 May 17;84(11):e02637-17.
doi: 10.1128/AEM.02637-17. Print 2018 Jun 1.

Assessment of Passive Traps Combined with High-Throughput Sequencing To Study Airborne Fungal Communities

Affiliations

Assessment of Passive Traps Combined with High-Throughput Sequencing To Study Airborne Fungal Communities

Jaime Aguayo et al. Appl Environ Microbiol. .

Abstract

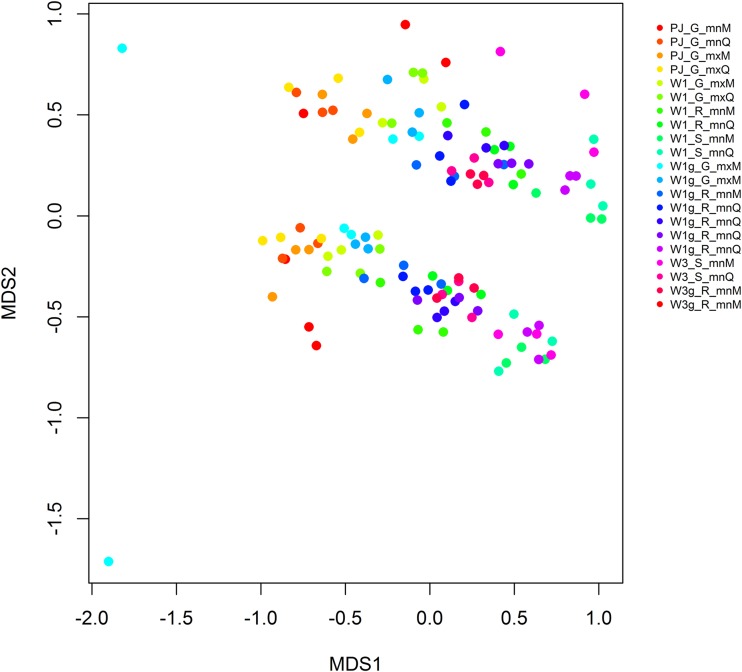
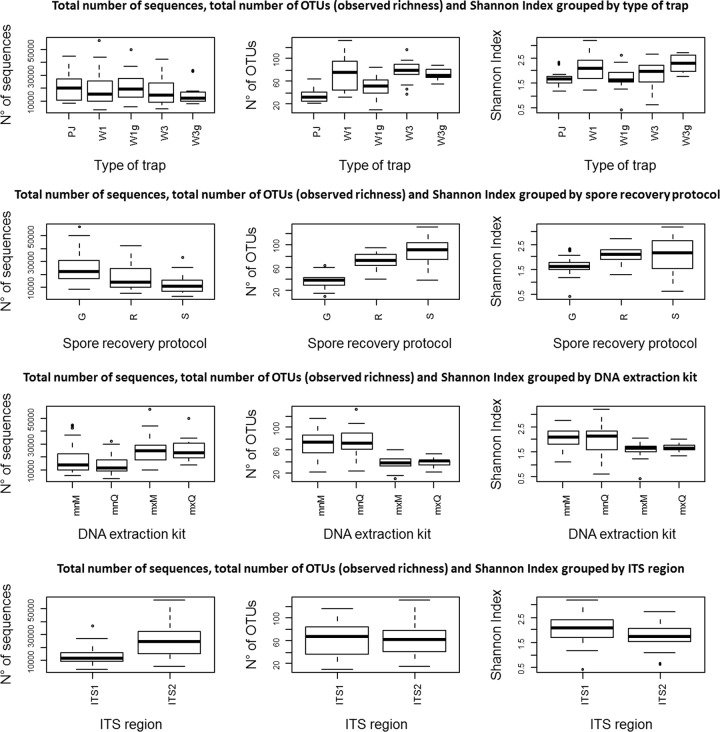
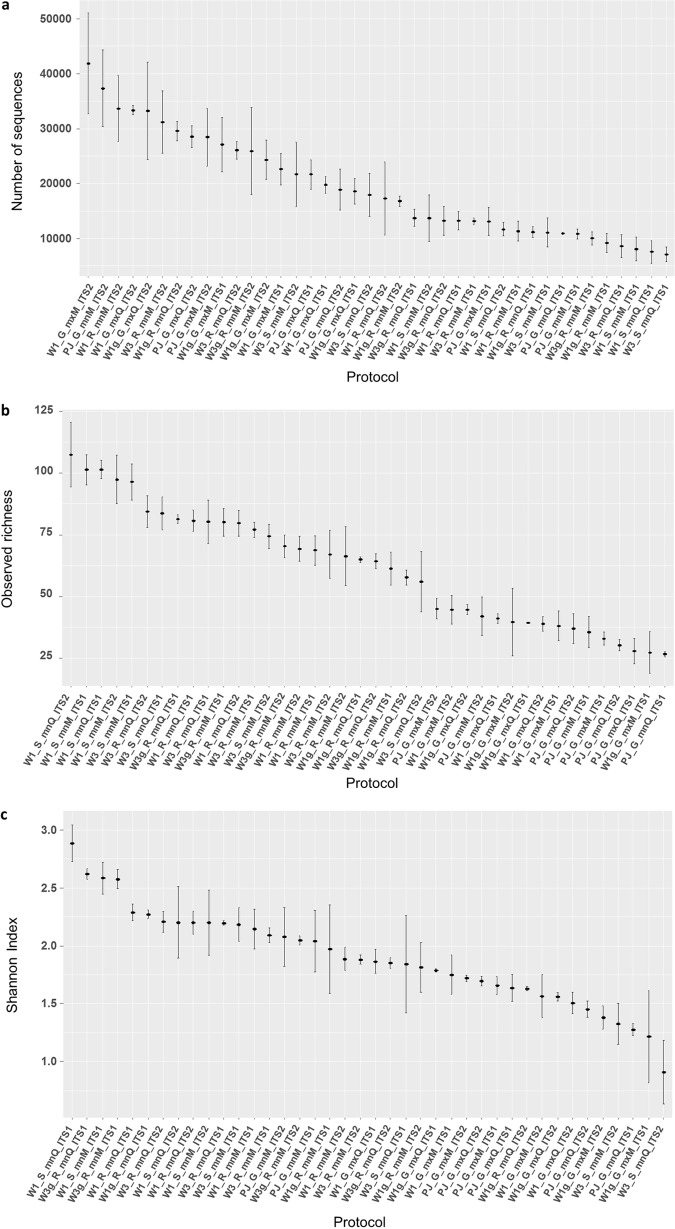
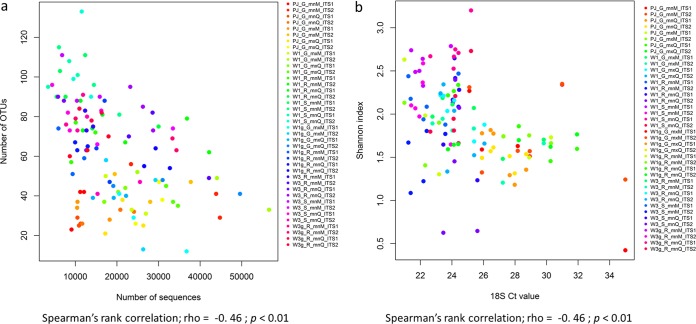
Techniques based on high-throughput sequencing (HTS) of environmental DNA have provided a new way of studying fungal diversity. However, these techniques suffer from a number of methodological biases which may appear at any of the steps involved in a metabarcoding study. Air is one of the most important environments where fungi can be found, because it is the primary medium of dispersal for many species. Looking ahead to future developments, it was decided to test 20 protocols, including different passive spore traps, spore recovery procedures, DNA extraction kits, and barcode loci. HTS was performed with the Illumina MiSeq platform targeting two subloci of the fungal internal transcribed spacer. Multivariate analysis and generalized linear models showed that the type of passive spore trap, the spore recovery procedure, and the barcode all impact the description of fungal communities in terms of richness and diversity when assessed by HTS metabarcoding. In contrast, DNA extraction kits did not significantly impact these results. Although passive traps may be used to describe airborne fungal communities, a study using specific real-time PCR and a mock community showed that these kinds of traps are affected by environmental conditions that may induce losses of biological material, impacting diversity and community composition results.IMPORTANCE The advent of high-throughput sequencing (HTS) methods, such as those offered by next-generation sequencing (NGS) techniques, has opened a new era in the study of fungal diversity in different environmental substrates. In this study, we show that an assessment of the diversity of airborne fungal communities can reliably be achieved by the use of simple and robust passive spore traps. However, a comparison of sample processing protocols showed that several methodological biases may impact the results of fungal diversity when assessed by metabarcoding. Our data suggest that identifying these biases is of paramount importance to enable a correct identification and relative quantification of community members.

Keywords: aerobiology; fungal dispersion; fungal diversity; metabarcoding.


Figures

FIG 1
FIG 1
NMDS representation of all the exposed trap protocols. A protocol was the combination of the type of trap, the spore recovery procedure, the DNA extraction kit, and the ITS barcode. All samples were replicated three times. The NMDS showed acceptable values for stress (0.16) and linear fit (R2 = 0.89). The codes indicate the technical procedures used in this paper. For type of trap: PJ, petri dish coated with a mix of petroleum jelly and Vaseline; W1, Whatman filter no. 1; W1g, Whatman filter no. 1 sprayed with a sticky layer; W3, Whatman filter no. 3; W3g, Whatman filter no. 3 sprayed with a sticky layer. For spore recovery protocol: G, grinding; R, rubbing; S, shaking. For DNA extraction kit: mnM, NucleoSpin plant II kit; mnQ, DNeasy plant minikit; mxM, NucleoSpin plant II maxikit; mxQ, DNeasy plant maxikit.
FIG 2
FIG 2
Box plots representing comparisons between presequencing and sequencing technical choices: type of trap, spore recovery procedure, DNA extraction kit, and ITS subloci versus the total number of sequences, observed richness, and Shannon index. Whiskers indicate variability outside the upper and lower quantities, while outliers are represented by individual points.
FIG 3
FIG 3
Graphical representation of the mean and standard deviation by protocol in terms the total number of sequences (a), observed richness (b), and the Shannon-Wiener index (c). Means and standard deviations were computed for three replicates per protocol. The observed richness and Shannon-Wiener index values were computed after rarefaction to the smallest number of sequences per sample as a threshold.
FIG 4
FIG 4
Correlation between the total number of sequences and the total number of OTUs (a) and the Shannon index (b). Each color represents the three replicates of each of the samples. The codes indicate the technical procedures used in this paper. For type of trap: PJ, petri dish coated with a mix of petroleum jelly and Vaseline; W1, Whatman filter no. 1; W1g, Whatman filter no. 1 sprayed with a sticky layer; W3, Whatman filter no. 3; W3g, Whatman filter no. 3 sprayed with a sticky layer. For spore recovery protocol: G, grinding; R, rubbing; S, shaking. For DNA extraction kit: mnM, NucleoSpin plant II kit; mnQ, DNeasy plant minikit; mxM, NucleoSpin plant II maxikit; mxQ, DNeasy plant maxikit.
FIG 5
FIG 5
Plots showing the correlation between the DNA quantity measured by the cycle threshold (CT) generated by qPCR, a universal primer/barcode test targeting the 18S of plants and fungi, and the number of OTUs (a) and the total number of sequences (b). Each color represents the three replicates of each of the samples. The codes indicate the technical procedures used in this paper. For type of trap: PJ, petri dish coated with a mix of petroleum jelly and Vaseline; W1, Whatman filter no. 1; W1g, Whatman filter no. 1 sprayed with a sticky layer; W3, Whatman filter no. 3; W3g, Whatman filter no. 3 sprayed with a sticky layer. For spore recovery protocol: G, grinding; R, rubbing; S, shaking. For DNA extraction kit: mnM, NucleoSpin plant II kit; mnQ, DNeasy plant minikit; mxM, NucleoSpin plant II maxikit; mxQ, DNeasy plant maxikit.

References

    1. Blackwell M. 2011. The fungi: 1, 2, 3 … 5.1 million species? Am J Bot 98:426–438. doi:10.3732/ajb.1000298. - DOI - PubMed
    1. Desprez-Loustau M-L, Aguayo J, Dutech C, Hayden KJ, Husson C, Jakushkin B, Marçais B, Piou D, Robin C, Vacher C. 2016. An evolutionary ecology perspective to address forest pathology challenges of today and tomorrow. Ann Forest Sci 73:45–67. doi:10.1007/s13595-015-0487-4. - DOI
    1. Halme P, Heilmann-Clausen J, Rämä T, Kosonen T, Kunttu P. 2012. Monitoring fungal biodiversity–towards an integrated approach. Fungal Ecol 5:750–758. doi:10.1016/j.funeco.2012.05.005. - DOI
    1. Lindahl BD, Nilsson RH, Tedersoo L, Abarenkov K, Carlsen T, Kjøller R, Kõljalg U, Pennanen T, Rosendahl S, Stenlid J, Kauserud H. 2013. Fungal community analysis by high-throughput sequencing of amplified markers – a user's guide. New Phytol 199:288–299. doi:10.1111/nph.12243. - DOI - PMC - PubMed
    1. Bálint M, Schmidt P-A, Sharma R, Thines M, Schmitt I. 2014. An Illumina metabarcoding pipeline for fungi. Ecol Evol 4:2642–2653. doi:10.1002/ece3.1107. - DOI - PMC - PubMed

Publication types

LinkOut - more resources