. 2018 Mar 1;32(5-6):347-358.
doi: 10.1101/gad.312397.118. Epub 2018 Mar 23.

Clock-dependent chromatin topology modulates circadian transcription and behavior

Affiliations

Clock-dependent chromatin topology modulates circadian transcription and behavior

Jérôme Mermet et al. Genes Dev. .

Abstract

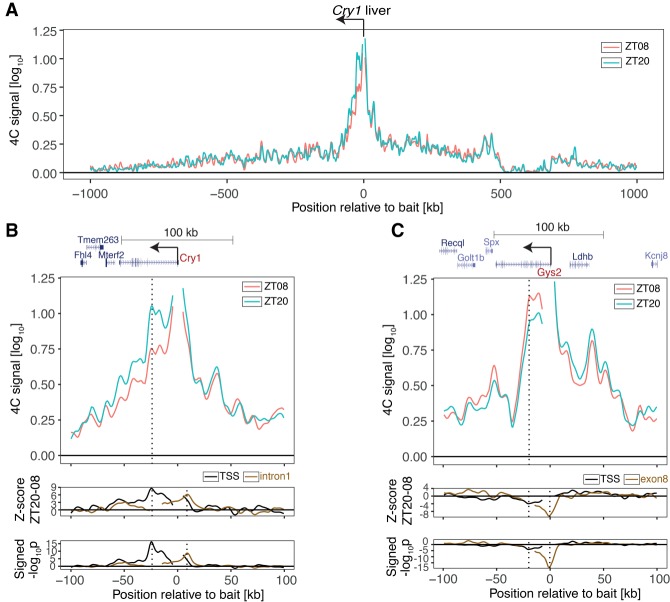
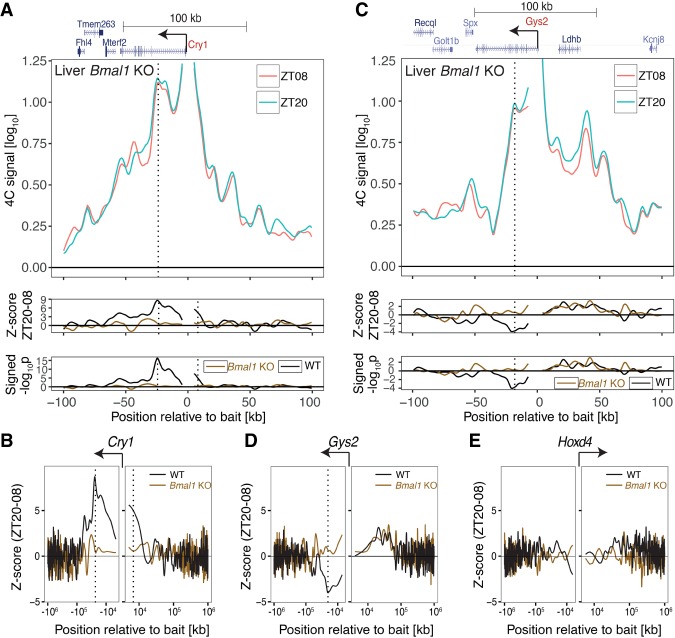
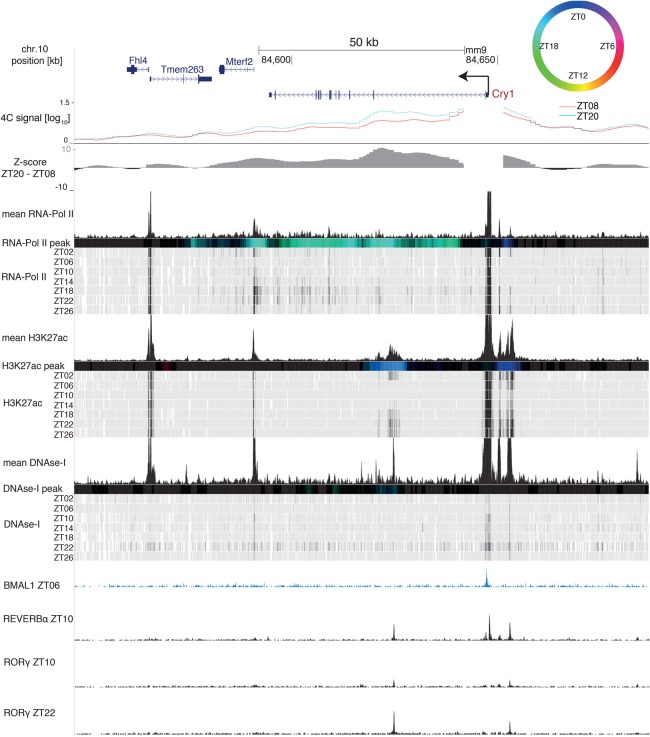
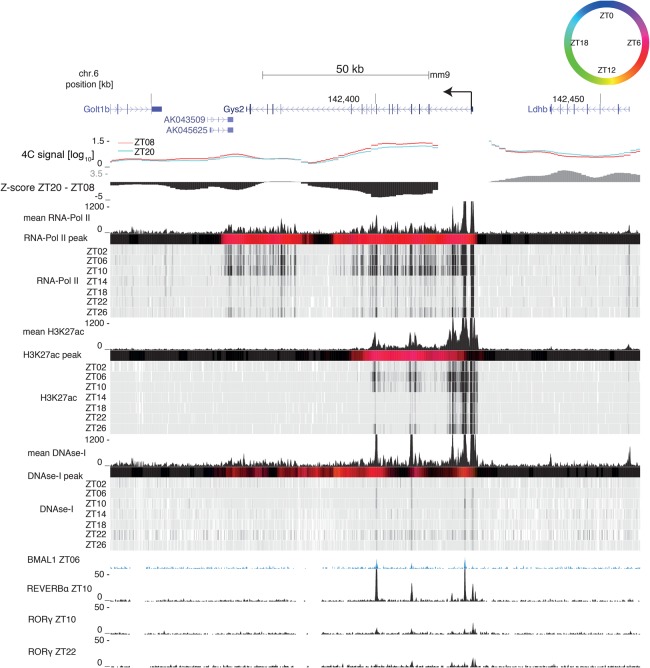
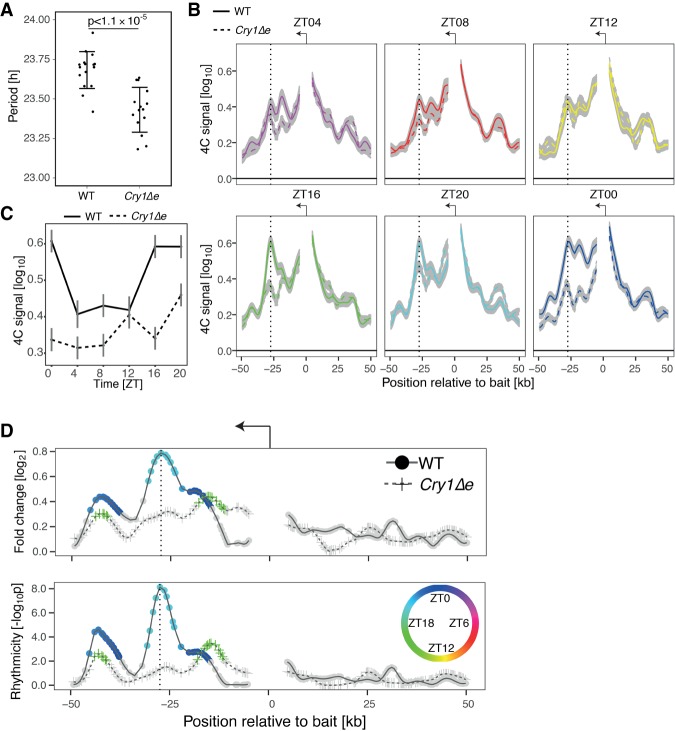
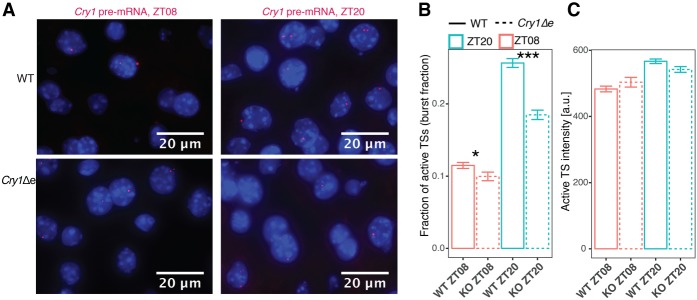
The circadian clock in animals orchestrates widespread oscillatory gene expression programs, which underlie 24-h rhythms in behavior and physiology. Several studies have shown the possible roles of transcription factors and chromatin marks in controlling cyclic gene expression. However, how daily active enhancers modulate rhythmic gene transcription in mammalian tissues is not known. Using circular chromosome conformation capture (4C) combined with sequencing (4C-seq), we discovered oscillatory promoter-enhancer interactions along the 24-h cycle in the mouse liver and kidney. Rhythms in chromatin interactions were abolished in arrhythmic Bmal1 knockout mice. Deleting a contacted intronic enhancer element in the Cryptochrome 1 (Cry1) gene was sufficient to compromise the rhythmic chromatin contacts in tissues. Moreover, the deletion reduced the daily dynamics of Cry1 transcriptional burst frequency and, remarkably, shortened the circadian period of locomotor activity rhythms. Our results establish oscillating and clock-controlled promoter-enhancer looping as a regulatory layer underlying circadian transcription and behavior.

Keywords: DNA regulatory elements; chromatin topology; circadian rhythms; promoter–enhancer loops; transcriptional bursting.


Figures

Figure 1.
Figure 1.
Rhythmic chromatin interactions in mouse livers. (A) 4C-seq data (LWMR summarizes n = 4 animals per group) in a 2-Mb genomic region surrounding Cry1 at ZT08 and ZT20. (B) 4C-seq signals in a 200-kb genomic region surrounding Cry1 at ZT08 and ZT20. (Bottom tracks) Z-score and signed −log10(p) show rhythmic contacts between the promoter region and the intronic region. (Black) Cry1 TSS bait (P < 10−16 at peak); (brown) Cry1 intron1 bait (P < 10−8 at peak). (C) Same as B, targeting the Gys2 promoter. (Bottom tracks) Same as B for Gys2 TSS bait (P < 10−4 at peak). (Brown) Gys2 exon8 bait (P < 10−18 at peak). Vertical dotted lines show the positions locally of maximal differential chromatin interactions.
Figure 2.
Figure 2.
The dynamics of chromatin topology depend on BMAL1. (A, top) 4C-seq signal targeting Cry1 from the livers of Bmal1 knockout mice at ZT20 versus ZT08 shows loss of rhythms in chromatin interactions. (Bottom) Z-score and signed −log10(p) of differential 4C-seq signal (ZT20–ZT08) in wild-type versus Bmal1 knockout. Vertical lines show BMAL1-dependent rhythmic contacts. (B) Z-score in a 2-Mb genomic region surrounding Cry1 in wild-type versus Bmal1 knockout. (C) Same as in A but for Gys2 bait. (D,E) Same as in B but for Gys2 (D) and Hoxd4 (E) baits. B and D show that the BMAL1-dependent rhythmic contacts are localized within 100 kb of the bait.
Figure 3.
Figure 3.
The rhythmic Cry1 loop connects the promoter with a H3K27ac-marked enhancer. The Cry1 genomic region containing 4C-seq signals from Cry1 TSS at ZT08 (red) and ZT20 (blue) and Z-score (ZT20–ZT08) in wild-type livers. RNA Pol II loadings (ChIP-seq), H3K27ac mark (ChIP-seq), and DNase-I signal are from Sobel et al. (2017). Temporally averaged signals and temporal signals of each mark are plotted. Colored bars represent peak times according to the color legend at the top right; black signifies no rhythm (Materials and Methods). BMAL1 ChIP-seq signal is from Rey et al. (2011), and REV-ERBα and RORγ ChIP-seq signals are from Zhang et al. (2015).
Figure 4.
Figure 4.
The rhythmic Gys2 loop connects the promoter with a H3K27ac-marked enhancer. The Gys2 genomic region containing 4C-seq signals from the Gys2 TSS at ZT08 (red) and ZT20 (blue) and Z-score (ZT20–ZT08) in wild-type livers. RNA Pol II loadings (ChIP-seq), H3K27ac mark (ChIP-seq), and DNase-I signal are from Sobel et al. (2017). Temporally averaged signals and temporal signals of each mark are plotted. Colored bars represent peak times according to the color legend at the top right; black signifies no rhythm (Materials and Methods). The BMAL1 ChIP-seq signal is from Rey et al. (2011), and the REV-ERBα and RORγ ChIP-seq signals are from Zhang et al. (2015).
Figure 5.
Figure 5.
Deleting the Cry1 intronic enhancer in mice shortens the period of the clock and disrupts oscillations in Cry1 promoter–enhancer contact frequencies. (A) The circadian period of spontaneous locomotor activity is significantly different between Cry1Δe and wild-type littermates. The mean period and standard deviation were calculated from 16 wild-type and 15 Cry1Δe littermates. P = 1.1 × 10⁻⁵, t-test. (B) 4C-seq signal for Cry1 TSS bait over time in livers (LWMR summarizes n = 3 animals per group; gray shade shows ±standard error) in wild-type versus Cry1Δe littermates. Vertical lines show the +26-kb intronic enhancer. (C) 4C-seq signal over time adjacent to the intronic enhancer. (D) log2 fold change and −log10(p) from rhythmicity analysis of 4C-seq signal over time. P < 10−8 at peak, LWMR, χ2 test. Fragments with P< 0.01 are colored by time of peak contact frequency (color legend is shown at the right).
Figure 6.
Figure 6.
The oscillatory Cry1 promoter–enhancer loop modulates Cry1 transcriptional bursting. (A) smRNA-FISH against Cry1 pre-mRNA in the livers of wild-type (top) and Cry1Δe (bottom) animals at ZT08 (left) and ZT20 (right). Burst fractions (B) and burst intensities (C) measured from images of smRNA-FISH performed against Cry1 pre-mRNA in Cry1Δe (dashed) and wild-type (solid) livers at ZT08 (red) and ZT20 (blue). Burst fraction is the number of active transcription sites in each nucleus divided by the ploidy. (B,C) Shown are the means and standard errors over nuclei collected and pooled from two animals in each of the four conditions (individual animals are analyzed in Supplemental Fig. S9C,D). n = 2191 wild-type ZT08 nuclei; n = 983 Cry1Δe ZT08 nuclei; n = 2150 wild-type ZT20 nuclei; n = 1473 Cry1Δe ZT20 nuclei. In B, (*) P < 0.05; (***) P < 0.001, t-test. In C, differences between genotypes are not significant.

References

    1. Aguilar-Arnal L, Hakim O, Patel VR, Baldi P, Hager GL, Sassone-Corsi P. 2013. Cycles in spatial and temporal chromosomal organization driven by the circadian clock. Nat Struct Mol Biol 20: 1206–1213. - PMC - PubMed
    1. Allebrandt KV, Teder-Laving M, Akyol M, Pichler I, Muller-Myhsok B, Pramstaller P, Merrow M, Meitinger T, Metspalu A, Roenneberg T. 2010. CLOCK gene variants associate with sleep duration in two independent populations. Biol Psychiatry 67: 1040–1047. - PubMed
    1. Aschoff J, Pohl H. 1978. Phase relations between a circadian-rhythm and its Zeitgeber within range of entrainment. Naturwissenschaften 65: 80–84. - PubMed
    1. Atger F, Gobet C, Marquis J, Martin E, Wang J, Weger B, Lefebvre G, Descombes P, Naef F, Gachon F. 2015. Circadian and feeding rhythms differentially affect rhythmic mRNA transcription and translation in mouse liver. Proc Natl Acad Sci 112: E6579–E6588. - PMC - PubMed
    1. Bahar Halpern K, Tanami S, Landen S, Chapal M, Szlak L, Hutzler A, Nizhberg A, Itzkovitz S. 2015. Bursty gene expression in the intact mammalian liver. Mol Cell 58: 147–156. - PMC - PubMed

Publication types

LinkOut - more resources