

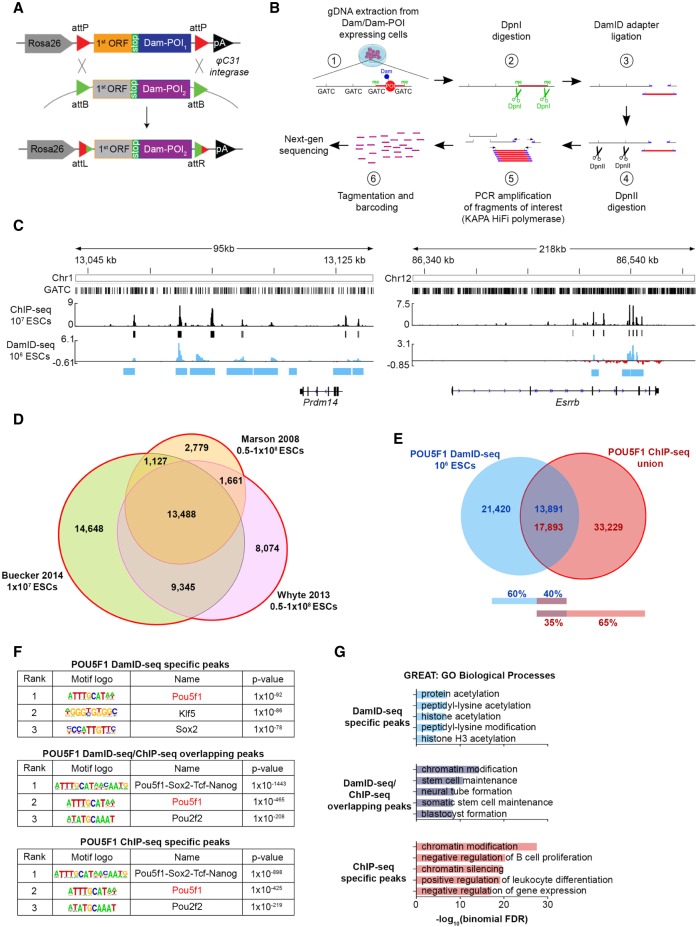
Mapping transcription factor occupancy using minimal numbers of cells in vitro and in vivo
- PMID: 29572359
- PMCID: PMC5880248
- DOI: 10.1101/gr.227124.117
Mapping transcription factor occupancy using minimal numbers of cells in vitro and in vivo
Abstract
The identification of transcription factor (TF) binding sites in the genome is critical to understanding gene regulatory networks (GRNs). While ChIP-seq is commonly used to identify TF targets, it requires specific ChIP-grade antibodies and high cell numbers, often limiting its applicability.
© 2018 Tosti et al.; Published by Cold Spring Harbor Laboratory Press.
Figures


References
-
- Aires R, Jurberg AD, Leal F, Nóvoa A, Cohn MJ, Mallo M. 2016. Oct4 is a key regulator of vertebrate trunk length diversity. Dev Cell 38: 262–274. - PubMed
-
- Barski A, Cuddapah S, Cui K, Roh T-Y, Schones DE, Wang Z, Wei G, Chepelev I, Zhao K. 2007. High-resolution profiling of histone methylations in the human genome. Cell 129: 823–837. - PubMed
Publication types
MeSH terms
Substances
Grants and funding
LinkOut - more resources
Full Text Sources
Other Literature Sources
Molecular Biology Databases
Miscellaneous