. 2018 May 7;215(5):1417-1435.
doi: 10.1084/jem.20171784. Epub 2018 Mar 23.

Altered compensatory cytokine signaling underlies the discrepancy between Flt3-/- and Flt3l-/- mice

Affiliations

Altered compensatory cytokine signaling underlies the discrepancy between Flt3-/- and Flt3l-/- mice

Vivek Durai et al. J Exp Med. .

Abstract

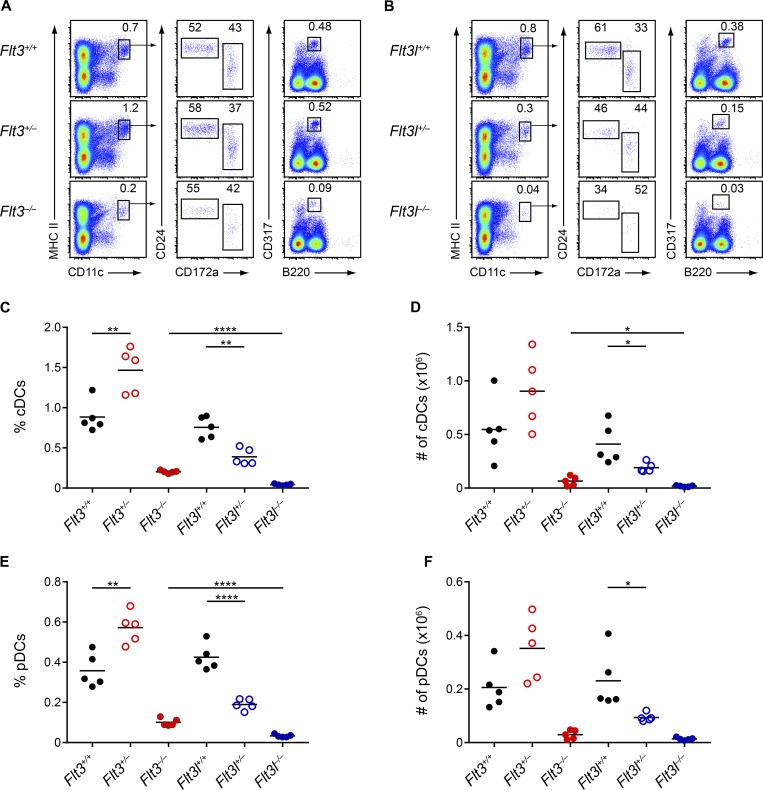
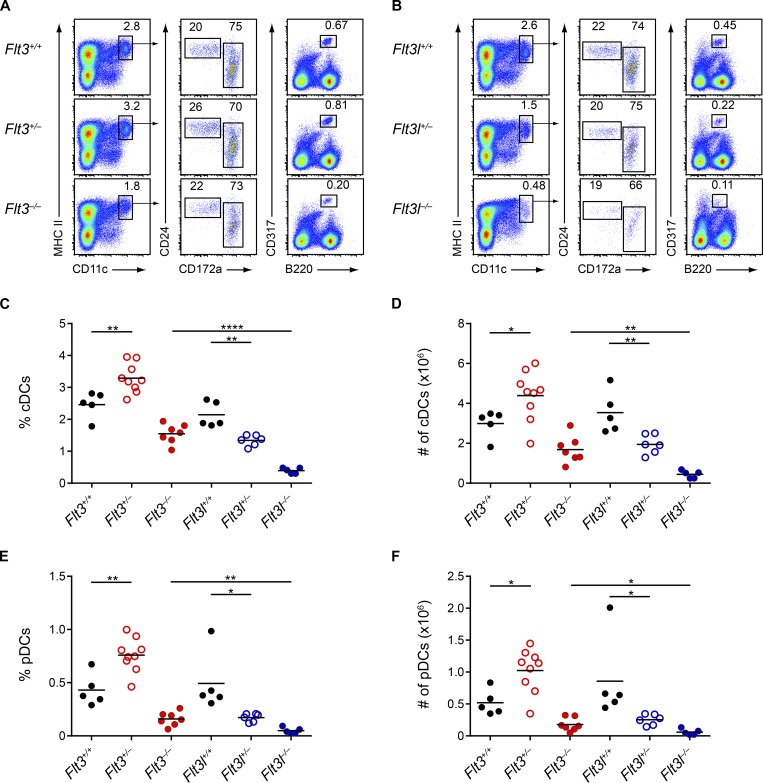
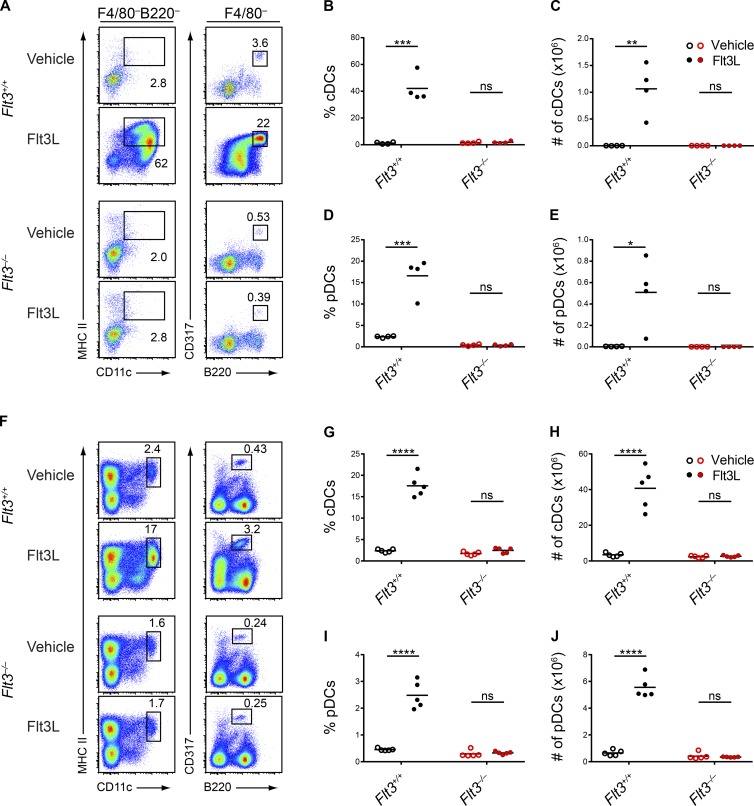
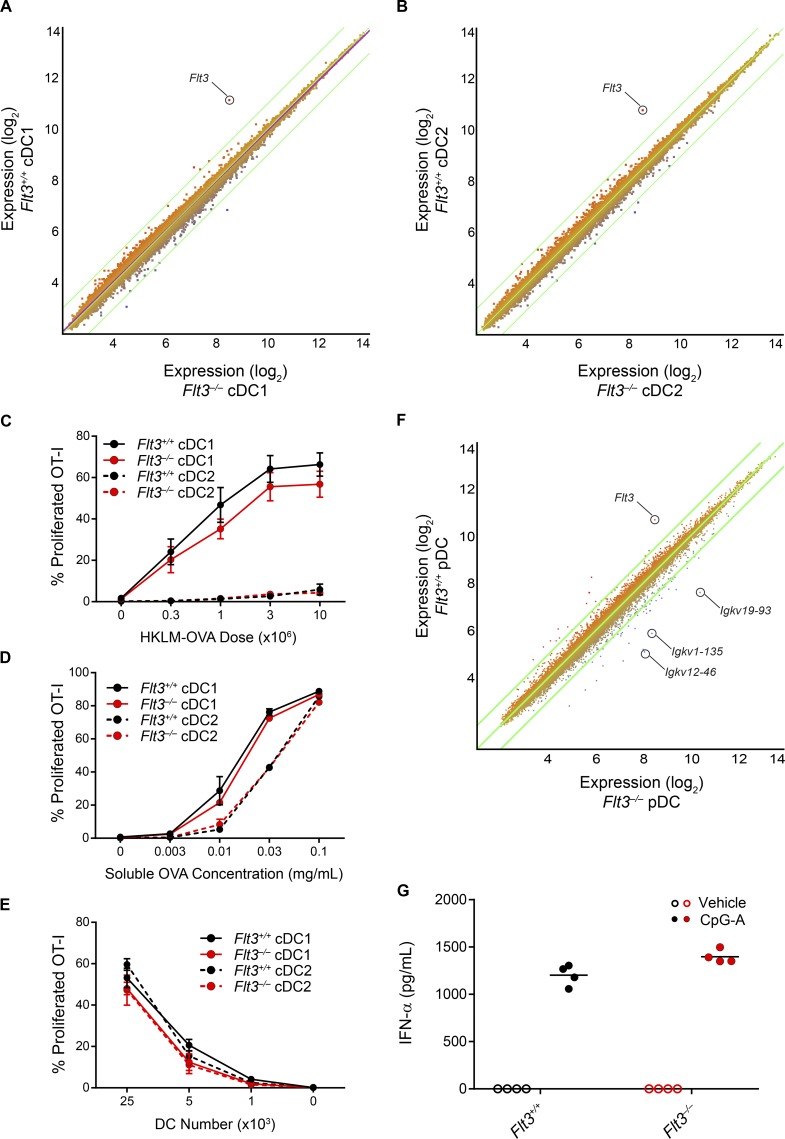
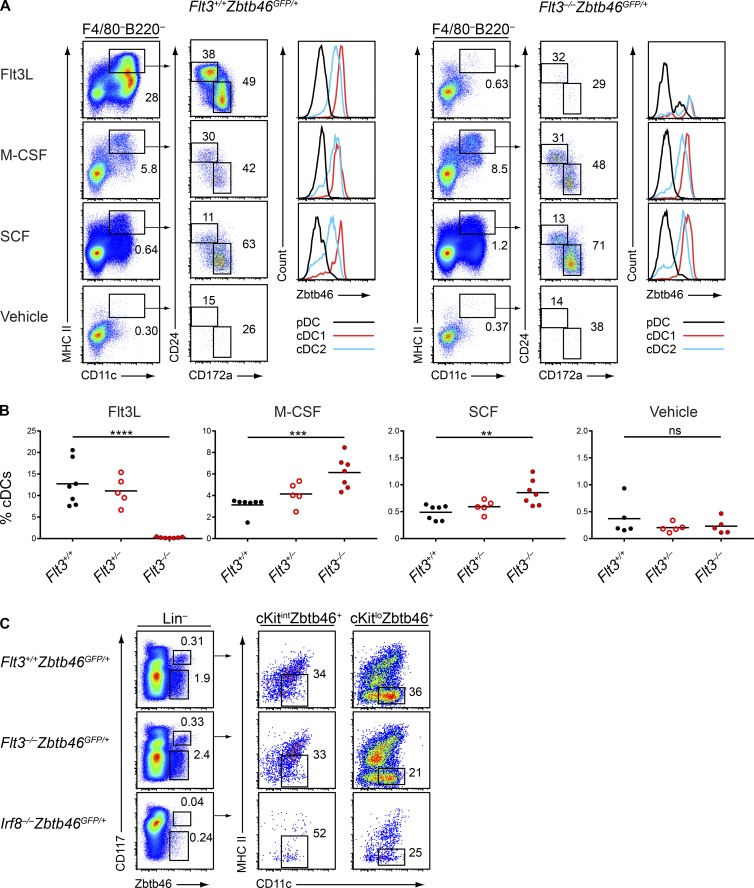
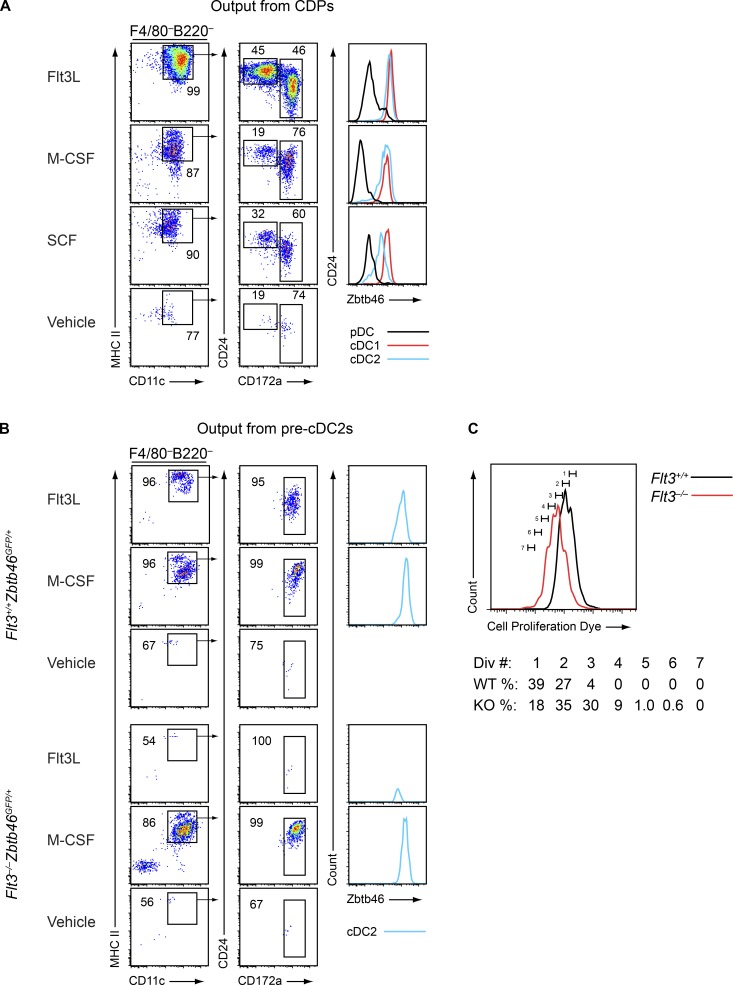
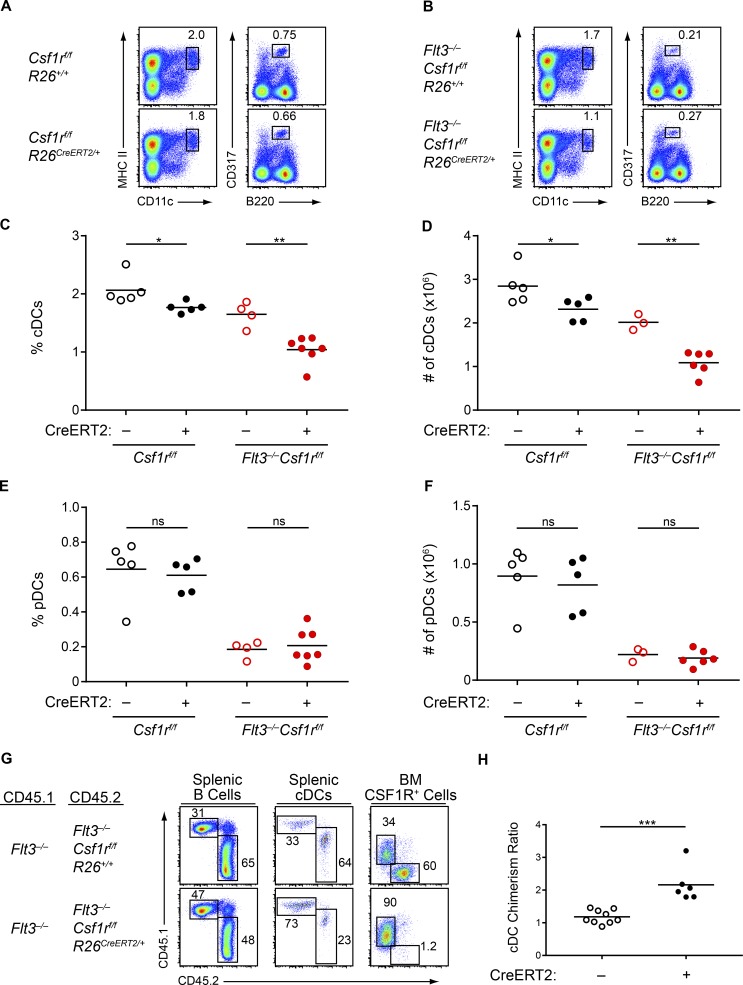
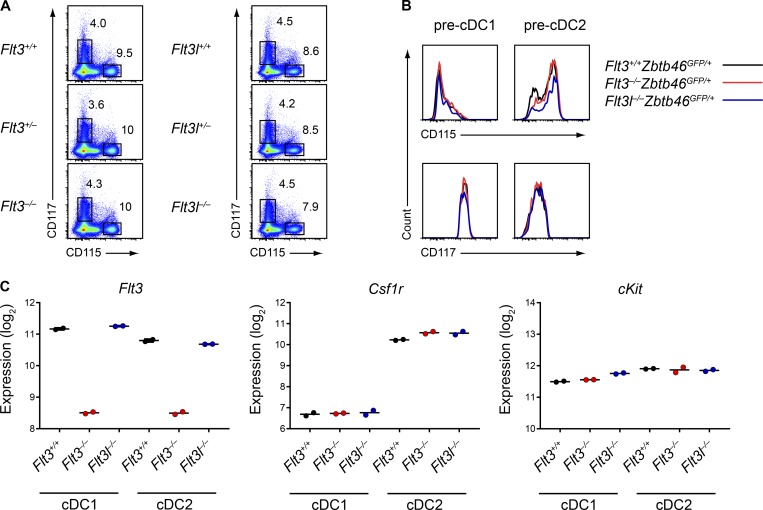
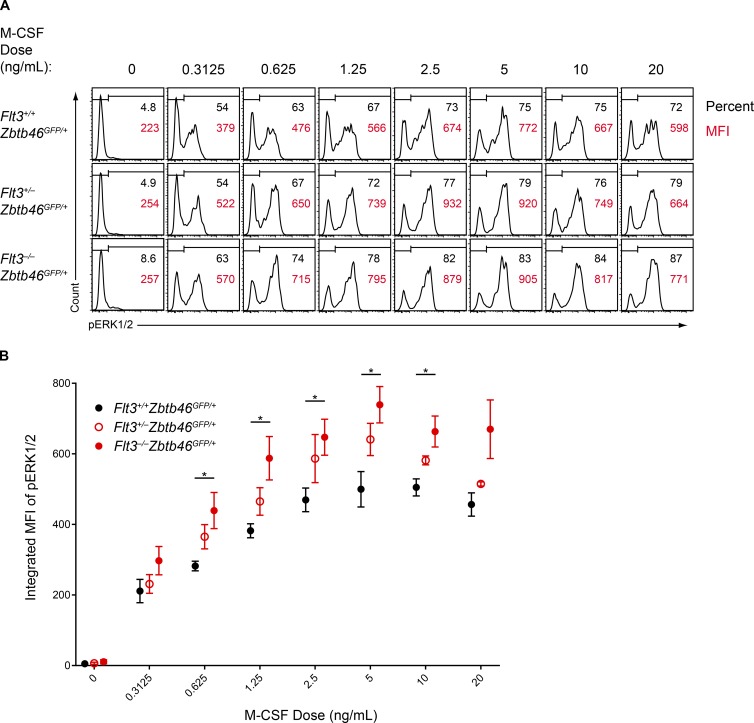
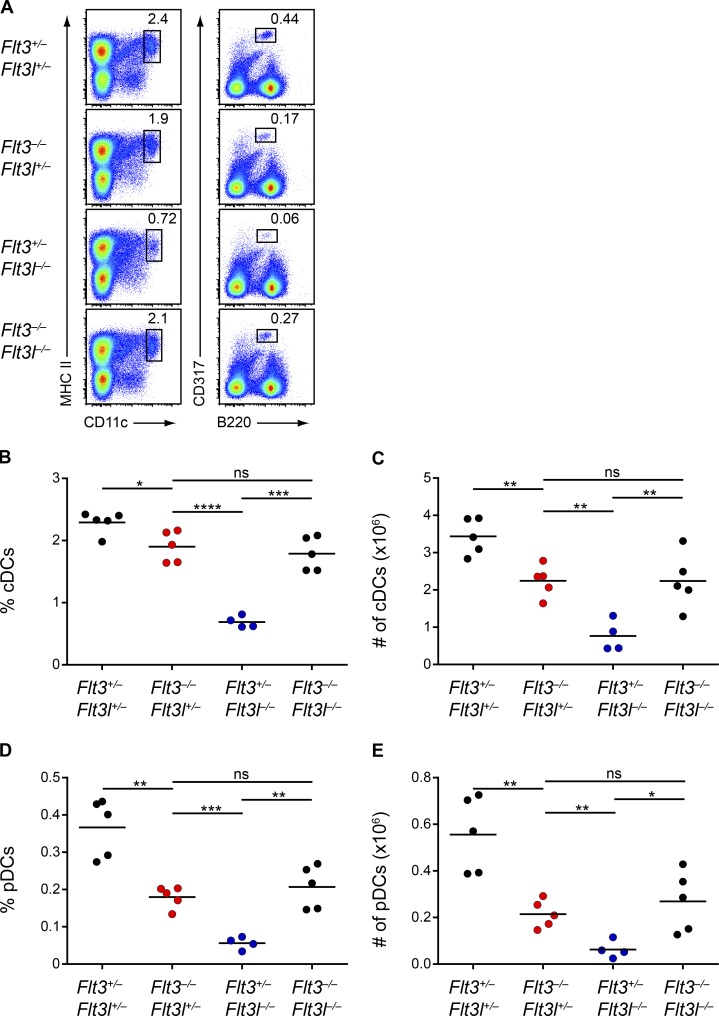
The receptor Flt3 and its ligand Flt3L are both critical for dendritic cell (DC) development, but DC deficiency is more severe in Flt3l-/- mice than in Flt3-/- mice. This has led to speculation that Flt3L binds to another receptor that also supports DC development. However, we found that Flt3L administration does not generate DCs in Flt3-/- mice, arguing against a second receptor. Instead, Flt3-/- DC progenitors matured in response to macrophage colony-stimulating factor (M-CSF) or stem cell factor, and deletion of Csf1r in Flt3-/- mice further reduced DC development, indicating that these cytokines could compensate for Flt3. Surprisingly, Flt3-/- DC progenitors displayed enhanced M-CSF signaling, suggesting that loss of Flt3 increased responsiveness to other cytokines. In agreement, deletion of Flt3 in Flt3l-/- mice paradoxically rescued their severe DC deficiency. Thus, multiple cytokines can support DC development, and the discrepancy between Flt3-/- and Flt3l-/- mice results from the increased sensitivity of Flt3-/- progenitors to these cytokines.


Figures

Figure 1.
Figure 1.
Flt3l−/− mice have a more severe DC deficiency than Flt3−/− mice at two weeks of age. (A and B) Splenocytes from mice of the indicated genotypes at 2-wk of age were analyzed by flow cytometry for DC populations. Shown are representative two-color histograms of live cells. Numbers specify the percentage of cells within the indicated gates. (C–F) Summary data for the percentage (C) and number (D) of splenic cDCs and the percentage (E) and number (F) of splenic pDCs in mice of the indicated genotypes. Dots represent biological replicates; small horizontal lines indicate the mean. Data are pooled from seven independent experiments (n = 5 mice per genotype). *, P < 0.05; **, P < 0.01; ****, P < 0.0001 using unpaired, two-tailed Student's t test.
Figure 2.
Figure 2.
Flt3l−/− mice continue to have a more severe DC deficiency than Flt3−/− mice at eight weeks of age. (A and B) Splenocytes from mice of the indicated genotypes at 8-wk of age were analyzed by flow cytometry for DC populations. Shown are representative two-color histograms of live cells. Numbers specify the percentage of cells within the indicated gates. (C–F) Summary data for the percentage (C) and number (D) of splenic cDCs and the percentage (E) and number (F) of splenic pDCs in mice of the indicated genotypes. Dots represent biological replicates; small horizontal lines indicate the mean. Data are pooled from nine independent experiments (n = 5–9 mice per genotype). *, P < 0.05; **, P < 0.01; ****, P < 0.0001 using unpaired, two-tailed Student's t test.
Figure 3.
Figure 3.
Flt3L fails to generate DCs in Flt3−/− mice. (A–E) BM cells from WT (Flt3+/+) or Flt3−/− mice were treated with vehicle or Flt3L and cultured for 9 d. Live cells were subsequently analyzed by flow cytometry for DC populations. (A) Shown are representative two-color histograms of live cells pregated as indicated above the plots. Numbers specify the percentage of cells within the indicated gates. (B–E) Summary data for the percentage (B) and number (C) of cDCs in each culture and for the percentage (D) and number (E) of pDCs in each culture. Dots represent biological replicates; small horizontal lines indicate the mean. Data are pooled from three independent experiments (n = 4 mice per genotype). (F–J) WT (Flt3+/+) and Flt3−/− mice were administered vehicle or Flt3L subcutaneously for 8 d and splenocytes were subsequently analyzed by flow cytometry on day 9 for DC populations. (F) Shown are representative two-color histograms of live cells. Numbers specify the percentage of cells within the indicated gates. (G–J) Summary data for the percentage (G) and number (H) of splenic cDCs and the percentage (I) and number (J) of splenic pDCs. Dots represent biological replicates; small horizontal lines indicate the mean. Data are pooled from two independent experiments (n = 5 mice per group). ns, not significant (P > 0.05); *, P < 0.05; **, P < 0.01; ***, P < 0.001; ****, P < 0.0001 using unpaired, two-tailed Student's t test.
Figure 4.
Figure 4.
Flt3−/− DCs are transcriptionally and functionally similar to WT DCs. (A and B) Microarray analysis of gene expression in cDC1s (A) or cDC2s (B) from Flt3+/+ and Flt3−/− mice, presented as M-plots. Colors indicate higher (red) or lower (blue) expression in Flt3+/+ cells than in Flt3−/− cells. Annotated genes with a greater than fourfold change in expression are specified (n = 2 biological replicates per subset per genotype). (C) Sorted cDC subsets from Flt3+/+ or Flt3−/− mice were cultured for 3 d with CFSE-labeled OT-I cells and different doses of heat-killed LM-OVA (HKLM-OVA) and then assayed for OT-I proliferation (CFSECD44+). Summary data for the percentage of proliferated OT-I cells in cultures with cDC subsets from the indicated genotypes are shown. Data are pooled from two independent experiments (n = 4 mice per genotype). (D) Sorted cDC subsets from Flt3+/+ or Flt3−/− mice were cultured for 3 d with CFSE-labeled OT-I cells and different doses of soluble OVA as antigen and then assayed for OT-I proliferation (CFSECD44+). Summary data for the percentage of proliferated OT-I cells in cultures with cDC subsets from the indicated genotypes are shown. Data are pooled from two independent experiments (n = 4 mice per genotype). (E) Sorted cDC subsets from Flt3+/+ or Flt3−/− mice were incubated with soluble OVA, washed, and then different numbers of cDCs were cultured with CFSE-labeled OT-I cells for 3 d after which OT-I proliferation was assayed. Summary data for the percentage of proliferated OT-I cells in cultures with the cDC subsets from the indicated genotypes are shown. Dots represent the mean; error bars represent the SEM. Data are pooled from two independent experiments (n = 4 mice per genotype). (F) Microarray analysis of gene expression in pDCs from Flt3+/+ and Flt3−/− mice, presented as M-plots. Colors indicate higher (red) or lower (blue) expression in Flt3+/+ cells than in Flt3−/− cells. Annotated genes with a greater than fourfold change in expression are specified (n = 2 biological replicates per subset per genotype). (G) Sorted pDCs from Flt3+/+ or Flt3−/− mice were stimulated with vehicle or CpG-A oligodeoxynucleotides overnight and then the cell supernatant was analyzed for IFN-α production. Summary data for the quantity of IFN-α produced by pDCs of the indicated genotypes are shown. Dots represent biological replicates; small horizontal lines indicate the mean. Data are pooled from two independent experiments (n = 4 mice per genotype).
Figure 5.
Figure 5.
Flt3−/− BM generates mature DCs in response to M-CSF or SCF and contains committed DC progenitors. (A and B) BM cells from mice of the indicated genotypes were treated with vehicle, Flt3L, M-CSF, or SCF and cultured for 7 d. Live cells were subsequently analyzed by flow cytometry for development of DCs. (A) Shown are representative two-color histograms of live cells pregated as indicated above the plots and one-color histograms of Zbtb46GFP expression in cells of the indicated subtype. Numbers represent the percentage of cells within the indicated gates. (B) Summary data for the percentage of cDCs in each culture. Dots represent biological replicates; small horizontal lines indicate the mean. Data are pooled from five independent experiments (n = 5–7 mice per genotype). (C) BM cells from mice of the indicated genotypes were analyzed by flow cytometry for DC progenitor populations; lineage markers include CD3, CD19, CD105, Ter119, and Ly-6G. Representative two-color histograms are shown of live cells pregated as indicated above the plots. Numbers specify the percentage of cells within the indicated gates. Data are representative of four independent experiments (n = 7 mice per genotype). ns, not significant (P > 0.05); **, P < 0.01; ***, P < 0.001; ****, P < 0.0001 using unpaired, two-tailed Student's t test.
Figure 6.
Figure 6.
Committed DC progenitors can mature in response to M-CSF and SCF. (A) CDPs (LinCD117intCD135+CD115+CD11cMHCII) were sorted from Zbtb46GFP/+ mice and cultured with vehicle, Flt3L, M-CSF, or SCF for 5 d. Cells were subsequently analyzed by flow cytometry for development of DCs. Shown are representative two-color histograms of live cells pregated as indicated above the plots and one-color histograms of Zbtb46GFP expression. Numbers specify the percentage of cells within the indicated gates. Data are representative of three independent experiments (sorted cells from three to five mice were pooled in each individual experiment). (B) Pre-cDC2s (LinCD115+CD11c+MHCIIZbtb46+) were sorted from Flt3+/+Zbtb46GFP/+ or Flt3−/−Zbtb46GFP/+ mice as indicated and cultured with vehicle, Flt3L, or M-CSF for 5 d. Cells were subsequently analyzed by flow cytometry for development of DCs. Shown are representative two-color histograms of live cells pregated as indicated above the plots and one-color histograms of Zbtb46GFP expression in cells of the indicated subtype. Numbers specify the percentage of cells within the indicated gates. Data are representative of three independent experiments (sorted cells from three to five mice per genotype were pooled in each individual experiment). (C) Pre-cDC2s were sorted from Flt3+/+Zbtb46GFP/+ or Flt3−/−Zbtb46GFP/+ mice, labeled with Cell Proliferation Dye (CPD), and cultured with M-CSF for 5 d. Cells were subsequently analyzed by flow cytometry for dilution of CPD to determine the number of divisions they underwent. Shown is a representative one-color histogram of CPD levels and the percentage of cells at each division. Data are representative of two independent experiments (sorted cells from three mice per genotype were pooled in each individual experiment).
Figure 7.
Figure 7.
cDC development in Flt3−/− mice is dependent on CSF1R. (A–F) Mice of the indicated genotypes were treated with tamoxifen to delete Csf1r. After treatment, splenocytes were analyzed by flow cytometry for DC populations. (A and B) Shown are representative two-color histograms of live cells. Numbers specify the percentage of cells within the indicated gates. (C–F) Summary data of the percentage (C) and number (D) of splenic cDCs and for the percentage (E) and number (F) of splenic pDCs in mice of the indicated genotypes. Dots represent biological replicates; small horizontal lines indicate the mean. Data are pooled from seven independent experiments. (n = 3–7 mice per genotype). (G and H) WT CD45.1+ mice were lethally irradiated and reconstituted with Flt3−/− CD45.1+:Flt3−/−Csf1rf/fR26+/+CD45.2+ BM at a 1:1 ratio (CreERT2) or Flt3−/−CD45.1+:Flt3−/−Csf1rf/fR26CreERT2/+CD45.2+ BM at a 1:1 ratio (CreERT2+). After reconstitution and tamoxifen treatment to delete Csf1r, spleens and BM were analyzed by flow cytometry. (G) Shown are representative two-color histograms (pregating, above plots; splenic B cells, B220+CD24+; splenic cDCs, CD11c+MHCII+; BM CSF1R+ cells, CD115+). Numbers specify the percentage of cells within the indicated gates. (H) Summary data of the chimerism ratio of splenic cDCs presented as the ratio of CD45.1+ to CD45.2+ cDCs normalized to the ratio of CD45.1+ to CD45.2+ B cells within the same mouse. Dots represent individual mice; small horizontal lines indicate the mean. Data are pooled from four independent experiments (n = 6–9 chimeras per genotype). ns, not significant (P > 0.05); *, P < 0.05; **, P < 0.01; ***, P < 0.001 using unpaired, two-tailed Student's t test.
Figure 8.
Figure 8.
Flt3−/− and Flt3l−/− BM progenitors and cDCs express normal levels of CSF1R and c-Kit. (A) BM cells from mice of the indicated genotypes were analyzed by flow cytometry for cytokine receptor expression. Representative two-color histograms of live cells are shown. Numbers specify the percentage of cells within the indicated gates. Data are representative of at least three independent experiments (n = 4–7 mice per genotype). (B) Pre-cDC1s and pre-cDC2s from mice of the indicated genotypes were analyzed by flow cytometry for cytokine receptor expression levels. Representative one-color histograms of each receptor are shown. Data are representative of three independent experiments (n = 3–7 mice per genotype). (C) Expression of the indicated genes in splenic cDC1s and cDC2s from mice of the indicated genotypes was determined by gene expression microarray analysis. Dots represent biological replicates (n = 2 mice per subset per genotype).
Figure 9.
Figure 9.
Flt3−/− DC progenitors display increased sensitivity to M-CSF. (A and B) Serum-starved BM from mice of the indicated genotypes was treated with M-CSF and assayed for phosphorylated Erk1/2 (pErk1/2) by intracellular flow cytometry. (A) Shown are representative one-color histograms of pErk1/2 in pre-cDC2s stimulated with the indicated concentrations of M-CSF. Numbers in black indicate the percentage of cells within the gate, and numbers in red indicate the geometric MFI of pErk1/2 in the gated population. Data are representative of three independent experiments. (B) Summary data presented as the integrated MFI of pErk1/2 in pre-cDC2s from mice of the indicated genotypes stimulated with the indicated concentration of M-CSF. Dots indicate the mean from three independent experiments; error bars indicate the SEM (n = 3 mice per genotype). *, P < 0.05 using Student's t test.
Figure 10.
Figure 10.
Deletion of Flt3 rescues the severe DC defect in Flt3l−/− mice. (A–E) Splenocytes from mice of the indicated genotypes at 8-wk of age were analyzed by flow cytometry for DC populations. (A) Shown are representative two-color histograms of live cells. Numbers specify the percentage of cells within the indicated gates. (B–E) Summary data for the percentage (B) and number (C) of splenic cDCs and the percentage (D) and number (E) of splenic pDCs in mice of the indicated genotypes. Dots represent biological replicates; small horizontal lines indicate the mean. Data are pooled from six independent experiments (n = 4–5 mice per genotype). *, P < 0.05; **, P < 0.01; ***, P < 0.001; ****, P < 0.0001 using unpaired, two-tailed Student's t test.

References

    1. Auffray C., Fogg D.K., Narni-Mancinelli E., Senechal B., Trouillet C., Saederup N., Leemput J., Bigot K., Campisi L., Abitbol M., et al. 2009. CX3CR1+ CD115+ CD135+ common macrophage/DC precursors and the role of CX3CR1 in their response to inflammation. J. Exp. Med. 206:595–606. 10.1084/jem.20081385 - DOI - PMC - PubMed
    1. Brasel K., De Smedt T., Smith J.L., and Maliszewski C.R.. 2000. Generation of murine dendritic cells from flt3-ligand-supplemented bone marrow cultures. Blood. 96:3029–3039. - PubMed
    1. Breton G., Lee J., Zhou Y.J., Schreiber J.J., Keler T., Puhr S., Anandasabapathy N., Schlesinger S., Caskey M., Liu K., and Nussenzweig M.C.. 2015. Circulating precursors of human CD1c+ and CD141+ dendritic cells. J. Exp. Med. 212:401–413. 10.1084/jem.20141441 - DOI - PMC - PubMed
    1. D’Amico A., and Wu L.. 2003. The early progenitors of mouse dendritic cells and plasmacytoid predendritic cells are within the bone marrow hemopoietic precursors expressing Flt3. J. Exp. Med. 198:293–303. 10.1084/jem.20030107 - DOI - PMC - PubMed
    1. Darrah P.A., Patel D.T., De Luca P.M., Lindsay R.W., Davey D.F., Flynn B.J., Hoff S.T., Andersen P., Reed S.G., Morris S.L., et al. 2007. Multifunctional TH1 cells define a correlate of vaccine-mediated protection against Leishmania major. Nat. Med. 13:843–850. 10.1038/nm1592 - DOI - PubMed

Publication types

MeSH terms

Substances