. 2018 Jun;177(2):652-670.
doi: 10.1104/pp.18.00183. Epub 2018 Mar 23.

METHIONINE ADENOSYLTRANSFERASE4 Mediates DNA and Histone Methylation

Affiliations

METHIONINE ADENOSYLTRANSFERASE4 Mediates DNA and Histone Methylation

Jingjing Meng et al. Plant Physiol. 2018 Jun.

Abstract

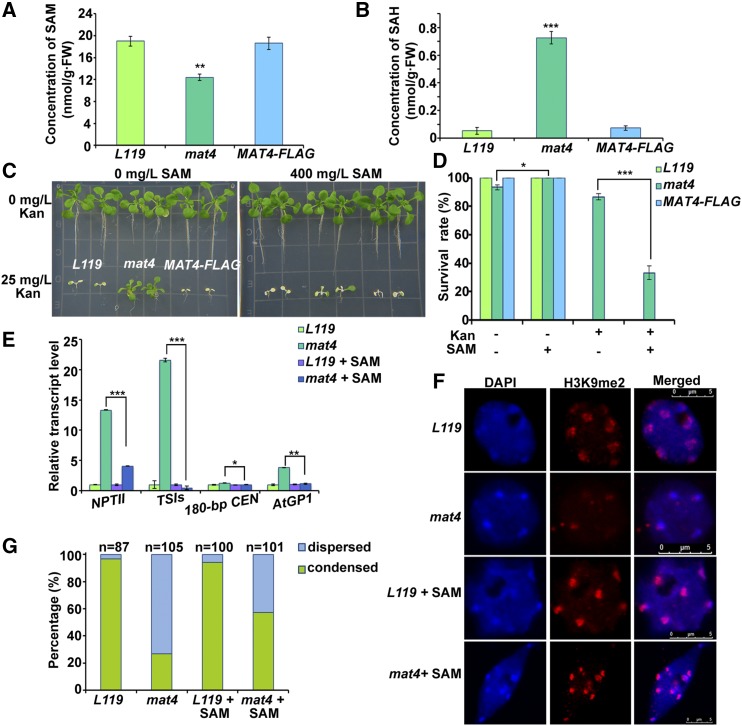
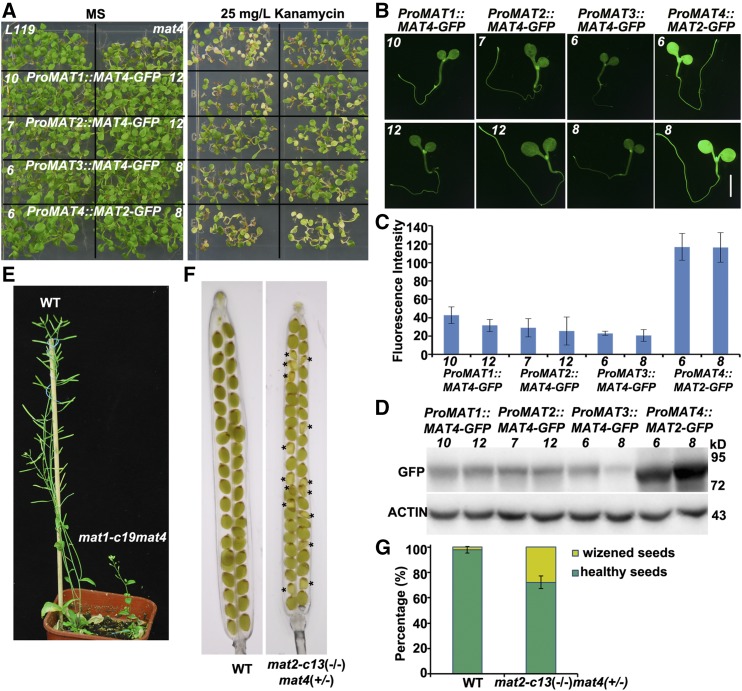
DNA and histone methylation coregulate heterochromatin formation and gene silencing in animals and plants. To identify factors involved in maintaining gene silencing, we conducted a forward genetic screen for mutants that release the silenced transgene Pro35S::NEOMYCIN PHOSPHOTRANSFERASE II in the transgenic Arabidopsis (Arabidopsis thaliana) line L119 We identified MAT4/SAMS3/MTO3/AT3G17390, which encodes methionine (Met) adenosyltransferase 4 (MAT4)/S-adenosyl-Met synthetase 3 that catalyzes the synthesis of S-adenosyl-Met (SAM) in the one-carbon metabolism cycle. mat4 mostly decreases CHG and CHH DNA methylation and histone H3K9me2 and reactivates certain silenced transposons. The exogenous addition of SAM partially rescues the epigenetic defects of mat4 SAM content and DNA methylation were reduced more in mat4 than in three other mat mutants. MAT4 knockout mutations generated by CRISPR/Cas9 were lethal, indicating that MAT4 is an essential gene in Arabidopsis. MAT1, 2, and 4 proteins exhibited nearly equal activity in an in vitro assay, whereas MAT3 exhibited higher activity. The native MAT4 promoter driving MAT1, 2, and 3 cDNA complemented the mat4 mutant. However, most mat4 transgenic lines carrying native MAT1, 2, and 3 promoters driving MAT4 cDNA did not complement the mat4 mutant because of their lower expression in seedlings. Genetic analyses indicated that the mat1mat4 double mutant is dwarfed and the mat2mat4 double mutant was nonviable, while mat1mat2 showed normal growth and fertility. These results indicate that MAT4 plays a predominant role in SAM production, plant growth, and development. Our findings provide direct evidence of the cooperative actions between metabolism and epigenetic regulation.


Figures

Figure 1.
Figure 1.
Diagram of the methyl-group supply in one-carbon metabolism. Enzymes involved in one-carbon metabolism: MAT/SAMS, Met adenosyltransferase/S-adenosyl-Met synthetase; MT, methyltransferase; SAHH1/HOG1, S-adenosyl-homo-cysteine hydrolase/ homology-dependent gene silencing1; MS, Met synthase; and FPGS, folylpolyglutamate synthetase. FPGS catalyzes the synthesis of 5-CH3-THF-Glun, which provides active methyl group for Hcy for Met synthesis by MS. MAT/SAMS uses Met and ATP as substrates to synthesis SAM, which converts to SAH after methylation reaction of MT. SAHH1/HOG1 can hydrolyze SAH to Hcy.
Figure 2.
Figure 2.
Identification and characterization of MAT4. A, Kan resistance of mat4 mutants. Seeds were germinated on MS medium or MS supplemented with 25 mg/L Kan. L119 was the transgenic line harboring silenced Pro35S::NPTII and ProRD29A::LUC (proRD29A, an abiotic stress-inducible promoter). ddm1-18 (indicated as ddm1) was selected in the same genetic screening and reactivated both transgenic sites. B, Protein levels of NPTII in L119, mat4, and ddm1 detected by immunoblot. ACTIN was the loading control. C, Transcript levels of transgenic and endogenous loci by real-time RT-qPCR analysis. Transcript levels were normalized to ACTIN2 and relative to L119. Three independent experiments were conducted with similar results. Data are from one experiment with three technical replicates. Error bars are the means ± sd; asterisks indicate significant differences determined by Student’s t test (*P < 0.05, **P < 0.01, ***P < 0.001). D, Silenced ProRD29A::LUC reactivation in mat4 and ddm1. Seedlings of L119, mat4, and ddm1 were treated with 300 mm NaCl for 3 h before detecting the inflorescence signal with a CCD camera (Roper 1300D). E, Identification of MAT4 by map-based cloning. There was a G-to-A mutation, which changed Asp-246 to Asn-246 in AT3G17390. F, Complementation of Kan resistance and delayed germination in mat4 by MAT4. G, NPTII level restored to the basal level of L119 in MAT4-FLAG as determined by immunoblot analyses using anti-NPTII antibodies. ACTIN was the loading control. H, Subcellular localization of MAT4. a, Transgenic line carrying Pro35S::MAT4-GFP in L119; b, transient expression of ProMAT4::MAT4-GFP in a protoplast; c, transient expression of ProMAT4::MAT4-GFP in N. benthamiana leaf epidermal cells. I, Detection of the subcellular localization of MAT4-FLAG after isolating the cytosol and nuclei. PEPC was a marker protein in the cytosol and H3 was a marker protein in the nuclei.
Figure 3.
Figure 3.
DNA methylation of the transgenic and endogenous RD29A promoter in mat4. A, DNA methylation of the 35S promoter region by bisulfite sequencing in L119, mat4, ddm1, and MAT4-FLAG. B, DNA methylation of the transgenic RD29A promoter region by bisulfite sequencing in L119, mat4, ddm1, and MAT4-FLAG. C, DNA methylation of the endogenous RD29A promoter region by bisulfite sequencing in L119, mat4, ddm1, and MAT4-FLAG. D, DNA methylation of the T-DNA insertion region in L119 and mat4 as determined by whole-genome bisulfite sequencing as indicated by IGV software windows.
Figure 4.
Figure 4.
Whole-genome DNA methylation levels in mat4. A, Whole-genome DNA methylation levels of CG, CHG, and CHH in L119, ddm1, and mat4. Bisulfite sequencing data for L119 and mat4 were from this study. Data for ddm1 were from a previously published study (Zemach et al., 2013). B, Relative changes in the DNA methylation levels of CG, CHG, and CHH in L119, ddm1, and mat4. C, Frequency distribution histograms of significant methylation differences (P < 0.01) between L119 and mat4 in CG, CHG, and CHH. The histograms were made with 100-bp analyzable windows over the genome-wide scale and the methylation levels of L119 and mat4 in CG, CHG, and CHH context were calculated separately. D, CG, CHG, and CHH methylation of L119, ddm1, and mat4 at genes that do not contain TEs (including 2 kb upstream and downstream). TSS, Transcription start site; TTS, transcription termination site. E, CG, CHG, and CHH methylation of L119, ddm1, and mat4 at TEs that are shorter than 0.5 kb (S-TE), including 2 kb upstream and downstream, and at TE body regions. F, CG, CHG, and CHH methylation of L119, ddm1, and mat4 at TEs that are longer than 4 kb (L-TE), including 2 kb upstream and downstream, and at TE body regions.
Figure 5.
Figure 5.
Histone H3K9me2 and H3K27me1 levels in mat4. A, Immunoblot assays with antibodies against H3K9me1, H3K9me2, and H3K27me1 in L119, ddm1, and mat4. H3 was the loading control. B, Statistical analyses of relative signal intensity in A. We set the signal intensity of L119 as 100 to calculate the relative signal intensity of other mutants. Error bars are the means ± sd (n = 3). Asterisks indicate significant differences determined by Student’s t test (*P < 0.05 and ** P < 0.01). C, Histone methylation patterns of H3K9me1 in the nuclei of L119, ddm1, and mat4 as detected by immunofluorescence assay. D, Histone methylation patterns of H3K9me2 in the nuclei of L119, ddm1, and mat4 as detected by immunofluorescence assay. E, Histone methylation patterns of H3K27me1 in the nuclei of L119, ddm1, and mat4 as detected by immunofluorescence assay. For C to E, on the right, the graphs show the percentage of nuclei with condensed or dispersed signal; gray represents a condensed, and white represents a dispersed signal. n = number of nuclei. DAPI stains the pericentromeric heterochromatin regions. F, Detection of H3K9me2 in L119, ddm1, and mat4 at several selected loci by ChIP combined with RT-qPCR. Three independent experiments were conducted with similar results. Data are from one experiment with three technical replicates. Error bars are the means ± sd (n = 3). Asterisks indicate significant differences determined by Student’s t test (*P < 0.05 and **P < 0.01).
Figure 6.
Figure 6.
Gene expression changes in mat4 by RNA sequencing. A, Differentially expressed genes in mat4 compared with L119. Transcript levels of genes that changed more than 2-fold and had P < 0.0001 were selected. Gene up, up-regulated genes; Gene down, down-regulated genes. B, Differentially expressed TEs in mat4 compared with L119. Transcript levels of TEs that changed more than 2-fold and had a P < 0.0001 were selected. TE up, up-regulated TEs; TE down, down-regulated TEs. C, Distribution of the differentially expressed genes and TEs on the five chromosomes. The purple circle represents the differentially expressed genes, the blue circle represents the differentially expressed TEs, and the green circle represents the differentially methylated regions in mat4. The outer bars indicate the up-regulated genes, TEs, and hyper-DMRs, and the inner bars indicate the down-regulated genes, TEs, and hypo-DMRs; the length of the bars represents the fold change of the genes, TEs and DMRs. The black dots indicate the chromocenters. D, Overlap of up-regulated TEs among mat4, ddm1, and fpgs1. The overlap number was calculated using VENNY2.1. E. Categories of up-regulated TEs in mat4. The diagram shows the percentage of different TE types among the total up-regulated TEs.
Figure 7.
Figure 7.
Application of SAM to rescue the release of silencing in mat4. A, SAM content in mat4 compared with L119 as determined by LC-MS. Three independent experiments were conducted with similar results. Data are from one experiment with three technical replicates. Error bars are the means ± sd, n = 3. Asterisks indicate significant differences determined by Student’s t test (**P < 0.01). B, SAH content in mat4 compared with L119 as determined by LC-MS. Three independent experiments were conducted with similar results. Data are from one experiment with three technical replicates. Error bars are the means ± sd, n = 3. Asterisks indicate significant differences determined by Student’s t test (***P < 0.001). C, Kan resistance of mat4 can be partially rescued by exogenously adding 400 mg/L SAM to medium supplemented with 25 mg/L Kan. D, Statistical results show the survival rate of seedlings grown on the indicated medium. Error bars are the means ± sd (n = 15). Asterisks indicate significant differences determined by Student’s t test (*P < 0.05 and ***P < 0.001). E, Transcript levels of NTPII and endogenous loci by real-time RT-qPCR analysis using the seedlings grown on medium supplemented with 400 mg/L SAM. Three independent experiments were conducted with similar results. Data are from one experiment with three technical replicates. Error bars are the means ± sd. Asterisks indicate significant differences determined by Student’s t test (*P < 0.05, **P < 0.01, and ***P < 0.001). F, Histone methylation patterns of H3K9me2 in L119 and mat4 seedlings grown on MS medium or MS medium supplemented with 400 mg/L SAM as determined by immunofluorescence assays with anti-H3K9me2 antibodies. DAPI staining (blue) was performed on the pericentromeric heterochromatin regions. G, The percentage of nuclei that showed a condensed or dispersed signal. n = number of nuclei.
Figure 8.
Figure 8.
The catalytic activities of MAT proteins. A, Comparison of the catalytic activities of MAT proteins. The same amount of MAT proteins as indicated by Coomassie staining were added for individual reactions. The reaction that had no protein added was used as a negative control. Three independent experiments were conducted with similar results. Data are from one experiment with three technical replicates. Error bars are the means ± sd (n = 3). B, SAM production with increasing concentrations of MAT4. Protein amounts were indicated by Coomassie staining. The reaction that had no protein added was used as a negative control. Three independent experiments were conducted with similar results. Data are from one experiment with three technical replicates. Error bars are the means ± sd (n = 3). C and D, The GFP fluorescence of mat4 transgenic lines carrying the MAT4 promoter driving MAT1, MAT2, or MAT3 cDNA. The seedlings were grown on MS for 7 d, and the GFP fluorescence in root tips (C) or the whole seedlings (D) was visualized by a confocal microscope (Zeiss LSM 510 META) and a fluorescent microscope (Olympus SEX16), respectively. E, Kan resistance and delayed germination in mat4 was complemented by MAT1, MAT2, or MAT3 driven by the promoter of MAT4.
Figure 9.
Figure 9.
MAT4 plays a predominant role in plant growth and development. A, Kan resistance and delayed germination in mat4 was not complemented by ProMAT1::MAT4-GFP, ProMAT2:: MAT4-GFP, or ProMAT3::MAT4-GFP but was complemented by ProMAT4::MAT2-GFP. B, The GFP fluorescence in seedlings of transgenic lines carrying ProMAT1::MAT4-GFP, ProMAT2::MAT4-GFP, ProMAT3::MAT4-GFP, or ProMAT4::MAT2-GFP grown on MS for 7 d. C, Statistical results of the fluorescence intensity of the transgenic lines in B in a fixed area in cotyledons by ImageJ. Error bars are the mean ± sd (n = 12). D, Detection of MAT4-GFP in transgenic lines by immunoblotting using anti-GFP antibodies. ACTIN was the loading control. E, mat1-c19 mat4 double mutant seedlings compared to the wild type (L119) grown in soil under long-day conditions. The mutant did not produce any seeds. F, The siliques of the wild type and mat2-c13(−/−) mat4(+/−). Asterisks indicate the wizened seeds of mat2-c13 mat4 homozygous double mutants. G, Wizened seed percentages in siliques of mat2-c13(−/−) mat4(+/−) heterozygous mutants compared to the wild type.
Figure 10.
Figure 10.
MAT4 interacts with different MATs in plants. A, MAT4 interacted with MAT1, MAT2, MAT3, or MAT4 itself in a protein co-IP assay. Total proteins were extracted from Arabidopsis protoplasts transiently coexpressing the MAT4-FLAG with MAT1-, MAT2-, MAT3-, MAT4-GFP, or GFP (as a negative control) plasmids and immunoprecipitated with anti-GFP beads. The co-IP proteins were immunoblotted with anti-FLAG and anti-GFP antibodies. B, Protein pull-down assay for MAT4 interaction with MAT1, MAT2, MAT3, or MAT4 itself. Total proteins were isolated from E. coli coexpressing MAT4-His with GST-MAT1, -MAT2, -MAT3, -MAT4, or GST itself (as a negative control) and immunoprecipitated with Glutathione-Sepharose beads. The co-IP proteins were immunoblotted with anti-His and anti-GST antibodies. C, Gel filtration analyses. The 0.5 mg of total proteins extracted from ∼20 g of the 15-d-old seedlings of MAT4-FLAG was applied to an ANTI-FLAG M1 Agarose Affinity Gel. The proteins were eluted using 0.5 µg/µL FLAG Peptide. The elution at the peaks was used for LC-MS analysis. D, LC-MS/MS analyses of the proteins of the three peaks in C. Cov indicates the percentage of sequence coverage (%); Seq (sig) indicates number of significant sequences.

Comment in

References

    1. Baubec T, Dinh HQ, Pecinka A, Rakic B, Rozhon W, Wohlrab B, von Haeseler A, Mittelsten Scheid O (2010) Cooperation of multiple chromatin modifications can generate unanticipated stability of epigenetic States in Arabidopsis. Plant Cell 22: 34–47 - PMC - PubMed
    1. Bernatavichute YV, Zhang X, Cokus S, Pellegrini M, Jacobsen SE (2008) Genome-wide association of histone H3 lysine nine methylation with CHG DNA methylation in Arabidopsis thaliana. PLoS One 3: e3156. - PMC - PubMed
    1. Cao X, Jacobsen SE (2002a) Locus-specific control of asymmetric and CpNpG methylation by the DRM and CMT3 methyltransferase genes. Proc Natl Acad Sci USA (Suppl 4) 99: 16491–16498 - PMC - PubMed
    1. Cao X, Jacobsen SE (2002b) Role of the Arabidopsis DRM methyltransferases in de novo DNA methylation and gene silencing. Curr Biol 12: 1138–1144 - PubMed
    1. Chen Y, Zou T, McCormick S (2016) S-Adenosylmethionine Synthetase 3 is important for pollen tube growth. Plant Physiol 172: 244–253 - PMC - PubMed

Publication types

MeSH terms