. 2018 Apr 11;38(15):3753-3766.
doi: 10.1523/JNEUROSCI.2518-17.2018. Epub 2018 Mar 23.

Convergence and Divergence of CRH Amacrine Cells in Mouse Retinal Circuitry

Affiliations

Convergence and Divergence of CRH Amacrine Cells in Mouse Retinal Circuitry

Silvia J H Park et al. J Neurosci. .

Abstract

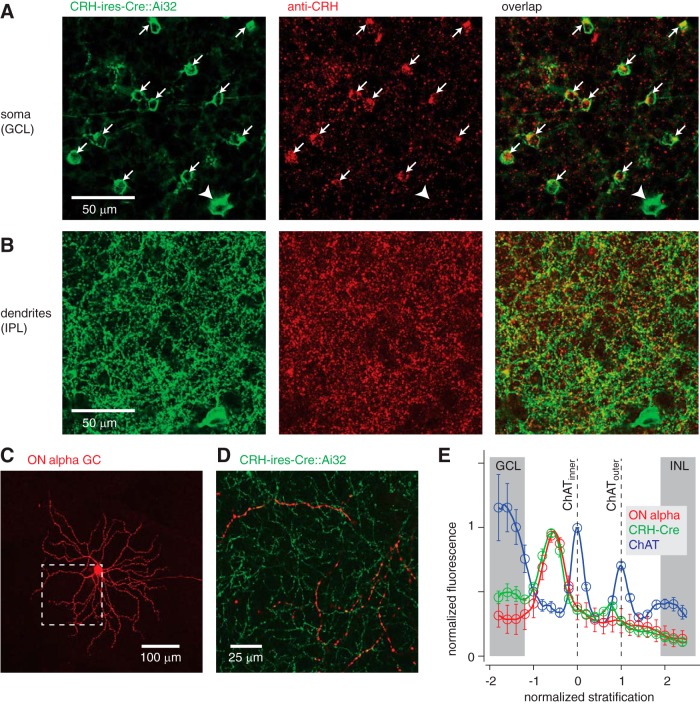
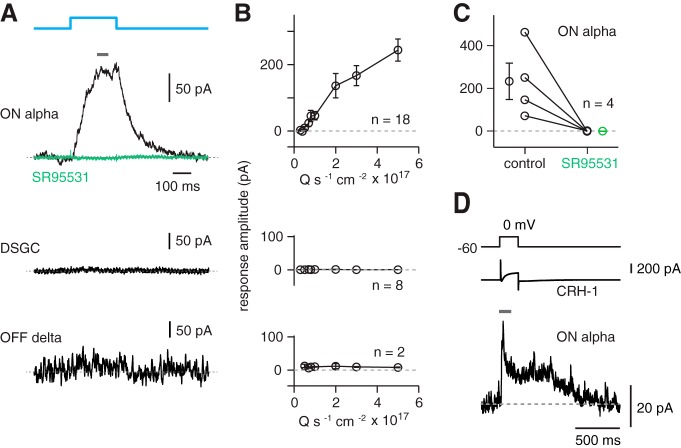
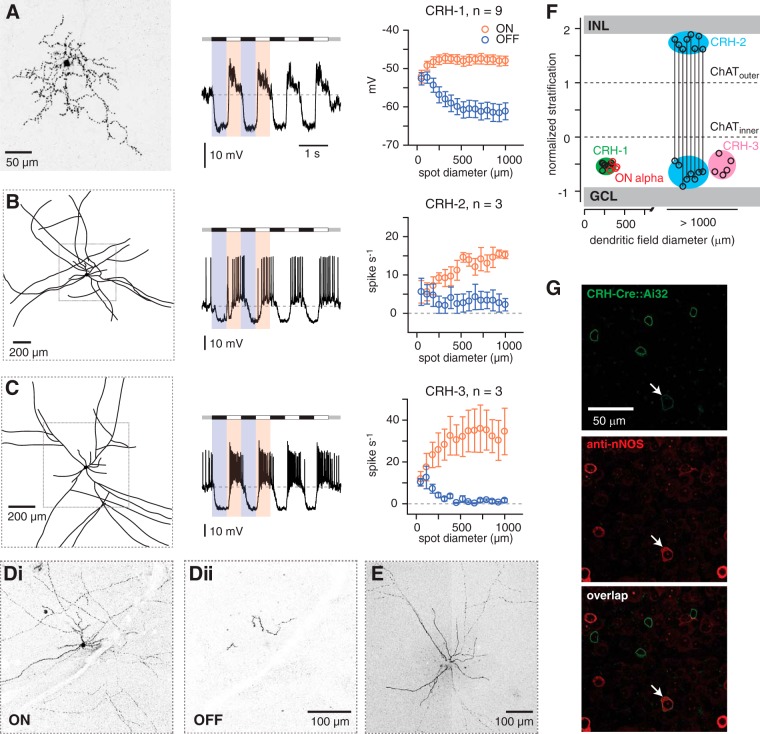
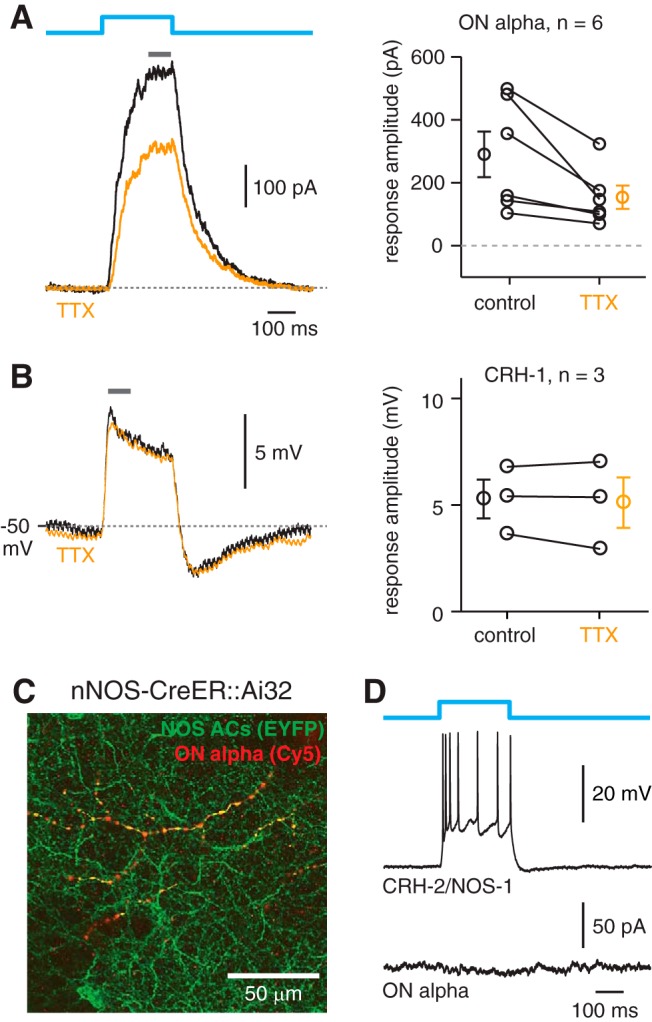
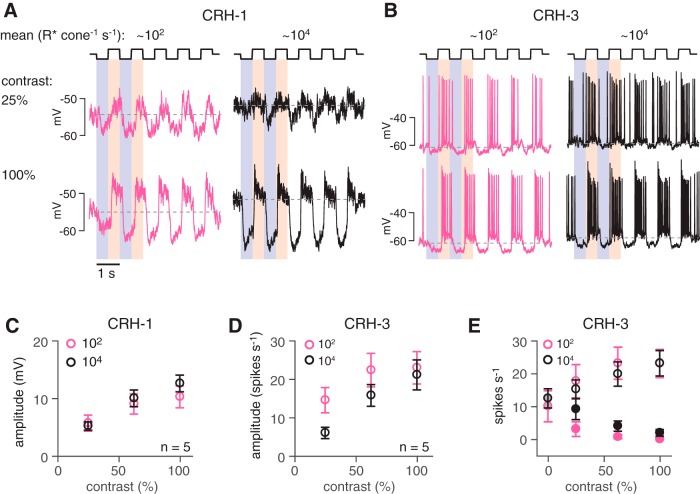
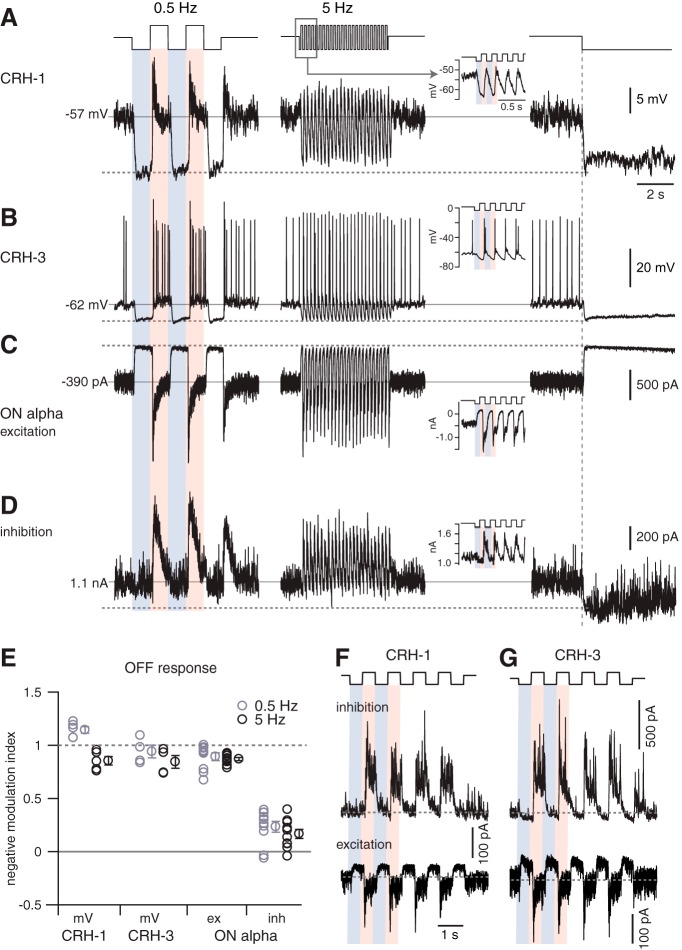
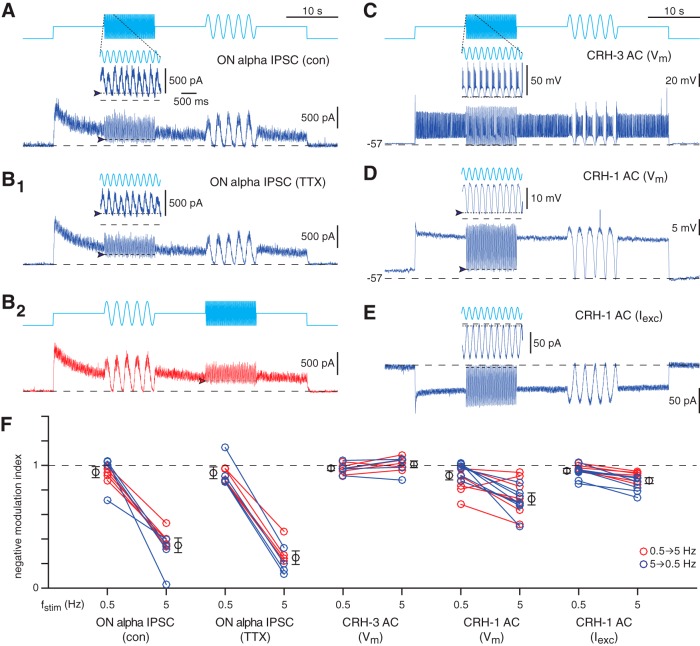
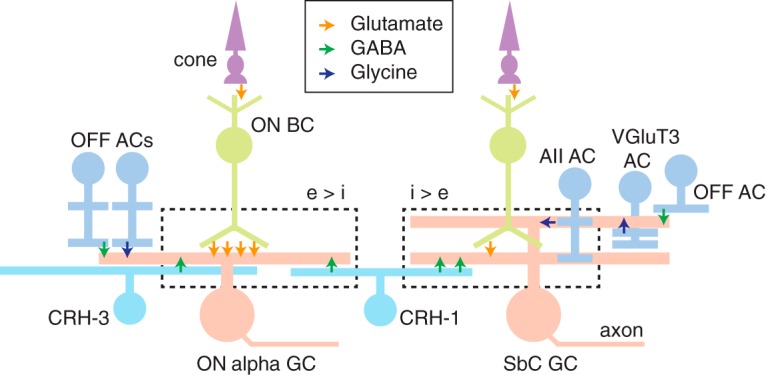
Inhibitory interneurons sculpt the outputs of excitatory circuits to expand the dynamic range of information processing. In mammalian retina, >30 types of amacrine cells provide lateral inhibition to vertical, excitatory bipolar cell circuits, but functional roles for only a few amacrine cells are well established. Here, we elucidate the function of corticotropin-releasing hormone (CRH)-expressing amacrine cells labeled in Cre-transgenic mice of either sex. CRH cells costratify with the ON alpha ganglion cell, a neuron highly sensitive to positive contrast. Electrophysiological and optogenetic analyses demonstrate that two CRH types (CRH-1 and CRH-3) make GABAergic synapses with ON alpha cells. CRH-1 cells signal via graded membrane potential changes, whereas CRH-3 cells fire action potentials. Both types show sustained ON-type responses to positive contrast over a range of stimulus conditions. Optogenetic control of transmission at CRH-1 synapses demonstrates that these synapses are tuned to low temporal frequencies, maintaining GABA release during fast hyperpolarizations during brief periods of negative contrast. CRH amacrine cell output is suppressed by prolonged negative contrast, when ON alpha ganglion cells continue to receive inhibitory input from converging OFF-pathway amacrine cells; the converging ON- and OFF-pathway inhibition balances tonic excitatory drive to ON alpha cells. Previously, it was demonstrated that CRH-1 cells inhibit firing by suppressed-by-contrast (SbC) ganglion cells during positive contrast. Therefore, divergent outputs of CRH-1 cells inhibit two ganglion cell types with opposite responses to positive contrast. The opposing responses of ON alpha and SbC ganglion cells are explained by differing excitation/inhibition balance in the two circuits.SIGNIFICANCE STATEMENT A goal of neuroscience research is to explain the function of neural circuits at the level of specific cell types. Here, we studied the function of specific types of inhibitory interneurons, corticotropin-releasing hormone (CRH) amacrine cells, in the mouse retina. Genetic tools were used to identify and manipulate CRH cells, which make GABAergic synapses with a well studied ganglion cell type, the ON alpha cell. CRH cells converge with other types of amacrine cells to tonically inhibit ON alpha cells and balance their high level of excitation. CRH cells diverge to different types of ganglion cell, the unique properties of which depend on their balance of excitation and inhibition.

Keywords: GABA; amacrine cell; corticotropin-releasing hormone; mouse retina; optogenetics; retinal ganglion cell.


Figures

Figure 1.
Figure 1.
Amacrine cells in the CRH-ires-Cre mouse line express CRH and costratify with ON alpha ganglion cells. A, Left, CRH-ires-Cre mouse line crossed to a ChR2/YFP reporter line (Ai32) labels mostly amacrine cell bodies (arrows) in the GCL, along with sparse labeling of ganglion cells (arrowhead). Images show average of three confocal sections in a z-stack (1 μm spacing; 40× air lens, NA = 0.75). Center, Antibody labeling for CRH protein. Right, Antibody labeling overlaps with the majority of YFP-expressing amacrine cells. B, Same format as A illustrating overlap between YFP+ dendrites and CRH expression. Images show a single confocal section (40× air lens, NA = 0.75). C, Filled ON alpha ganglion cell (GC). Shown is a collapsed image of multiple confocal sections (20× air lens, NA = 0.8). Dashed box shows area expanded in D. D, Expanded area from C showing an ON alpha ganglion cell dendrite (red) overlaid with CRH amacrine cell dendrites labeled in the CRH-ires-Cre::Ai32 retina (green). Image shows a single confocal section (40× oil lens, NA = 1.4). E, Fluorescence profile of ON alpha dendrites (n = 4 cells) with YFP+ processes in the CRH-ires-Cre::Ai32 retina normalized to the positions of peak fluorescence for the inner and outer ChAT bands (i.e., processes labeled by antibody against ChAT; see Materials and Methods). Fluorescence was normalized to the maximum value in the range of the inner plexiform layer (IPL) (−1.2 to 1.8 in normalized units of the x-axis) before averaging across cells. Error bars indicate ± SEM of normalized fluorescence across cells. The approximate locations of the GCL and inner nuclear layer (INL) are illustrated (gray bars) and align with peaks in the ChAT label (near −2 and +2 normalized units), reflecting the position of ChAT+ cell bodies. A small peak in the CRH-Cre signal around +0.8 reflects the position of OFF alpha ganglion cell dendrites, which are labeled sparsely in this Cre line (Zhu et al., 2014).
Figure 2.
Figure 2.
CRH amacrine cells make GABAergic synapses with ON alpha ganglion cells. A, Optogenetic experiment showing that CRH cells make synapses with ON alpha cells. A blue light (450 nm peak, 5.3 × 10¹⁷ quanta [Q] s−1 cm−2) was presented to stimulate ChR2 expressed in CRH cells while recording inhibitory current (Vhold = 0 mV) in an ON alpha ganglion cell. Responses were averaged over the time period indicated by the gray bar. The IPSC was blocked by SR95531 (50 μm). There were no responses in a direction-selective ganglion cell (DSGC) or an OFF delta ganglion cell. B, Optogenetically evoked current increased with light intensity for ON alpha cells, but not DSGC (middle row) or OFF delta ganglion cells (bottom row). Error bars indicate ± SEM across cells. C, SR95531 blocked the response in four ON alpha cells. Data from individual cells are shown in both conditions connected by a line. Error bars on the average data points indicate ± SEM across cells. D, Paired-cell recording of a CRH-1 cell and an ON alpha cell. Top trace shows the voltage command in the CRH-1 cell. Middle trace shows the CRH-1 cell current, which includes a transient inward Ca current after depolarization to 0 mV and a sustained outward leak current. Bottom trace shows the IPSC in an ON alpha cell (Vhold = ECl) during and after the depolarizing voltage step. The response was measured over the time period indicated by the gray bar.
Figure 3.
Figure 3.
CRH amacrine cells are divided into three cell types. A, Left, CRH-1 cell has a medium-field dendritic tree that typically exhibits an irregular branching pattern. Image shows the collapsed confocal z-stack of a cell filled with Lucifer yellow; this image has been converted to grayscale with inverted contrast. Middle, CRH-1 cell responds to modulations in contrast (spot stimulus, 800 μm diameter) via graded changes in membrane potential, with hyperpolarization to negative contrast (relative to the mean luminance) and depolarization to positive contrast. Right, Average depolarizing and hyperpolarizing responses for a population of cells. Responses were measured in a 50 ms time window near the peak depolarizing or hyperpolarizing response before averaging across cells. Error bars indicate ± SEM across cells. B, Same format as A for CRH-2 cells. Left, Image showing a drawing of the large-field of processes based on confocal images. Some processes extended off the field of view. Middle, CRH-2 cell fires action potentials to positive contrast. Right, Firing rate to positive and negative contrast measured across cells. C, Same format as B for CRH-3 cells. Di, Dii, Confocal image (single sections, 40× oil, NA = 1.4) showing inner (Di) and outer (Dii) processes of the CRH-2 cell in B, which costratify with ON and OFF bipolar cell terminals, respectively. Scale bar applies to both images. E, Confocal image showing processes of the CRH-3 cell in C. F, Dendritic tree versus stratification for CRH-1, CRH-2, and CRH-3 cells and the four ON alpha cells from Figure 1. Stratification was defined by the peak fluorescence, as in Figure 1. CRH-1, CRH-3, and the inner processes of CRH-2 cells stratified at a similar depth in the inner plexiform layer (IPL) between the inner ChAT band and the GCL. CRH-2 outer processes are stratified near the INL. The dendritic tree diameter for CRH-2 and CRH-3 cells was not measured accurately because of incomplete fills in most cases, but all cells were apparently > 1000 μm diameter. G, Small number of YFP+ cells in the CRH-ires-Cre::Ai32 line were colabeled by the nNOS antibody (arrow) and were presumed to be CRH-2 cells (Zhu et al., 2014).
Figure 4.
Figure 4.
Evidence that ON alpha cells make synapses with CRH-3 but not CRH-2 cells. A, Optogenetically evoked IPSCs in ON alpha cells in the CRH-ires-Cre::Ai32 line are partially sensitive to blocking sodium channels with TTX (1 μm). Responses to blue light stimulation (5.3 × 10¹⁷ Q s−1 cm−2) were averaged over a 50 ms time window near the peak (gray bar). Results from six ON alpha cells are shown at right. Individual cells are shown with lines connecting the control and TTX conditions. Population data show mean ± SEM. B, CRH-1 cell voltage responses, measured over a 50 ms time window (gray bar), were not affected by TTX. Results from three CRH-1 cells are shown at right (same format as A). C, An ON alpha cell dendrite (red) costratifies with YFP+ processes in the nNOS-CreER::Ai32 retina. The ganglion cell was filled with Lucifer yellow (LY) followed by reaction with LY primary antibody and a Cy5 secondary antibody (converted to red); the double labeling of the ganglion cell dendrite reflects colabeling with Lucifer yellow and Cy5 (single confocal section, 40× oil, NA = 1.4). D, Optogenetic stimulation (5.3 × 10¹⁷ Q s−1 cm−2) drove depolarization and spiking in a CRH-2/NOS-1 cell recorded in current-clamp (top trace), but failed to evoke an IPSC in an ON alpha ganglion cell (bottom trace).
Figure 5.
Figure 5.
CRH-1 and CRH-3 cells respond over a range of stimulus conditions. A, Responses of a CRH-1 cell to two levels of stimulus contrast presented at two levels of mean luminance. The stimulus was a contrast-modulated spot (0.4 mm diameter), and the responses show an average of two trials. B, Same format as A for a CRH-3 cell (1 mm diameter spot; single trials). C, Average contrast response function for a sample of CRH-1 cells (n = 5). Response were quantified by measuring the peak-to-trough amplitude of voltage modulations, with extreme depolarizing and hyperpolarizing periods averaged over 200 ms time windows. Error bars indicate SEM across cells. D, Same as C for CRH-3 cells (n = 5). Responses were quantified by measuring the modulation of the firing rate and subtracting a minimum rate from a maximum rate averaged over 500 ms time windows. CRH-3 response amplitudes were more sensitive to contrast at the lower mean luminance. E, Same as D showing the firing rate at positive contrast (ON response; open symbols) and negative contrast (OFF response; filled symbols). The rate plotted at 0% contrast (gray-filled symbols) indicates baseline firing at mean luminance.
Figure 6.
Figure 6.
ON alpha cells receive feedforward inhibition at both positive and negative contrast. A, CRH-1 cell voltage response to two stimuli followed by a switch to darkness. Stimulus was a contrast-modulated spot (100% contrast, 1000 μm diameter) at 2 temporal frequencies (0.5 or 5 Hz) with a background set to the mean luminance. Inset in the middle column shows an expanded view of the 5 Hz response. Relative to the resting potential (solid horizontal line), the cell hyperpolarized near the dark potential (dashed horizontal line; i.e., membrane potential after the switch from mean luminance to dark background measured over 50 ms) during periods of negative contrast at both temporal frequencies. B, Same format as A for a CRH-3 cell recording. C, Same format as A for excitatory current recorded in an ON alpha cell. The current is suppressed (i.e., moves outward) near the dark current (dashed line) during periods of negative contrast at both temporal frequencies. D, Same format as C for inhibitory current recorded in the same ON alpha cell. During periods of negative contrast, the inhibition persisted and was not fully suppressed to the level near the dark current (dashed line). E, Summary data of NMI across cells showing that CRH-1 and CRH-3 voltage and ON alpha cell excitatory current are suppressed near the dark voltage/current in normalized coordinates (where 1 = dark current/potential; and 0 = resting current/potential). The ON alpha cell inhibitory current NMI was significantly less than the values measured in CRH-1 voltage, CRH-3 voltage, or ON alpha excitatory current at both 0.5 and 5 Hz. For 0.5 Hz stimulation, responses were measured within a 200 ms time window positioned within 500 ms after the transition to negative contrast. For 5 Hz stimulation, responses were measured within 15–20 ms time windows positioned within 100 ms after the transition to negative contrast. Population data show mean ± SEM across cells. F, Voltage-clamp recording of a CRH-1 cell. During negative contrast, the tonic excitatory current was suppressed, whereas the inhibitory current did not increase above baseline. Inhibition instead increased during positive contrast. G, Same format as F for a CRH-3 cell, which showed a similar pattern of synaptic input as the CRH-1 cell.
Figure 7.
Figure 7.
CRH cell GABA release onto ON alpha cells does not fully modulate at a high temporal frequency. A, Optogenetically evoked inhibition in an ON alpha cell (Vhold = 0 mV) evoked by blue light stimulation in the CRH-ires-Cre::Ai32 retina. In this control (con) condition, drugs were applied to block glutamate signaling and thereby suppress photoreceptor-mediated responses (see Results). The light switched from darkness to a mean level followed by sinusoidal modulation at either 5 or 0.5 Hz. Inset for trace at left shows the modulation at 5 Hz. During the negative phase at 5 Hz, the IPSC in the ON alpha cell persisted (arrowhead, dotted line) and did not modulate to the baseline level measured before stimulus onset (dashed line). Mean light intensity = 2.4 × 10¹⁷ Q s−1 cm−2. Sinusoidal modulation varied from darkness to twice the mean. B1, Same format as A for a second cell recorded with TTX (1 μm) applied to block voltage-gated Na channels and thereby suppressing spikes in presynaptic CRH-3 cells. B2, Same format as B1 but with the order of the two frequencies reversed. C, Same format as A but for a voltage recording of a CRH-3 cell. D, Same format as C but for a voltage recording of a CRH-1 cell. E, Same format as D but for an excitatory current recording of a CRH-1 cell. F, NMI calculated as in Figure 6E, where 1 = baseline current before stimulus onset and 0 = average current measured over 1 s before the sinusoidal stimulus. The 0.5 and 5 Hz temporal frequencies (fstim) were presented in two orders (blue points: 5 Hz followed by 0.5 Hz; red points: 0.5 Hz followed by 5 Hz; data from the same cell are connected by a line), which had no obvious effect on the results. Black points and error bars indicate mean ± SEM across cells (combined across both stimulus orders). For the ON alpha cell IPSC, the index is near 1 for the 0.5 Hz modulation, indicating that the synapse could completely suppress release, whereas the index was significantly lower at 5 Hz modulation. The low NMI of ON alpha IPSCs at 5 Hz persisted with TTX application, implicating a low-pass filtering of CRH-1 synapses; this was only partially explained at the level of CRH-1 voltage responses.
Figure 8.
Figure 8.
OFF-pathway inhibition converges with ON-pathway inhibition onto ON alpha cells. A, Voltage-clamp measurements of excitation and inhibition in an ON alpha cell under control conditions and after applying L-AP4 (20 μm), followed by L-AP4 + SR95531 (SR, 50 μm), followed by L-AP4 + SR + strychnine (STRY, 1 μm). Traces are shown on the same current scale (y-axis). A horizontal line shows the level where current is apparently most suppressed across conditions (see final drug condition). B, Same format as A except SR and STRY were added in the reverse order. In both A and B, the inhibitory response converts from ON-dominated to OFF-dominated in the presence of L-AP4. The OFF-pathway inhibition persists in either SR (A) or STRY (B), but is blocked in the presence of both drugs. In both A and B, a small OFF-dominant modulation of excitation is present in the final drug condition (inset). C, Summary showing inhibition measured in the ON and OFF phase in all drug conditions and for both drug orders. ON-pathway inhibition was blocked by L-AP4 and remained blocked when additional drugs were added. OFF-pathway inhibition emerged in L-AP4 and persisted when either SR or STRY was added alone; the combination of all drugs blocked OFF-pathway inhibition. Responses were measured within a 50–100 ms time window relative to the holding current before stimulus onset. D, Model for pharmacology effects showing ON and OFF bipolar cells (BCs) and amacrine cells (ACs) and the recorded ganglion cell (GC) with presumed connectivity. Excitatory synapses are black; inhibitory synapses are green. L-AP4 blocks all ON-pathway synapses by hyperpolarizing ON BCs, which apparently relieves inhibition of OFF-pathway cells and thereby increase inhibition of the ON alpha GC during negative contrast relative to the control condition.
Figure 9.
Figure 9.
Circuit diagrams for ON alpha and SbC ganglion cells. ON alpha and SbC ganglion cells show opposite responses to positive contrast, which is apparently explained by differing ratios of excitation (e) and inhibition (i). Synaptic inputs during positive contrast (ON response) are shown within the dashed rectangle. Both ganglion cell types receive excitatory input from ON bipolar cells (BCs), including type 6 BCs, and ON-pathway inhibitory input from CRH-1 amacrine cells (ACs); both types receive additional ON-pathway inhibitory input from either the AII AC (SbC) or the CRH-3 cell (ON alpha). Both ganglion cell types also receive converging input from OFF-pathway ACs: either unknown AC types (ON alpha, SbC) or the VGluT3 AC (SbC cell). The SbC cell also receives excitatory synapses from OFF BCs (data not shown). The opposite responses to positive contrast by the ON alpha and SbC ganglion cells are apparently explained by the different balances of excitation and inhibition in the two circuits despite their common categories of synaptic input: ON alpha cells have relatively higher excitation (e > i), whereas SbC cells show the opposite ratio (i > e).

References

    1. Akrouh A, Kerschensteiner D (2015) Morphology and function of three VIP-expressing amacrine cell types in the mouse retina. J Neurophysiol 114:2431–2438. 10.1152/jn.00526.2015 - DOI - PMC - PubMed
    1. Ala-Laurila P, Greschner M, Chichilnisky EJ, Rieke F (2011) Cone photoreceptor contributions to noise and correlations in the retinal output. Nat Neurosci 14:1309–1316. 10.1038/nn.2927 - DOI - PMC - PubMed
    1. Applebury ML, Antoch MP, Baxter LC, Chun LL, Falk JD, Farhangfar F, Kage K, Krzystolik MG, Lyass LA, Robbins JT (2000) The murine cone photoreceptor: a single cone type expresses both S and M opsins with retinal spatial patterning. Neuron 27:513–523. 10.1016/S0896-6273(00)00062-3 - DOI - PubMed
    1. Ashmore JF, Copenhagen DR (1983) An analysis of transmission from cones to hyperpolarizing bipolar cells in the retina of the turtle. J Physiol 340:569–597. 10.1113/jphysiol.1983.sp014781 - DOI - PMC - PubMed
    1. Baden T, Schubert T, Chang L, Wei T, Zaichuk M, Wissinger B, Euler T (2013) A tale of two retinal domains: near-optimal sampling of achromatic contrasts in natural scenes through asymmetric photoreceptor distribution. Neuron 80:1206–1217. 10.1016/j.neuron.2013.09.030 - DOI - PubMed

Publication types

Substances

LinkOut - more resources