. 2018 Mar 23;9(1):1214.
doi: 10.1038/s41467-018-03682-2.

A neuronal basis for fear discrimination in the lateral amygdala

Affiliations

A neuronal basis for fear discrimination in the lateral amygdala

Anna Grosso et al. Nat Commun. .

Abstract

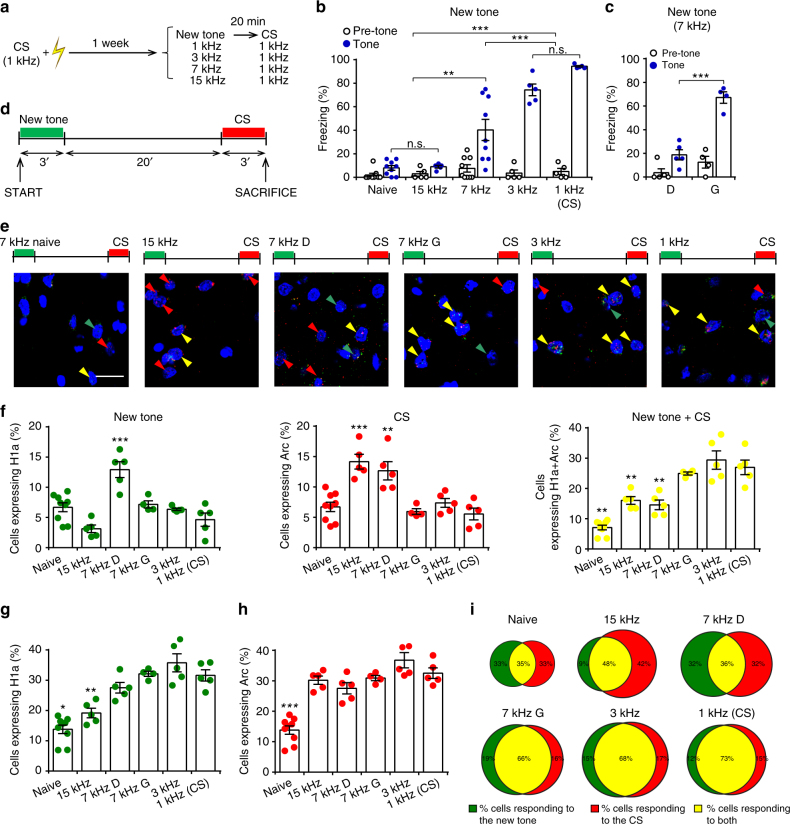
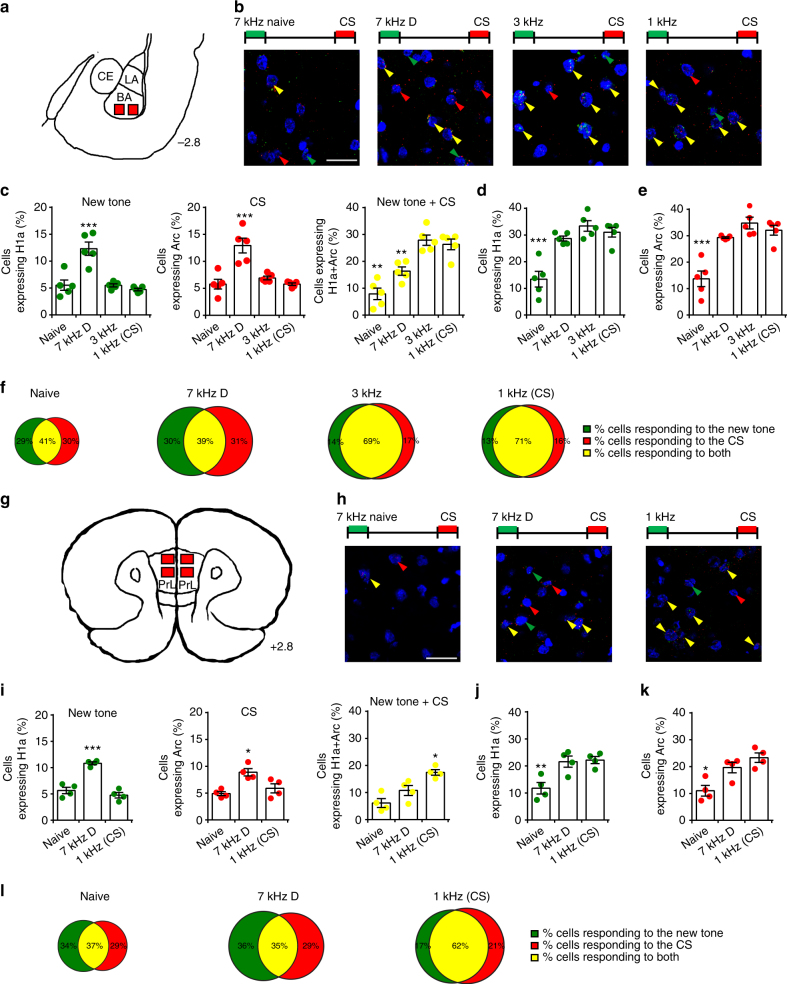
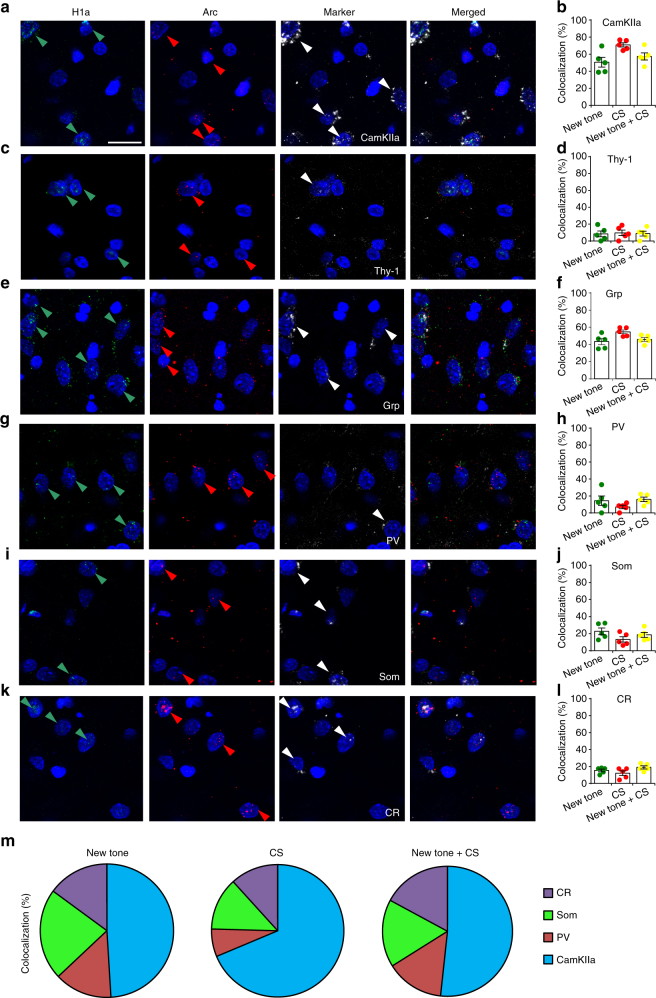
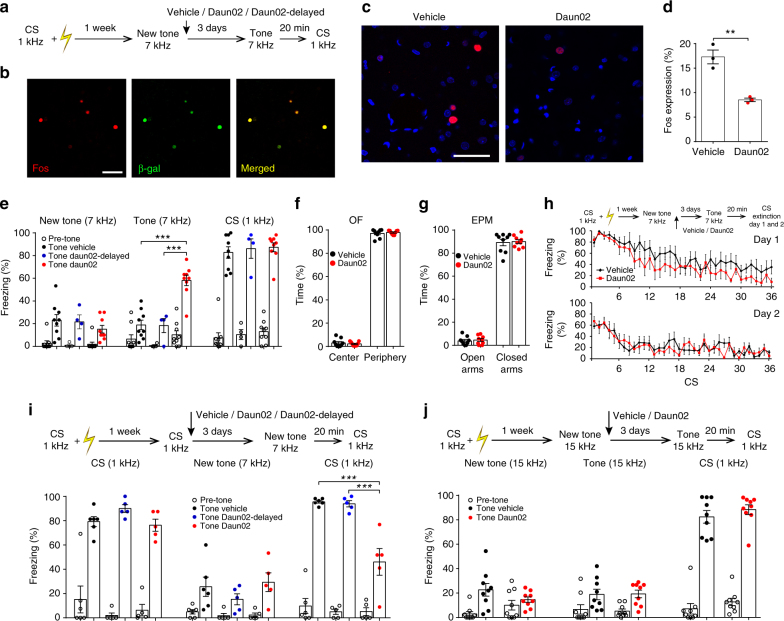
In the presence of new stimuli, it is crucial for survival to react with defensive responses in the presence of stimuli that resemble threats but also to not react with defensive behavior in response to new harmless stimuli. Here, we show that in the presence of new uncertain stimuli with sensory features that produce an ambiguous interpretation, discriminative processes engage a subset of excitatory and inhibitory neurons within the lateral amygdala (LA) that are partially different from those engaged by fear processes. Inducing the pharmacogenetic deletion of this neuronal ensemble caused fear generalization but left anxiety-like response, fear memory and extinction processes intact. These data reveal that two opposite neuronal processes account for fear discrimination and generalization within the LA and suggest a potential pathophysiological mechanism for the impaired discrimination that characterizes fear-related disorders.


Conflict of interest statement

The authors declare no competing interests.

Figures

Fig. 1
Fig. 1
LA activity following the presentation of novel and threatening cues. a Experimental design of behavioral and catFISH experiments, see Methods. Naive n = 9, 15 kHz, n = 5; 7 kHz, n = 9; 3 kHz, n = 5; and 1 kHz, n = 5. CS conditioned stimulus. b The percentage of freezing following the new tone presentation progressively increased in similarity to the CS (F(4, 28) = 36.32, P < 0.001). The freezing of naive and 15 kHz animals was similar (P > 0.05) and, in the meantime, it was lower than freezing of other groups (P < 0.01). Freezing of 7 kHz animals was different also from 3 kHz and 1 kHz (CS) group (P < 0.001). c Freezing in “discriminator” animals (D, n = 5) was lower than that observed in “generalizer” (G, n = 4) animals during the 7 kHz tone delivery (P < 0.001). d Time course of catFISH experiments. e Representative images showing neurons expressing single nuclear H1a (green arrows) and Arc (red) mRNA expression and double-labeled cells (yellow) in the naive, 15 kHz, 7 kHz (discriminators and generalizers), 3 kHz, and 1 kHz groups. Scale bar, 20 µm. f Dot plots showing the percentage of cells activated following new tone presentation (expressing only H1a), CS presentation (only Arc), and during both events (expressing both Arc and H1a). These results revealed an increase in H1a (new tone)- or Arc (CS)-expressing neurons and a decrease in double-labeled cells in the “discriminator” group (F(5, 27) = 13.68 (left), P < 0.001; F(5, 27) = 12.68, P < 0.001 (middle); F(5, 27) = 30.28, P < 0.001 (right)). Raw data were expressed as a number of neurons labeled for Arc, H1a or both mRNA divided for the all counted neuronal nuclei analyzed. For each animal, we then calculated the mean of these raw data. g The total rate of H1a was lower in both the naive and the 15 kHz groups than in the other groups (F(5, 27) = 24.67, P < 0.001). h The total rate of Arc was lower in the naive rats (F(5, 27) = 28.39, P < 0.001). i Venn diagrams showing the percentage of H1a- (green), Arc- (red), and double- (yellow) labeled neurons in LA in the different experimental conditions. Diagrams’ size was scaled on the basis of H1a or Arc total ratios, and percentages were calculated by dividing the number of H1a-, Arc-, and double-labeled neurons for the total number of cells activated in at least one of the two events. *P < 0.05, **P < 0.01, ***P < 0.001. All data are mean and SEM. One-way ANOVA with Newman–Keuls test (b, f, i, j)
Fig. 2
Fig. 2
catFISH analysis of BA and PrL revealed that different neuronal populations are activated by a new tone or CS presentation. a catFISH analysis in the basal amygdala (BA). The section diagram was drawn on the basis of our DAPI-stained sections. CE central amygdala, LA lateral amygdala. b Representative images showing single-labeled H1a (green arrows)- and Arc (red arrows)-expressing cells, and double-labeled cells (yellow arrows) in the naive (n = 5), 7 kHz D (discriminators, n = 5), 3 kHz (n = 5) and 1 kHz (n = 5) groups. Scale bar, 20 µm. c In BA, following new tone and CS presentation, the percentage of H1a- or Arc-expressing cells was higher in the 7 kHz D group than in other groups (F(3, 16) = 19.57, P < 0.001 (left); F(3, 16) = 16.41, P < 0.001 (middle); F(3, 16) = 23.67, P < 0.001 (right)). d Total rates of H1a (F(3, 16) = 19.44, P < 0.001) or e Arc (F(3, 16) = 20.78, P < 0.001) were lower in the naive than in the other groups. f Scaled Venn diagrams showing the percentage of H1a (green), Arc (red), and H1a + Arc (yellow) expressing neurons in BA in the different behavioral groups. The neuronal populations activated during both new tone or CS presentation in 7 kHz D group were less overlapping with respect to other groups. g catFISH was performed in the layers II-III of the prelimbic cortex (PrL). The section diagram was drawn on the basis of our DAPI-stained sections. h Images showing H1a and Arc nuclear expression in the naive, 7 kHz D and 1 kHz groups. i In PrL, the percentages of cells single-labeled for H1a or Arc were significantly higher in the 7 kHz D group than in the naive and 1 kHz groups (F(2, 9) = 44.82 (left), P < 0.001; F(2, 9) = 9.91, P < 0. 01 (middle)). Conversely, the percentage of double-labeled cells was lower in both the 7 kHz and the naive group than in the 1 kHz group (F(2, 9) = 13.55, P < 0. 01 (right)). j The total rates of both H1a (F(2, 9) = 9.76, P < 0. 01) and k Arc (F(2, 9) = 10.93, P < 0. 01) were lower in the naive group than in the 7 kHz D and 1 kHz groups. l In PrL, scaled Venn diagrams indicated that in 7 kHz D group the neuronal populations activated during new tone or CS presentation were less overlapped with respect to other groups. *P < 0.05, **P < 0.01, ***P < 0.001. All data are mean and SEM. One-way ANOVA with Newman–Keuls test (c, d, e, h, i, j)
Fig. 3
Fig. 3
Neuronal characterization of different subpopulations activated in the discriminator rats following a new tone or CS presentation within the LA. a Representative photomicrograph of triple catFISH showing neurons expressing H1a(green arrows), Arc (red), and CamKIIa (white) mRNAs. The merged panel shows nuclei that were single-, double- or triple-labeled for H1a, Arc, and CamKIIa. Scale bar, 20 µm. b Dot-plots graphs showing the percentage of cells coexpressing either H1a (new tone) or Arc (CS) or H1a + Arc (new tone + CS) with CamKIIa. c Images of triple catFISH showing expression of H1a, Arc, and Thy-1 mRNAs. d The percentages of cells coexpressing Thy-1 and either H1a or Arc or those coexpressing H1a + Arc were low and similar among the three conditions. e Images showing the expression of Arc, H1a, and Grp mRNAs. f The percentages of cells coexpressing Grp and either H1a or Arc or both mRNAs were high and similar among the three conditions. g Photomicrographs showing neuronal expression of H1a, Arc, and Parvalbumin (PV) mRNAs. h The percentages of cells coexpressing PV were similar in neurons that were activated following the presentation of the new tone or the CS. i Images showing triple catFISH for Arc, H1a, and Somatostatin (SOM) mRNAs. j The percentages of cells coexpressing SOM with Arc, H1a, or H1a + Arc were similar following the presentation of the new tone or the CS. k Images of triple catFISH showing the mRNA expression of H1a, Arc, and Calretinin (CR). l There were no differences in the percentages of cells coexpressing CR with H1a, Arc, or H1a + Arc. m Pie charts summarizing the percentages of cells in different subpopulations of neurons that were activated by the new tone, CS or both, according to the expression of different neuronal markers. All data are mean and SEM
Fig. 4
Fig. 4
LA neurons activated by a new tone presentation are necessary for fear discrimination processes. a Experimental design for the Daun02 inactivation technique, see Methods for details. Daun02 (n = 9),Vehicle (n = 9), “Daun02-delayed” group (n = 4). b New tone presentation induced Fos (red nuclei) and β-galactosidase (green nuclei) expression in LA neurons. The merged panel shows nuclei that were double-labeled for β-galactosidase and Fos (yellow). Scale bar, 100 µm. c Photomicrographs of Fos-stained LA neurons in the Vehicle- (left) and Daun02-injected (right) rats at 90 min after 7 kHz sound presentation. Scale bar, 50 µm. d There were more Fos-positive cells in the Vehicle- than in the Daun02-injected animals. e Freezing response of the three groups (“Vehicle”, “Daun02-delayed”, and “Daun02”) during new tone (7 kHz) presentation was similar among groups. After Daun02 injection, freezing to the 7 kHz tone was higher than in the two control groups (3 × 2 mixed ANOVA, main effect of group: F(2, 19) = 7.25, P < 0.01, main effect of trial: F(1, 19) = 9.23, P < 0.01, group × trial interaction: F(2, 19) = 20.07, P < 0.001, simple main effect of group in post-injection trial: F(2, 19) = 24.13, P < 0.001). Freezing to the CS was similar between groups (one-way ANOVA: P > 0.05). f, g In open field (OF) and elevated plus maze (EPM) tests, there were no differences between Vehicle and Daun02 groups. h No differences were detected during extinction sessions (n = 6 rats in each group). i In another experimental group, Daun02 (n = 5 rats), Daun02-delayed (n = 5), or Vehicle (n = 6 rats) was injected after CS presentation. Three days later, both a new tone and the CS were presented. Freezing responses to CS in the Daun02-injected animals were decreased (3 × 2 mixed ANOVA, main effect of group: F(2, 13) = 15.36, P < 0.001, main effect of trial: F(1, 13) = 0.80, P > 0.05, group × trial interaction: F(2, 13) = 14.11, P = 0.001, simple main effect of group in post-injection trial: F(2, 13) = 20.57, P < 0.001), but there were no differences between groups during new tone presentation (one-way ANOVA: P > 0.05). j Daun02 administration following the presentation of a new 15 kHz tone did not modify freezing to either this tone or to CS (n = 9 rats in each group). **P < 0.01, ***P < 0.001. All data are mean and SEM. Unpaired t test (d, j); one-way ANOVA (e, i); 3 × 2 mixed ANOVA (e, i); 2 × 2 mixed ANOVA (f, g, j); 2 × 7 mixed ANOVA (h). See Supplementary Note 1 for a more detailed description of statistical results of this figure

References

    1. Pavlov, I. P. Conditioned Reflexes (Oxford University Press, London, 1927).
    1. Likhtik E, Paz R. Amygdala–prefrontal interactions in (mal)adaptive learning. Trends Neurosci. 2015;38:158–166. doi: 10.1016/j.tins.2014.12.007. - DOI - PMC - PubMed
    1. Ghirlanda S, Enquist MA. A century of generalization. Anim. Behav. 2003;66:15–36. doi: 10.1006/anbe.2003.2174. - DOI
    1. Dunsmoor JE, Paz R. Fear generalization and anxiety: behavioral and neural mechanisms. Biol. Psychiatry. 2015;78:336–343. doi: 10.1016/j.biopsych.2015.04.010. - DOI - PubMed
    1. Bergstrom HC. The neurocircuitry of remote cued fear memory. Neurosci. Biobehav. Rev. 2016;71:409–417. doi: 10.1016/j.neubiorev.2016.09.028. - DOI - PubMed

Publication types