. 2018 Mar 23;8(1):5146.
doi: 10.1038/s41598-018-22872-y.

Diversity of innate immune cell subsets across spatial and temporal scales in an EAE mouse model

Affiliations

Diversity of innate immune cell subsets across spatial and temporal scales in an EAE mouse model

Céline Caravagna et al. Sci Rep. .

Abstract

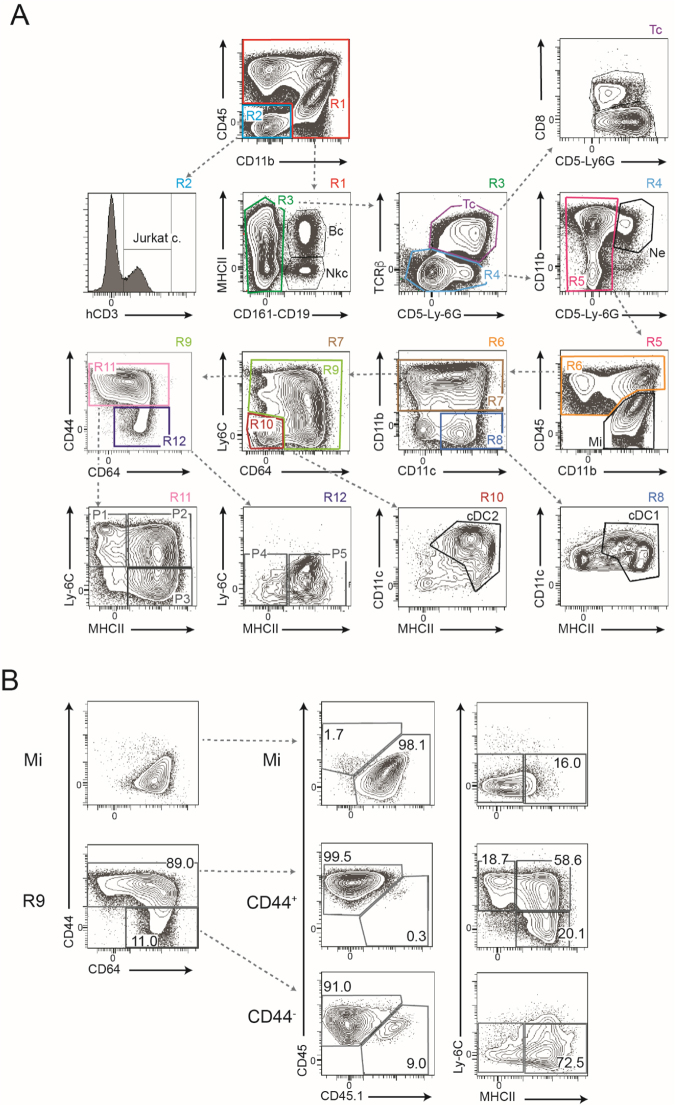
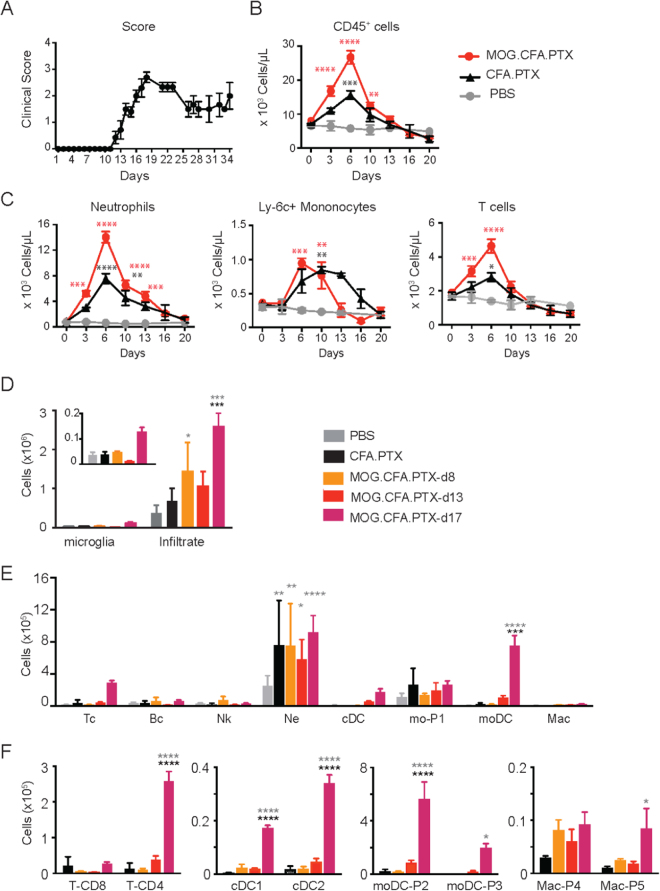
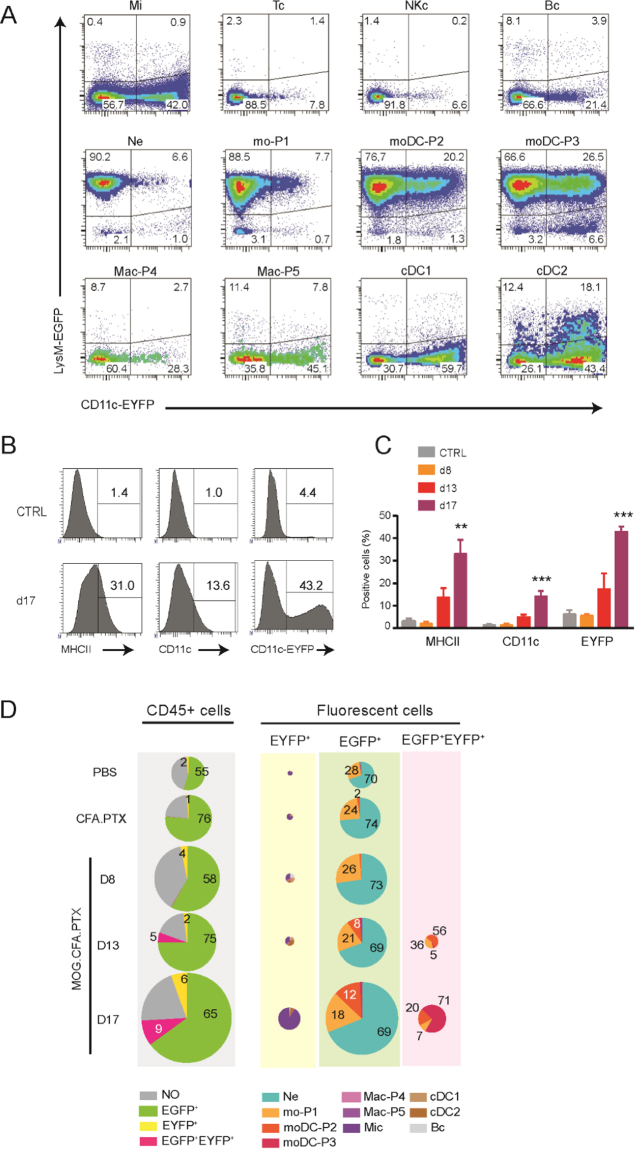
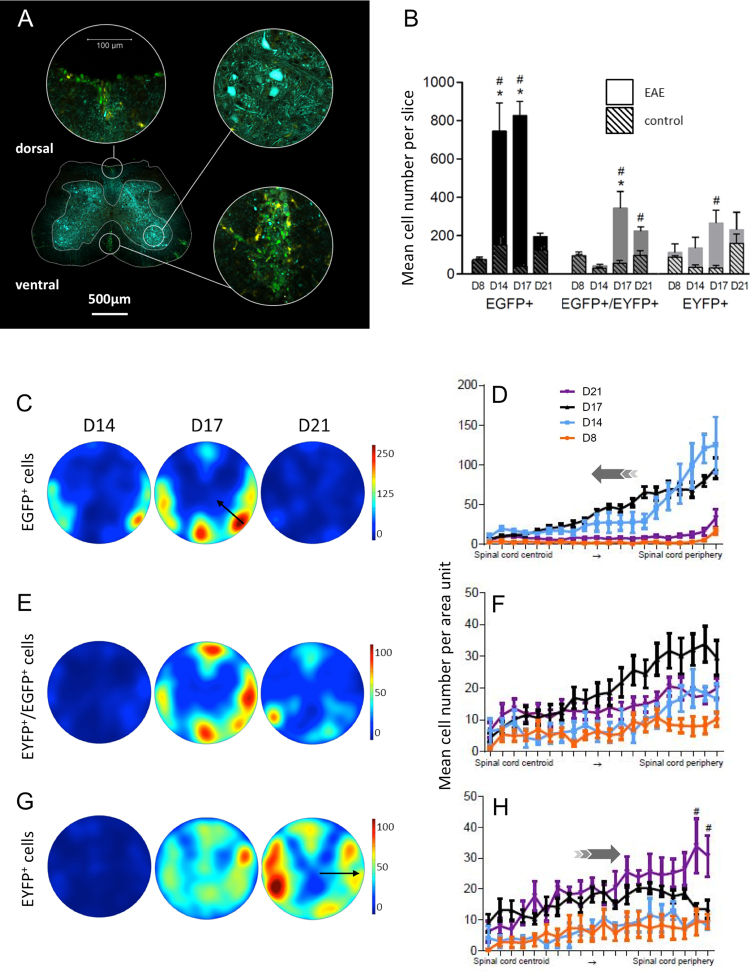
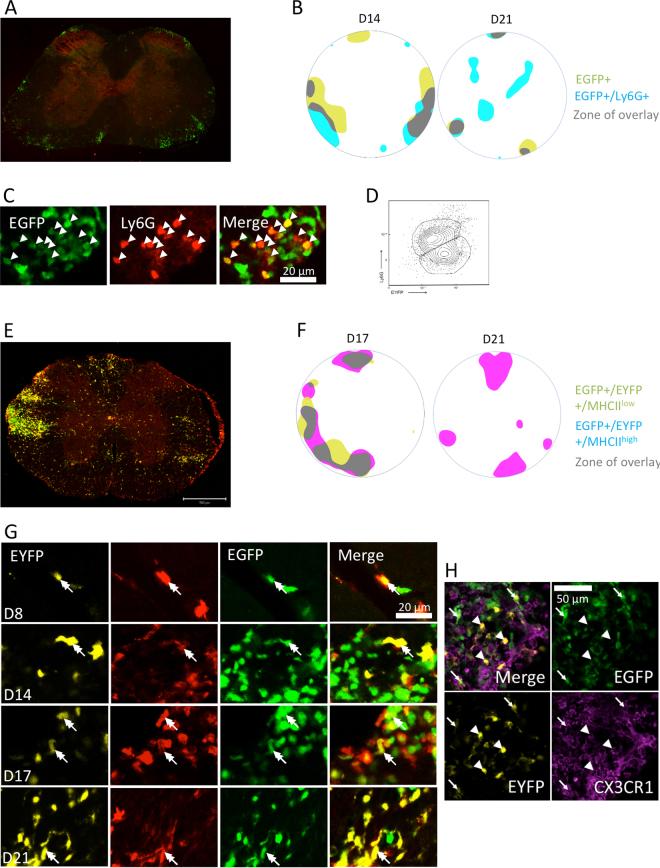
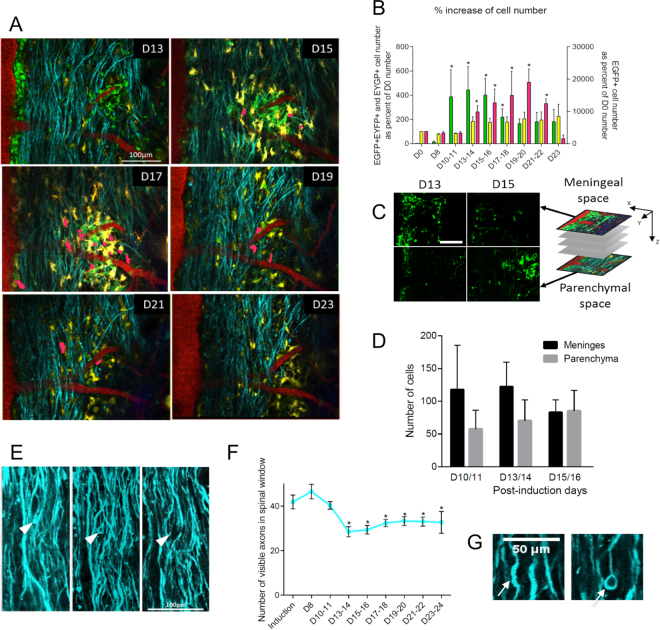
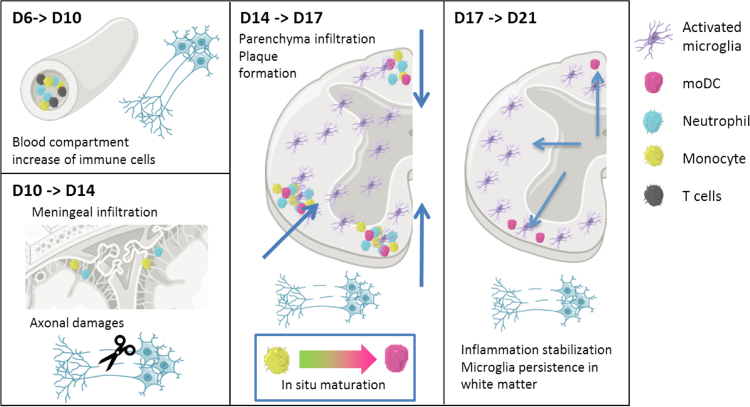
In both multiple sclerosis and its model experimental autoimmune encephalomyelitis (EAE), the extent of resident microglia activation and infiltration of monocyte-derived cells to the CNS is positively correlated to tissue damage. To address the phenotype characterization of different cell subsets, their spatio-temporal distributions and contributions to disease development we induced EAE in Thy1-CFP//LysM-EGFP//CD11c-EYFP reporter mice. We combined high content flow cytometry, immunofluorescence and two-photon imaging in live mice and identified a stepwise program of inflammatory cells accumulation. First on day 10 after induction, EGFP+ neutrophils and monocytes invade the spinal cord parenchyma through the meninges rather than by extravasion. This event occurs just before axonal losses in the white matter. Once in the parenchyma, monocytes mature into EGFP+/EYFP+ monocyte-derived dendritic cells (moDCs) whose density is maximal on day 17 when the axonal degradation and clinical signs stabilize. Meanwhile, microglia is progressively activated in the grey matter and subsequently recruited to plaques to phagocyte axon debris. LysM-EGFP//CD11c-EYFP mice appear as a powerful tool to differentiate moDCs from macrophages and to study the dynamics of immune cell maturation and phenotypic evolution in EAE.


Conflict of interest statement

The authors declare no competing interests.

Figures

Figure 1
Figure 1
Gating strategy used for analyzing all immune cells within the CNS at steady state or during inflammatory conditions. (A) Starting from the upper left panel and going down following the arrows in dotted lines, we gated successively: CD45+ cells (R1) and human Jurkat cells (hCD3+)in R2, B cells (Bc) and NK cells (NKc) in R1, TCRαβ+ T cells in R3 (Tc, further subdivided in CD8+ and CD8 Tc), neutrophils (Ne) in R4, microglia (Mi) in R5, monocytes P1 and moDCs P2-P3 in R11 and P4-P5 macrophages in R12. Conventional DC were gated in R10 (cDC2 or CD11b+DC) and R8 (CD11bDC or cDC1). R1 to R12 in the contour plots indicate the number of the corresponding gate. For each contour plot the represented gate is indicated on the right side above the plot. (B) Validation of microglia and monocyte-derived cell gating using bone marrow chimeric mice. Top 3 panels represent microglia (Mi). The 5 lower panels represent monocyte-derived cells (R9). For each category, the original gating (CD44-CD64 plot) is shown on the left, the recipient (CD45.1) versus donor origin of the population in the middle and the maturation status Ly-6C-MHCII plot on the right. The percentage is indicated in each gate. (A) is representative of brain at day 17 and (B) of brain at day 15.
Figure 2
Figure 2
Quantification of blood circulating immune cells and SC infiltrated immune cells during EAE progression. Two way (AC) or one way (DF) uncorrected ANOVA were used to compare every time point of EAE animals against PBS (grey) or CFA.PTX (black) control conditions. *p < 0.05, **p < 0.01, ***p < 0.005 and ****p < 0.001. (A) Clinical scores of EAE mice as a function of time. Clinical score remained null for PBS or CFA.PTX injected mice and are thus not represented. (B) Quantification of total blood circulating CD45+ cells at different post-EAE induction times. (C) Quantification of the number of circulating neutrophils, Ly6C+ monocytes and T cells in CD45+ cells presented in B. (D) Quantification of microglial cells versus infiltrating cells in SC. (inset) Microglia section is zoomed for a better visualization. (E) Quantification of the most representative populations of infiltrated cells. (F) Quantification of subclasses of T cells, conventional DCs, moDCs and macrophages. Datas are represented as mean value ± SEM. (AC) Significant differences between MOG.CFA.PTX and PBS are indicated as red stars and between CFA.PTX and PBS as black stars. (D–F) Significant differences between MOG.CFA.PTX and CFA.PTX are indicated as black stars and between CFA.PTX and PBS as grey stars. Populations abbreviations are: T cells (Tc), B cells (Bc), NK cells (NK), neutrophils (Ne), conventional DCs (cDC), monocytes (mo-P1), monocyte-derived DCs (moDC), macrophages (Mac).
Figure 3
Figure 3
Characterization of the fluorescently labeled immune cells in Thy1-CFP//LysM-EGFP//CD11c-EYFP mice. (A) LysM-EGFP and CD11c-EYFP expression in microglia and the various immune cell types infiltrating the CNS during EAE progression. Multicolor contour plots for immune cells extracted from brain at day 17: Microglia (Mi), T cells (Tc), NK cells (NKc), B cells (B), neutrophils (Ne) monocytes (mo-P1), moDCs (moDC-P2 and moDC-P3), macrophages (Mac-P4 and Mac-P5), conventional DC (cDC1 and cDC2). (B) Distribution histograms for microglia cells of control (CTRL) and at day 17 (d17) SCs. (C) Bar graph showing the expression of MHC class II, CD11c and CD11c-EYFP in microglia cells of control (CTRL) and day 17 (d17) SCs. The percentages of positive cells are indicated on the histograms and their evolution is presented as bar graphs. One way uncorrected ANOVA was used to compare every time point of EAE animals against PBS (grey) or CFA.PTX (black) control conditions. *p < 0.05, **p < 0.01, ***p < 0.005 and ******p < 0.001. (D) Quantification and distribution of fluorescent cells during EAE in SC. In the first column, the distribution of CD45+ cells in EGFP+, EYFP+ or EGFP+/EYFP+ fluorescence channel is represented for control (PBS or CFA.PTX) or induced (MOG.CFA.PTX) mice at day 8, 13 or 17. The 3 columns on the right show the relative numbers of fluorescence cells and their characterization using the gating strategy. The pie chart sizes are proportional to the total number of cells. The numbers indicate the percentage of the corresponding population.
Figure 4
Figure 4
Dorso-ventral localization of EYFP+ and EGFP+ cells in coronal SC slices. (A) Infiltration of EGFP+ and EYFP+ cells in the SC of a triple fluorescent EAE mouse at day 17 post-induction. Edges of the slice were highlighted with dotted lines. Scale bar 500 µm. Zoomed images in white matter plaques or grey matter regions. Green: EGFP+ cells. Yellow: EYFP+ cells. Cyan: CFP+ neurons. (B) Bar graphs showing EGFP+, EYFP+ and EGFP+/EYFP+ cell quantification in SC slices from EAE (Plain) and CFA.PTX control (Hatched) mice. Black: EGFP+ cells. Grey: EGFP+/EYFP+ cells. Light grey: EYFP+ cells. Star: significant evolution compared to day 8 within a group of subjects. Sharp sign: intergroup significance at a given time point (n = 3–4). EGFP cell number is higher in EAE SC compared to control at both D14 (Non-parametric Mann-Whitney test: p = 0.016) and D17 (Non-parametric Mann-Whitney test: p = 0.029). EYFP cell number is higher in EAE SC compared to control at D17 (Non-parametric Mann-Whitney test: p = 0.03). EYFP/EGFP cell number is higher in EAE SC compared to control at D17 (Non-parametric Mann-Whitney test: p = 0.016) and D21 (Non-parametric Mann-Whitney test: p = 0.029). (C,E,G). Color coded average maps of cell densities in SC slices (n = 3–5 for each time point and condition) at different post induction days (D). (D,F,H) Distribution of cells density from the center to the periphery of the density maps over time. Average number of cells present in each concentric circular band of the map, for all SC slices (see supplementary methods & figures). Gray arrows show the direction of cells progression: (D) from the periphery to the center; (H) from the center to the periphery. (C,D) EGFP+ cells. (E,F) EGFP+/EYFP+ cells. (G,H) EYFP+ cells. EGFP cells are more numerous at the periphery compared to center of slices at both D14, D17 (Non-parametric Kruskal-Wallis test: p < 0.0001) and D21 (Non-parametric Kruskal-Wallis test: p = 0.01). EGFP/EYFP cells are more numerous at the periphery compared to center of slices at both D17 and D21 (Non-parametric Kruskal-Wallis test: p < 0.0001). EYFP cells are less numerous at the periphery at D17 compared to D21 (Non-parametric Mann-Whitney test: p = 0.0002).
Figure 5
Figure 5
Patterned distribution of infiltrated immune cells in SC slices. (A) Ly6G+ immunostained coronal slice of a LysM-EGFP+/CD11c-EYFP+ SC 14 days after EAE induction. EGFP+ cells (green) and Ly6G+ (red). (B) Average density maps of EGFP+ (yellow) and EGFP+/Ly6G+ (blue) cell 14 and 21 days after EAE induction. Regions of overlap are shown in grey. (C) High magnification image inside a plaque 17 days post-induction. EGFP+ cells (green) and Ly6G+ (red). EGFP+//Ly6G+ are neutrophils (arrow heads) and EGFP+/Ly6G− monocytes-P1. Note that all Ly6G+ cells are also EGFP+ (arrow heads). (D) Cluster representation of the population of EGFP+ cells detected in the slices, according to their expression of Ly6G+, 14 days after EAE induction. (E) MHCII+ immunostained SC coronal slice of a LysM-EGFP//CD11c-EYFP mouse 17 days after EAE induction. EYFP+ cells (yellow), EGFP+ cells (green), MHCII labeling (red). Scale bar: 200 µm. (F) Average density maps of EGFP+/EYFP+/MHCIIlow (yellow) and EGFP+/EYFP+/MHCIIhigh (pink) cells 17 and 21 days after EAE induction. Regions of overlaps are shown in grey. (G) High resolution image of a plaque showing a MHCII+/EGFP+/EYFP+ cell (double-headed arrow) Scale bar: 20 µm. (H) High resolution image of a plaque at D21 showing EYFP+/EGFP/CX3CR1+ (microglia; arrow heads) and EYFP+/EGFP+/CX3CR1+ (moDC; arrows) cells. Scale bar 50 µm.
Figure 6
Figure 6
In vivo visualization of immune cell dynamics during EAE progression. EGFP+ cells (green), EYFP+ cells (yellow), EGFP+/EYFP+ cells (pink, manually highlighted), CFP+ neurons (cyan), blood vessels (red), type 2 collagen (dura mater, Blue). D = post-induction day. (A) Dynamics of cell distribution during EAE at different post-induction days. Scale bar: 100 µm. (B) Evolution of immune cell densities relative to pre-induction values. EGFP+ cells (green), EYFP+ cells (yellow), EGFP+/EYFP+ cells (pink). EGFP cell number changes during EAE (Non-parametric Kruskal-Wallis test: p = 0.001), starting at D10-11 (Non-parametric Mann-Whitney test: p = 0.029). EGFP/EYFP cell number changes during EAE (Non-parametric Kruskal-Wallis test: p = 0.005), starting at D13-14 (Non-parametric Mann-Whitney test: p = 0.044). EYFP cell number does significantly change during EAE (Non-parametric Kruskal-Wallis test: p = 0.635). (n = 9, *p < 0.05 compared to induction). (C) Depth-dependent gradient of EGFP+ cells at D13 and D15. Note the initial meningeal accumulation of cells and subsequent infiltration into the tissue. Scale bar 100 µm. (D) Quantification of EGFP+ cells in meningeal and deep parenchyma areas at days post-induction 10/11, 13/14 and 15/16. Black bars: meningeal area. Grey bars: parenchyma area. (E) Evolution of identified individual axons at different post-induction days. Arrow head points to a damaged axon. Scale bar 100 µm. (F) Evolution of the number of CFP+ axons in determined regions of interest at different stages of EAE progression. Axon number evolves during EAE (Non-parametric Kruskal-Wallis test: p = 0.001), starting at D13-14 (Non-parametric Mann-Whitney test: p = 0.031). (n = 9, *p < 0.05 relative to pre-induction values). (G) Axonal damages: swelling, without (left) or with (right) disconnection of the distal segment. Scale bar 50 µm
Figure 7
Figure 7
In vivo characterization of neuroimmune interactions. (A) Phagocytosis of axon debris by EYFP+ and EGFP+ cells. Phagocytic activity is associated with ramified morphology while motile cells that are non-phagocytic present elongated morphologies (n = 5). Middle panel presents phagocytic EYFP+ and EGFP+ cells either in their multicolor cellular environnement (left) or as a single channel image (right). Arrow point to phagocytic bodies. Scale bar 20 µm. (B) Quantification of the three main classes of morphologies for EGFP+ and EYFP+ cells: ameboid, elongated, ramified. (C) Evolution of the distributions of EGFP+ and EYFP+ cell morphologies during the course of the pathology (n = 5, D = post-induction day. *p < 0.05). The proportion of phagocytic (red) and motile (blue) cells is overlaid on the bar graphs.
Figure 8
Figure 8
Schematic representation of dynamic events occuring in EAE disease. (1) Activation of blood vessels during diapedesis of MOG specific CD4+ cells followed by accumulation of circulating immune cells and the weakening of BSCB; (2) susbequent infiltration of EGFP+ neutrophils and P1 monocytes via the meninges that is concomitant with axonal losses in the white matter (scissors). (3) This infiltrate would activate microglia, involved both in shaping the molecular environment and phagocytosis of the axon debris all over the spinal cord. Evolution of the chemical cues between D14 and D17 would be responsible for differentiation/maturation of monocytes into EGFP+/EYFP+ moDCs during their migration deep into the tissue. (4) Their APC phenotype would subsequently trigger a selective antigen specific immune response while dampening microglial activation. Activated microglia accumulate in peripheral white matter plaques and recover a resting phenotype by D21, while moDCs disappear. Figure was made using Servier Medical Art under Creative Commons Attribution 3.0 Unported License https://creativecommons.org/licenses/by/3.0/, no changes have been made to the material.

References

    1. Croxford AL, Kurschus FC, Waisman A. Mouse models for multiple sclerosis: historical facts and future implications. Biochim. Biophys. Acta. 2011;1812:177–83. doi: 10.1016/j.bbadis.2010.06.010. - DOI - PubMed
    1. Williams KC, Ulvestad E, Hickey WF. Immunology of multiple sclerosis. Clin. Neurosci. 1994;2:229–45. - PubMed
    1. Ransohoff RM. Animal models of multiple sclerosis: the good, the bad and the bottom line. Nat. Neurosci. 2012;15:1074–7. doi: 10.1038/nn.3168. - DOI - PMC - PubMed
    1. Ajami B, Bennett JL, Krieger C, McNagny KM, Rossi FMV. Infiltrating monocytes trigger EAE progression, but do not contribute to the resident microglia pool. Nat. Neurosci. 2011;14:1142–9. doi: 10.1038/nn.2887. - DOI - PubMed
    1. Goverman J. Autoimmune T cell responses in the central nervous system. Nat. Rev. Immunol. 2009;9:393–407. doi: 10.1038/nri2550. - DOI - PMC - PubMed

Publication types

MeSH terms