. 2018 Mar 23;9(1):1216.
doi: 10.1038/s41467-018-03609-x.

The orphan GPR50 receptor promotes constitutive TGFβ receptor signaling and protects against cancer development

Affiliations

The orphan GPR50 receptor promotes constitutive TGFβ receptor signaling and protects against cancer development

Stefanie Wojciech et al. Nat Commun. .

Abstract

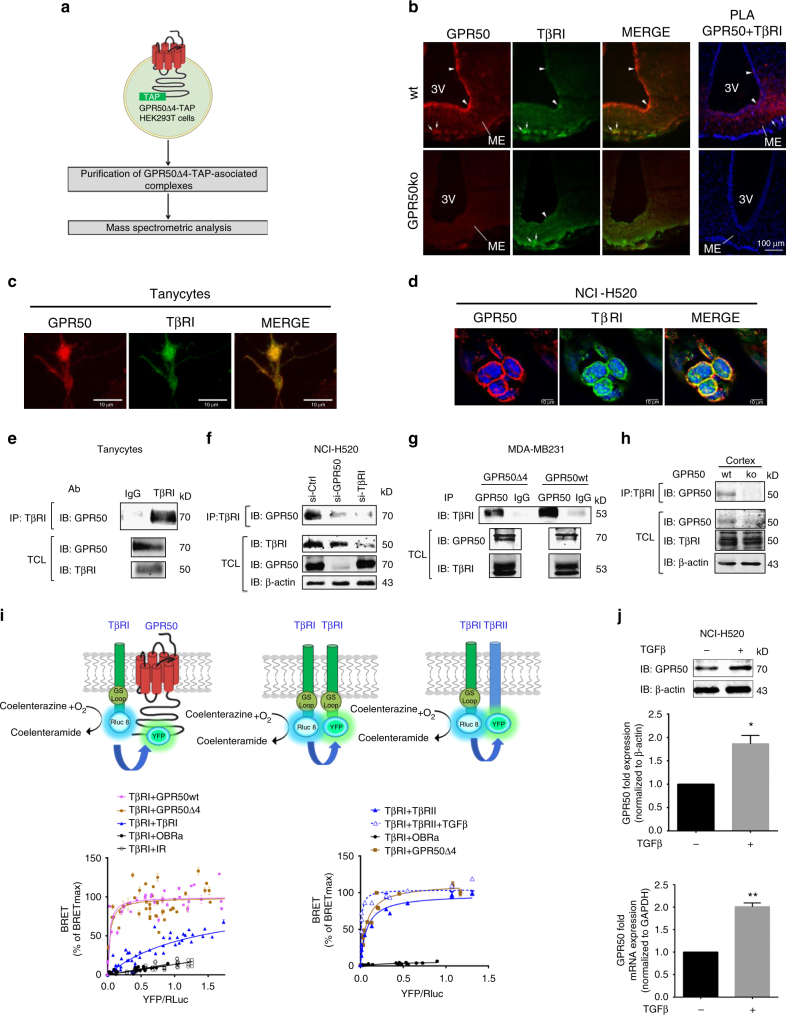
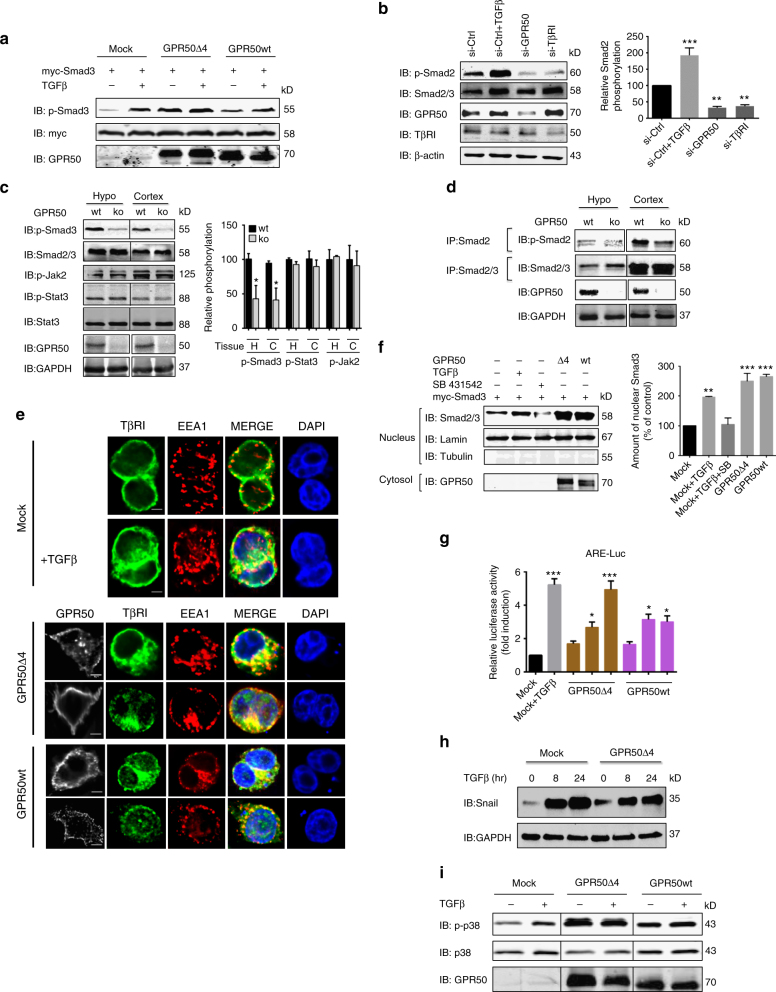
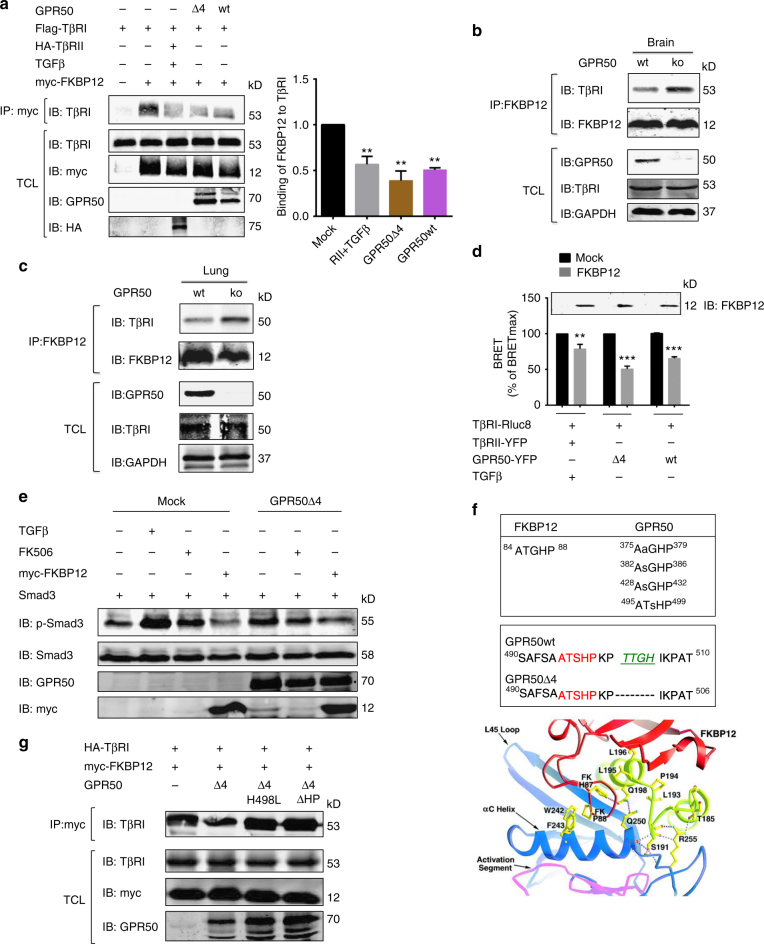
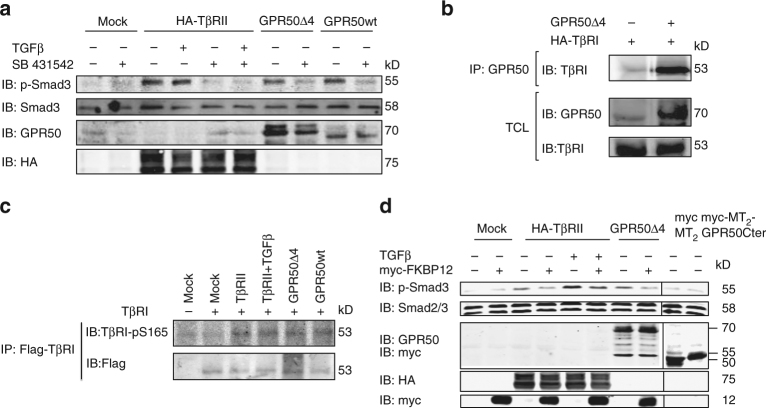
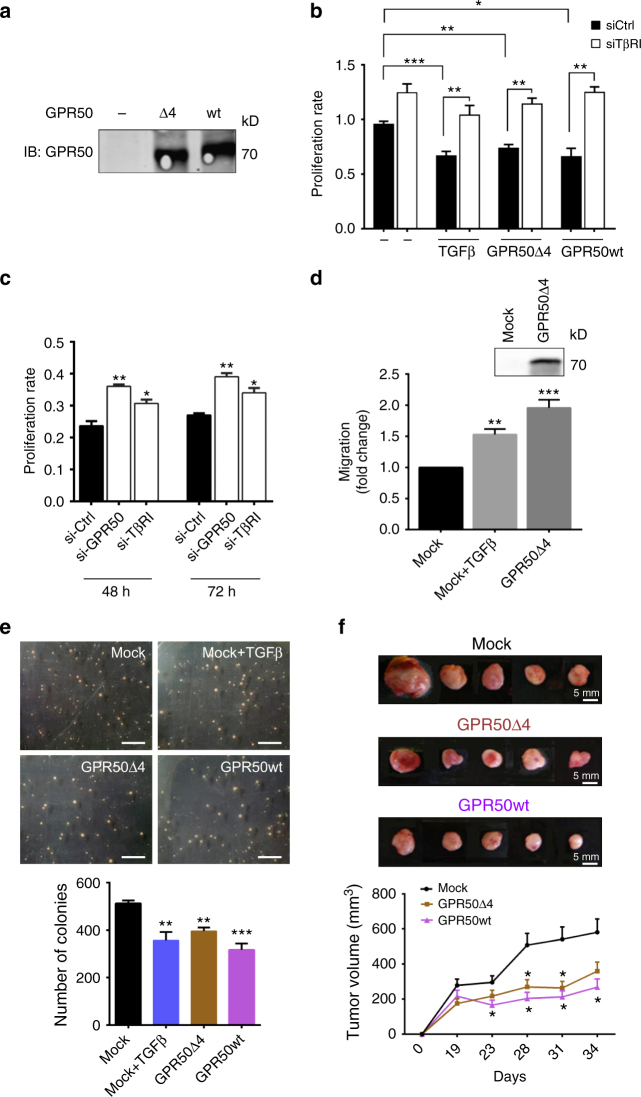
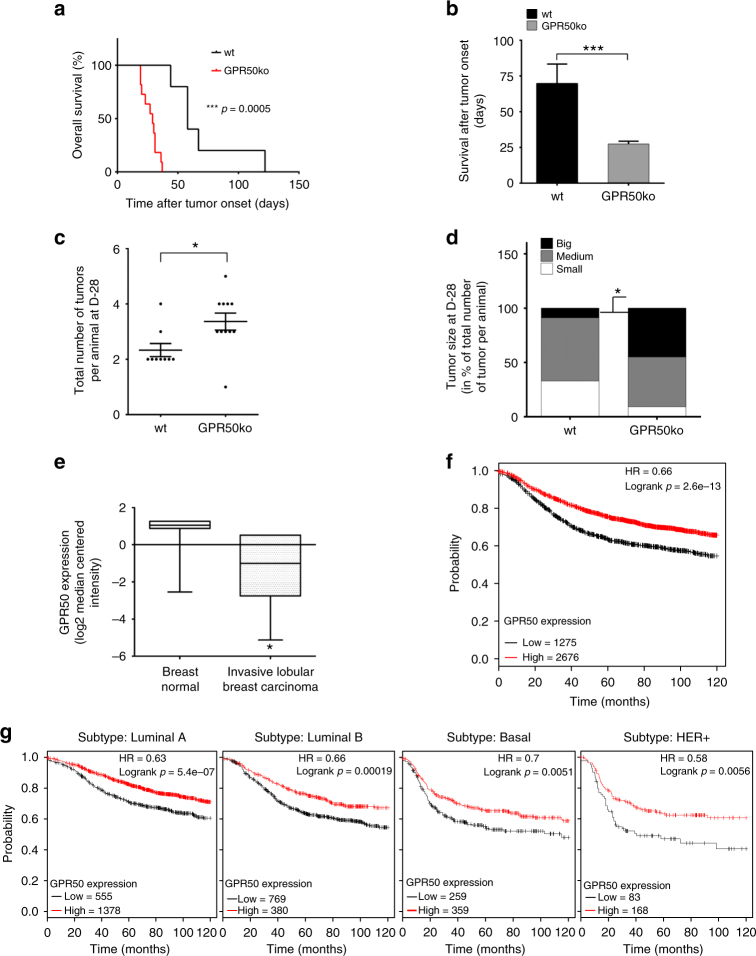
Transforming growth factor-β (TGFβ) signaling is initiated by the type I, II TGFβ receptor (TβRI/TβRII) complex. Here we report the formation of an alternative complex between TβRI and the orphan GPR50, belonging to the G protein-coupled receptor super-family. The interaction of GPR50 with TβRI induces spontaneous TβRI-dependent Smad and non-Smad signaling by stabilizing the active TβRI conformation and competing for the binding of the negative regulator FKBP12 to TβRI. GPR50 overexpression in MDA-MB-231 cells mimics the anti-proliferative effect of TβRI and decreases tumor growth in a xenograft mouse model. Inversely, targeted deletion of GPR50 in the MMTV/Neu spontaneous mammary cancer model shows decreased survival after tumor onset and increased tumor growth. Low GPR50 expression is associated with poor survival prognosis in human breast cancer irrespective of the breast cancer subtype. This describes a previously unappreciated spontaneous TGFβ-independent activation mode of TβRI and identifies GPR50 as a TβRI co-receptor with potential impact on cancer development.


Conflict of interest statement

The authors declare no competing interests.

Figures

Fig. 1
Fig. 1
GPR50 interacts with TβRI and its expression is upregulated by TGFβ. a Tandem affinity purification of naive HEK293T cells stably expressing GPR50Δ4-TAP. After purification, mass spectrometry was employed for protein identification. b Left panel shows confocal images of GPR50 and TβRI staining in the lining of the third ventricle of brain slices of wt (top) and GPR50ko mice (bottom). Right panel visualizes TβRI/GPR50 interaction by proximity ligation assay (PLA) in the median eminence (ME) and third ventricle (3 V) of wt (top) and GPR50ko (bottom) mice (scale: 100 µm). White arrows depict immunoreactive (IR) regions. See also Supplementary Fig. 1a. c Confocal images of GPR50 (red) and TβRI (green) staining in primary rat tanycytes (scale: 10 µm). d Colocalization of GPR50 (red) and TβRI (green) in NCI-H520 cells. (scale: 10 µm). e Co-immunoprecipitation of GRP50 and TβRI in lysates of primary rat tanycyte cultures. Lysates with IgG served as negative control. f Co-immunoprecipitation of GRP50 and TβRI in the lysates of NCI-H520 after silencing either GPR50 (si-GPR50) or TβRI (si-TβRI). Control si-RNA (si-Ctrl) served as control. g, h Co-immunoprecipitation of GRP50 and TβRI in lysates of MDA-MB231 cells (g) and cortex (h) isolated from wild type (wt) or GPR50ko mice. IgG served as negative control. i Upper part depicts schematic representation of BRET assay to study the interaction between TβRI-Rluc8 and GPR50-YFP or TβRI-YFP (left and middle scheme) and right scheme between TβRI-Rluc8 and TβRII-YFP. Lower part shows BRET donor saturation curves in HEK293T cells (left: constant expression level of TβRI-Rluc8 and increasing levels of TβRI-YFP, GPR50Δ4-YFP or GPR50wt-YFP; right: constant expression level of TβRI-Rluc8 and increasing levels of GPR50Δ4-YFP or TβRII-YFP with TGFβ stimulation (0.6 nM, 30 min at 37 °C)). IR-YFP and OBRa-YFP served as negative control. BRET signals were normalized to BRETmax values. Curves are obtained from three independent experiments performed in triplicates. j NCI-H520 cells were starved and stimulated for 24 h with TGFβ (2 ng/mL). GPR50 expression was checked by Immunoblotting and Q-PCR. (Mean ± s.e.m., n = 3 independent experiments, *p < 0.05; **p < 0.01, two-tailed unpaired Student’s t-test). Representative results are shown for eh and i. See also Supplementary Fig. 1
Fig. 2
Fig. 2
GPR50 promotes ligand-independent activation of TβRI signaling. a HEK293T cells expressing myc-Smad3, and GPR50Δ4 or GPR50wt were starved overnight and stimulated with TGFβ (2 ng/mL; 1 h). Smad3 phosphorylation was checked. Similar results were obtained in at least two additional experiments. b p-Smad2 detection in NCI-H520 cells following the silencing of GPR50 and TβRI Control si-RNA (si-Ctrl) with and without TGFβ stimulation (2 ng/mL; 1 h) served as control. Densitometric analysis of three independent experiments (Mean ± s.e.m., n = 3 independent experiments, ***p < 0,001, one-way ANOVA with Dunnett’s post hoc test). c, d Detection of p-Smad3, p-Stat-3, p-Jak2 (c) and p-Smad2 (d) in lysates of hypothalamus and cortex of wt and GPR50ko mice. p-Smad2 was detected after precipitation of total Smad2/3. Quantification is shown on the right side of panel c. H hypothalamus, C cortex; Densitometric analysis of three independent experiments (Mean ± s.e.m., n = 3 independent experiments, **p < 0.01, two-tailed unpaired t-test). e Confocal images of HeLa cells expression GPR50 and TβRI alone or together showing TβRI colocalization with early endosome marker (EEA1) with TGFβ stimulation (scale: 10 µm). f (Left panel) Nuclear extracts of HEK293T cells treated with TGFβ (2 ng/mL, 1 h) and SB431542 (10 µM; O/N) and expressing indicated proteins. (Right) Densitometric analysis of three independent experiments (Mean ± s.e.m., n = 3 independent experiments, *p < 0.05, **p < 0.01, one-way ANOVA with Dunnett’s post hoc test). g HeLa cells were transfected with a a Firefly-Luciferase-coupled ARE- (together with FAST-2) reporter gene construct and Renilla Luciferase for normalization. The cells were transfected with empty (Mock± TGFβ; 0.5 ng/mL, 8 h) or 10, 50 and 100 ng of GPR50Δ4 and GPR50wt constructs (Mean ± s.e.m., n = 3 independent experiments, *p < 0.05, ***p < 0.001 one-way ANOVA with Dunnett’s post hoc test). h 4T1 cells stably expressing either empty plasmid (Mock) or GPR50∆4 were stimulated with TGFβ (2 ng/mL; 0, 8, 24 h). Snail expression was analyzed by immunoblotting. i HEK293T cells expressing indicated plasmids as in (a) and stimulated with TGFβ (2ng/mL, 1 h) to reveal p-p38 protein. Representative results are shown for a, d, e, h, i. Similar results were obtained in at least two additional experiments. See also Supplementary Fig. 2
Fig. 3
Fig. 3
GPR50 competes with FKBP12 for the binding to TβRI. a (Left) HEK293T cells were transfected with Flag-TβRI alone or cotransfected with HA-TβRII (with TGFβ; 2 ng/mL; 1 h), myc-FKBP12 and either GPR50Δ4 or GPR50wt. Lysates were precipitated for FKBP12 using anti-myc antibody and blotted with an anti-Flag to reveal complex formation. Expression of myc-FKBP12, Flag-TβRI, HA-TβRII and GPR50 was determined in total lysates. (Right) Densitometric analysis of 3 independent experiments (Mean ± s.e.m., n = 3 independent experiments, **p < 0.01, one-way ANOVA with Dunnett’s post hoc test). b, c Competition between FKBP12 and GPR50 for TβRI binding was checked by precipitating FKBP12 from total brain and lung lysates of wt and GPR50ko mice and revealed with anti-TβRI. Total lysate was addressed for expression of FKBP12, TβRI, and GPR50 with corresponding antibodies. d To address the competition of FKBP12 and GPR50 for TβRI binding, BRET measurements were performed with HEK293T cells expressing fixed amounts of TβRI-Rluc8 and GPR50Δ4-YFP or GPR50wt-YFP or TβRII-YFP and stimulated with TGFβ (0.6 nM, 30 min, 37 °C). Immunoblot on the top shows FBP12 expression when transfected either with empty (Mock) or FKBP12 in different conditions. e HEK293T cells expressing the indicated proteins were starved and treated for 1 h with 2 ng/ml of TGFβ or 100 ng/ml of FK506. Total lysates were immunoblotted for Smad3 phosphorylation and total expression of myc-Smad3, GPR50 and myc-FKBP12 with suitable antibodies. f Alignment of FKBP12 and GPR50 sequences revealed similarities between the C-terminal “ATGHP” motif in FKBP12 and four repetitive motifs in GPR50 (upper top panel). One motif of GPR50 is located close to the Δ4 deletion of GPR50Δ4 (lower bottom panel). Structural data with permission adapted from Huse et al. highlight the implication of the HP loop (red) in binding to TβRI (lower panel). g HEK293T cells were transfected with indicated plasmids and as in a. Lysates were precipitated for FKBP12 using an anti-myc antibody and blotted with an anti-TβRI to reveal complex formation. Expression of myc-FKBP12, HA-TβRI, and GPR50 was determined in total lysates. Representative results are shown for b, c, e, and g. Similar results were obtained in at least two additional experiments. See also Supplementary Fig. 3
Fig. 4
Fig. 4
GPR50 phosphorylate and activate TβRI independently of TβRII. a SNU638 cells were transfected with the indicated plasmids, stimulated for 1 h with TGFβ (2 ng/mL) and pretreated or not overnight with SB431542 at 10 µM. p-Smad3 and total Smad3 levels and expression of transfected plasmids were determined by western blot in cell lysates. b Co-immunoprecipitation of GRP50 and TβRI in lysates of SNU638 cells expressing HA-TβRI alone or together with GPR50Δ4. Total lysates were used as expression control (c) SNU638 cells were transfected with the indicated plasmids, stimulated TGFβ (2 ng/mL, 1 h). Total TβRI was immunoprecipitated with anti-Flag antibody and immunoblotted for anti-TβRIp-S165. Below, the same blot was immunoblotted with anti-Flag to show the amount of TβRI precipitation in cell lysates. d Phospho-Smad3 and Smad2/3 levels were determined in lysates of SNU638 cells stimulated or not with TGFβ (2 ng/mL, 1 h) and expressing the indicated proteins (as verified by western blot). The myc-MT2 melatonin receptor and the myc-MT2-GPR50Cter served as negative controls. Representative results are shown for all the panels. Similar results were obtained in at least two additional experiments. See also Supplementary Fig. 4
Fig. 5
Fig. 5
GPR50 inhibits cell proliferation and tumor growth in MDA-MB-231 cells. a Expression of GPR50Δ4 and GPR50wt in lysates of MDA-MB-231 cell pools revealed by western blot. b An equal number of MDA-MB-231 cells expressing Mock, GPR50Δ4 or GPR50wt were seeded into 96-well plates, starved and stimulated with TGFβ (2 ng/mL) and transfected with either siRNA against control (si-Ctrl) or TβRI (si-TβRI). The proliferation rate over total amount of cells was measured with the MTT assay 5 days after starvation (Mean ± s.e.m., n = 5 independent experiments, *p < 0.05, **p < 0.01,***p < 0.001 one-way ANOVA with Tukey multiple comparison post hoc test). c Proliferation rate of NCI-H520 cells at 48 h and 72 h after transfecting control si-RNA (si-Ctrl), GPR50 si-RNA (si-GPR50) or TβRI si-RNA (si-TβRI). The graph is representative of five independent experiments. (Mean ± s.e.m., n = 5 independent experiments, *p < 0.05, **p < 0.01, one-way ANOVA with Dunnett’s post hoc test). d A wound healing assay and live-cell imaging was used to assess the cell migration properties of 4T1 cells stably expressing either empty vector (Mock) or GPR50∆4 plasmid in presence or absence of TGF-β during 24 h. Top inset blot shows expression of GPR50∆4 in 4T1 stable cells (Mean ± s.e.m., n = 3 independent experiments, **p < 0.01, ***p < 0.001 one-way ANOVA with Dunnett’s post hoc test). e Anchorage-independent growth assay of MDA-MB-231 cell pools expressing Mock, GPR50Δ4 or GPR50wt was monitored for 3 weeks, stimulation with TGFβ was done once a week (2 ng/mL). Images in upper panel show an example of colony number and distribution. The lower panel histogram shows the mean value ± SEM of the colony number of four dishes for each condition in one representative experiment (Mean ± s.e.m., n = 3 independent experiments, **p < 0.01,***p < 0.001, one-way ANOVA with Dunnett’s post hoc test). f Xenograft experiment after injection of MDA-MB-231 cell pools into the flanks of nude mice. Images in upper panel show five representative tumors (5/10 for MOCK and GPR50wt and 5/8 for the GPR50Δ4). The graph in the lower panel shows tumor growth during 34 days (Mean ± s.e.m., n = 5, *p < 0.05, two-way ANOVA with unpaired t-test). See also Supplementary Fig. 5
Fig. 6
Fig. 6
Knockout of GPR50 in the MMTV/Neu mouse model. a, b Survival curves of MMTV-Neu-wt and MMTV-Neu-GPR50ko mice where (a) represents overall survival onset (Mean ± s.e.m., WT n = 5, ko n = 11, Kaplan–Meier survival curve analysis with log-rank Mantel–Cox test, ***p < 0.001) and (b) average survival after tumor (Mean ± s.e.m., WT n = 5, ko n = 11, unpaired two-tailed t-test ***p < 0,001). c, d Total number of tumors (c) and size distribution of tumors (d) in MMTV-Neu-wt and MMTV-Neu-GPR50ko mice at day 28 after tumor onset (average survival day of MMTV-Neu-GPR50ko mice) (c mean ± s.e.m., WT n = 9, ko n = 11, unpaired two-tailed t-test *p < 0.05 and d mean ± s.e.m., WT n = 9, ko n = 11, two-way ANOVA with Bonferroni’s test, *p < 0.05). e Box plot showing GPR50 mRNA expression in normal and cancerous breast tissue. Data analysis (unpaired t-test) was performed with the oncomine 3.0 database (oncomine.org; Redvanyi breastdatabase-U52219 reporter), . f, g Kaplan–Meier survival curves for high versus low GPR50 mRNA expression in breast cancer were generated using an integrated database and online tool (http://kmplot.com/breast/). Probability of relapse-free survival in high (red) or low (black) GPR50 expressing breast cancer is compared across all tumors (f) and according to molecular subtypes of breast cancer (g). See also Supplementary Fig. 6 and Supplementary Tables 1-6
Fig. 7
Fig. 7
Proposed Model of GPR50 action on TβRI-mediated signaling In the basal state (upper part), TβRI and TβRII, each form homodimers, that are apart from each other. TβRI is stabilized in its inhibitory confirmation by FKBP12. The R-Smads are non-phosphorylated in the cytosol and no transcription of target genes occurs. In the classical activation mode (lower left side), TGFβ binds to TβRII, which enables recruitment of TβRI into the complex. TβRII phosphorylates TβRI in the GS domain, FKBP12 dissociates from the complex and R-Smad2/3 becomes phosphorylated by TβRI after recruitment into the complex. Phosphorylated R-Smad2/3 dissociates and forms a complex with Smad4, which translocates into the nucleus, and regulates target gene expression. In the case that TβRI forms a complex with GPR50 (and not with TβRII) (lower right side), GPR50 induces the dissociation of FKBP12 from TβRI due to a similar motif of amino acids H87 and P88 in its C-tail on positions 498 and 499. The GPR50/TβRI complex then constitutively activates the classical and non-canonical Smad signaling pathways

References

    1. Shi Y, Massagué J. Mechanisms of TGF-β signaling from cell membrane to the nucleus. Cell. 2003;113:685–700. doi: 10.1016/S0092-8674(03)00432-X. - DOI - PubMed
    1. Massague J. TGFbeta signalling in context. Nat. Rev. Mol. Cell. Biol. 2012;13:616–630. doi: 10.1038/nrm3434. - DOI - PMC - PubMed
    1. Ikushima H, Miyazono K. TGFbeta signalling: a complex web in cancer progression. Nat. Rev. Cancer. 2010;10:415–424. doi: 10.1038/nrc2853. - DOI - PubMed
    1. Massague J. TGFbeta in. Cancer Cell. 2008;134:215–230. - PMC - PubMed
    1. Franzen P, et al. Cloning of a TGF beta type I receptor that forms a heteromeric complex with the TGF beta type II receptor. Cell. 1993;75:681–692. doi: 10.1016/0092-8674(93)90489-D. - DOI - PubMed

Publication types

MeSH terms