. 2018 Mar 23;8(1):5115.
doi: 10.1038/s41598-018-23395-2.

Interpretation of biological experiments changes with evolution of the Gene Ontology and its annotations

Affiliations

Interpretation of biological experiments changes with evolution of the Gene Ontology and its annotations

Aurelie Tomczak et al. Sci Rep. .

Abstract

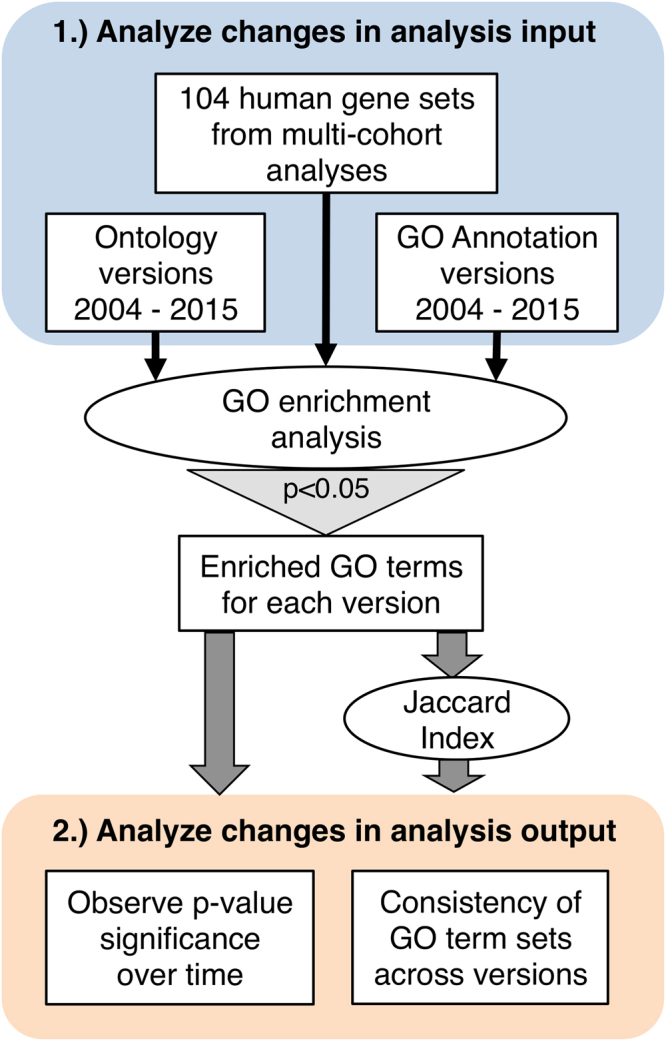
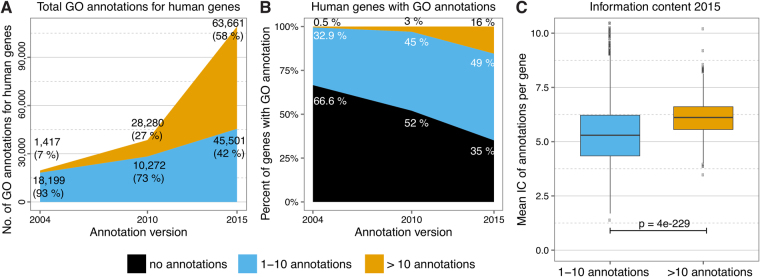
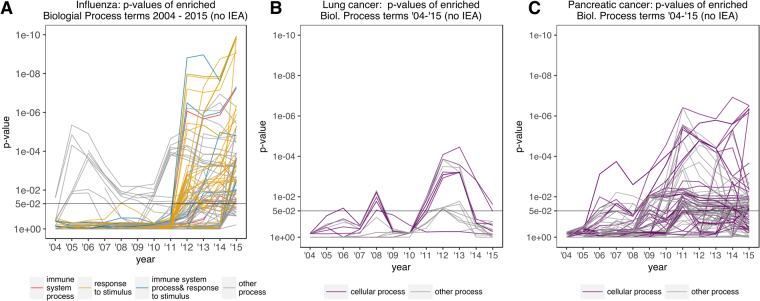
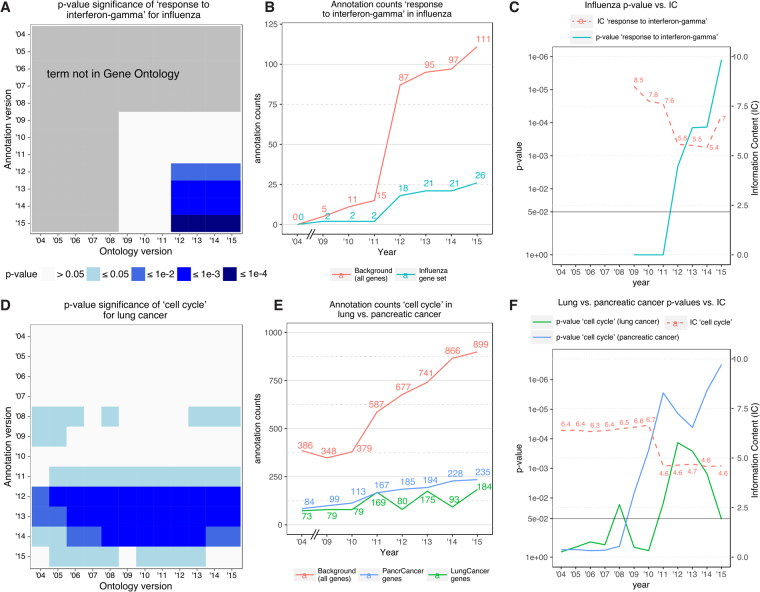
Gene Ontology (GO) enrichment analysis is ubiquitously used for interpreting high throughput molecular data and generating hypotheses about underlying biological phenomena of experiments. However, the two building blocks of this analysis - the ontology and the annotations - evolve rapidly. We used gene signatures derived from 104 disease analyses to systematically evaluate how enrichment analysis results were affected by evolution of the GO over a decade. We found low consistency between enrichment analyses results obtained with early and more recent GO versions. Furthermore, there continues to be a strong annotation bias in the GO annotations where 58% of the annotations are for 16% of the human genes. Our analysis suggests that GO evolution may have affected the interpretation and possibly reproducibility of experiments over time. Hence, researchers must exercise caution when interpreting GO enrichment analyses and should reexamine previous analyses with the most recent GO version.


Conflict of interest statement

The authors declare no competing interests.

Figures

Figure 1
Figure 1
Overview of methods. We analyzed (1) changes in input variables of GO enrichment analyses and (2) how those changes affected enrichment analysis results over time.
Figure 2
Figure 2
Gene ontology annotation developments, human genome, 2004 to 2015. (A) Number of GO annotations and their distribution across poorly characterized (blue) and well-characterized (gold) human genes over time. (B) GO annotation status of the human genome (2004 vs. 2015). Genes are classified by annotation status in uncharacterized (black) vs. poorly characterized (blue) vs. well characterized (gold). Only terms relevant for enrichment analysis results were counted (excluding: IEA, ND and cellular component). C) Comparison of the average information content (IC) of poorly characterized vs. well-characterized human genes in 2015 shows that the mean IC for genes with more annotations was higher (p = 4e-229). The same difference was observed in 2004 (p = 2e-19, Supplementary Figure 4).
Figure 3
Figure 3
Significance of biological process GO terms over time with annual GO version updates (year of GO version = year of GO annotation version). Development of p-value significance in GO enrichment analysis result term sets in different GO versions are shown for subsets of significantly enriched biological process GO terms (p-value < 0.05 in at least one GO version) in three representative diseases: (A) influenza, (B) non-small cell lung cancer, and (C) pancreatic cancer. Terms belonging to selected top-level branches in the biological process ontology are indicated in color (e.g. cellular process in violet).
Figure 4
Figure 4
Effect of ontology and annotation version on consistency and significance of GO enrichment analysis results. (A) Effect in influenza for the GO term response to interferon-gamma. (B) Number of human genes annotated with the GO term response to interferon-gamma (including all child terms) in influenza gene set vs. background. (C) Comparison of enrichment p-value and information content (IC) developments with annual updates of GO and GO annotations (year of GO version = year of GO annotation version) for response to interferon-gamma in influenza. (D) GO term enrichment significance for cell cycle in non-small cell lung cancer (see Supplementary Figure 8 for pancreatic cancer). (E) Number of human genes annotated with the GO term cell cycle (including child terms) in pancreatic and non-small cell lung cancer gene sets vs. background (human genome). (F) Comparison of enrichment p-value and IC developments with annual updates of GO and GO annotations for cell cycle in pancreatic and non-small cell lung cancer.

References

    1. Ashburner M, et al. Gene ontology: tool for the unification of biology. The Gene Ontology Consortium. Nat Genet. 2000;25:25–9. doi: 10.1038/75556. - DOI - PMC - PubMed
    1. Schnoes AM, Brown SD, Dodevski I, Babbitt PC. Annotation error in public databases: misannotation of molecular function in enzyme superfamilies. PLoS Comput. Biol. 2009;5:e1000605. doi: 10.1371/journal.pcbi.1000605. - DOI - PMC - PubMed
    1. Huntley, R. P., Sawford, T., Martin, M. J. & O’Donovan, C. Understanding how and why the Gene Ontology and its annotations evolve: the GO within UniProt. Giga Science3 (2014). - PMC - PubMed
    1. Bodenreider O, Stevens R. Bio-ontologies: current trends and future directions. Brief. Bioinform. 2006;7:256–274. doi: 10.1093/bib/bbl027. - DOI - PMC - PubMed
    1. Groß A, Hartung M, Prüfer K, Kelso J, Rahm E. Impact of ontology evolution on functional analyses. Bioinforma. Oxf. Engl. 2012;28:2671–2677. doi: 10.1093/bioinformatics/bts498. - DOI - PubMed