. 2018 Jul;48(7):1120-1136.
doi: 10.1002/eji.201847483. Epub 2018 Apr 6.

Infection with a Brazilian isolate of Zika virus generates RIG-I stimulatory RNA and the viral NS5 protein blocks type I IFN induction and signaling

Affiliations

Infection with a Brazilian isolate of Zika virus generates RIG-I stimulatory RNA and the viral NS5 protein blocks type I IFN induction and signaling

Jonny Hertzog et al. Eur J Immunol. 2018 Jul.

Abstract

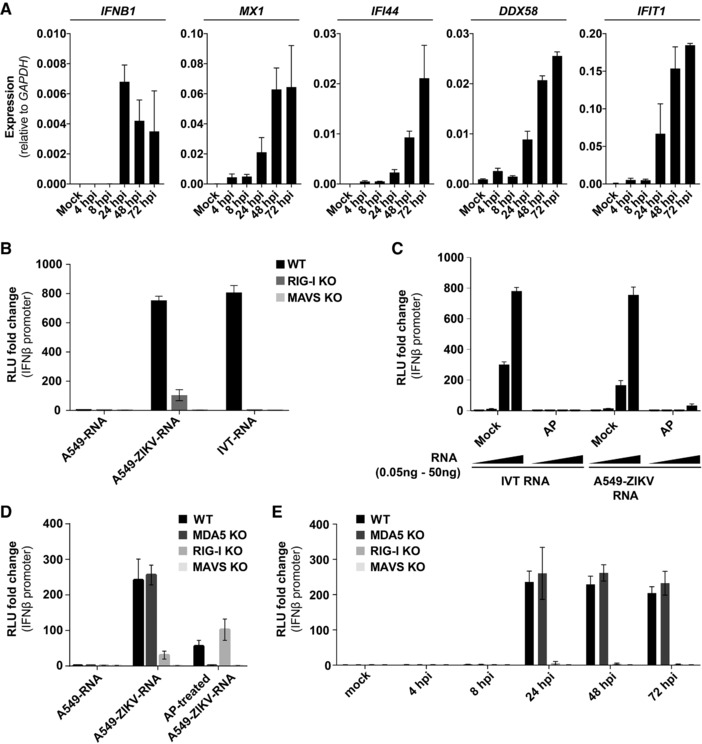
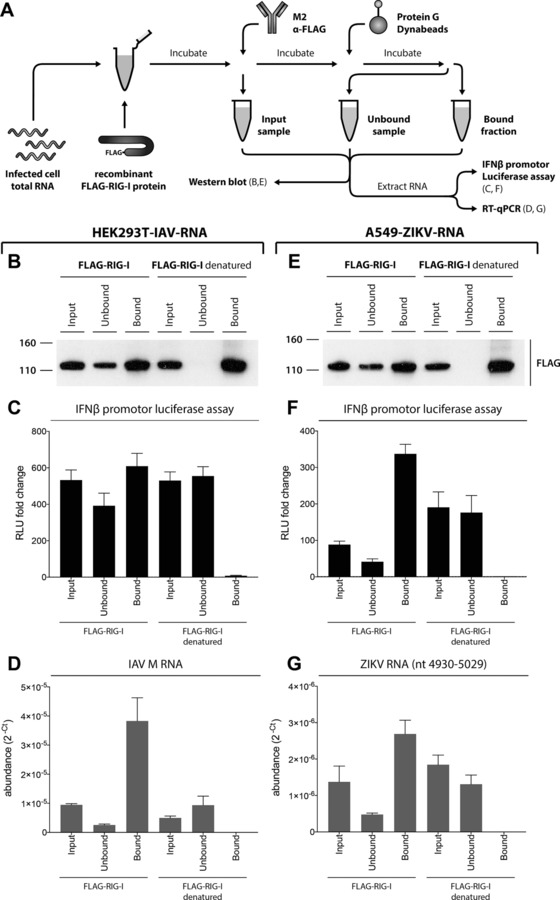
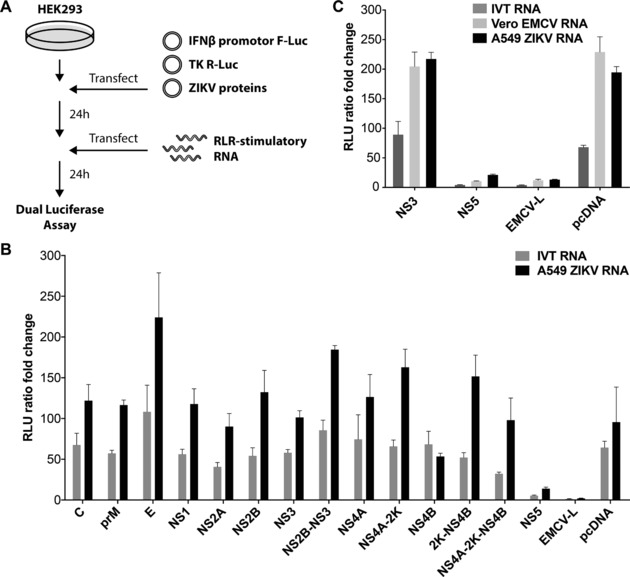
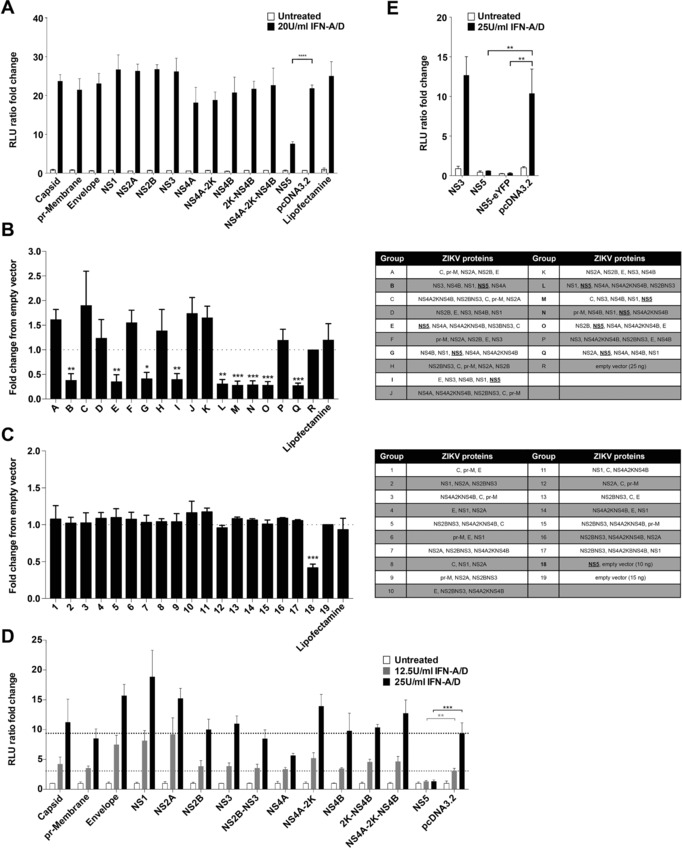
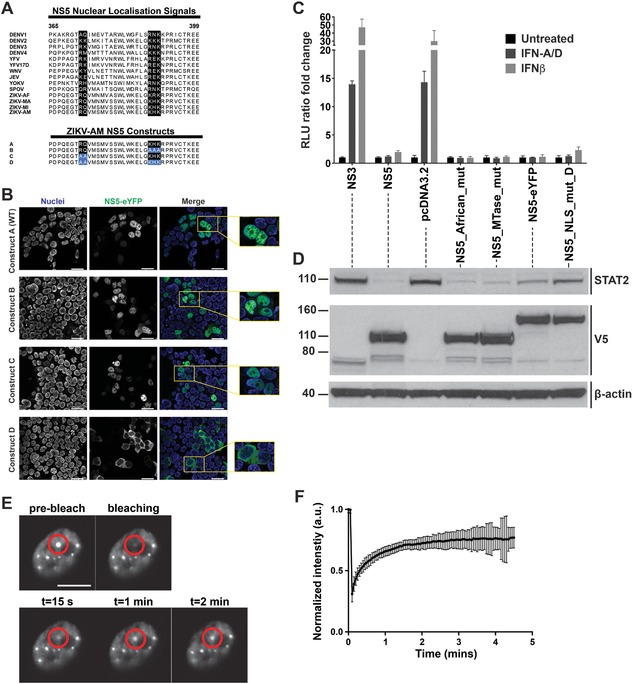
Zika virus (ZIKV) is a major public health concern in the Americas. We report that ZIKV infection and RNA extracted from ZIKV infected cells potently activated the induction of type I interferons (IFNs). This effect was fully dependent on the mitochondrial antiviral signaling protein (MAVS), implicating RIG-I-like receptors (RLRs) as upstream sensors of viral RNA. Indeed, RIG-I and the related RNA sensor MDA5 contributed to type I IFN induction in response to RNA from infected cells. We found that ZIKV NS5 from a recent Brazilian isolate blocked type I IFN induction downstream of RLRs and also inhibited type I IFN receptor (IFNAR) signaling. We defined the ZIKV NS5 nuclear localization signal and report that NS5 nuclear localization was not required for inhibition of signaling downstream of IFNAR. Mechanistically, NS5 blocked IFNAR signaling by both leading to reduced levels of STAT2 and by blocking phosphorylation of STAT1, two transcription factors activated by type I IFNs. Taken together, our observations suggest that ZIKV infection induces a type I IFN response via RLRs and that ZIKV interferes with this response by blocking signaling downstream of RLRs and IFNAR.

Keywords: Interferon; MDA5; RIG-I; STAT; Zika virus.


Figures

Figure 1
Figure 1
ZIKV infection generates RIG‐I‐ and MDA5‐stimulatory RNAs. (A) A549 cells were infected with ZIKV (MOI of 5) and total RNA was extracted at the indicated time points. Expression levels of the indicated mRNAs were determined by RT‐qPCR with samples assayed in technical duplicates. Data were analyzed by the comparative Ct method. (B) A549 cells were infected with ZIKV (MOI of 5) and total RNA was extracted after 20 h (A549‐ZIKV‐RNA). 100 ng A549‐ZIKV‐RNA or RNA from uninfected cells (A549‐RNA) was then transfected into the indicated p125HEK cells (see Supporting Information Fig. 1). After 16 h, luciferase activity was determined. Data are shown as fold change compared to cells treated with transfection reagent only. IVT‐RNA, Neo1‐99 in vitro transcribed RNA (RIG‐I agonist); RLU, relative light unit. (C) IVT‐RNA and A549‐ZIKV‐RNA were treated with alkaline phosphatase (AP). Control samples were processed in parallel omitting AP (mock). These RNAs were then analyzed as in (B) using wild‐type p125HEK cells and four doses of RNA (0.05, 0.5, 5, and 50 ng). (D) The experiment shown in (B) was repeated using the indicated p125HEK cell lines that were pre‐treated with 3 U/ml IFN‐A/D for 16 h and were then transfected with 50 ng of total RNA from uninfected cells (A549‐RNA) or with A549‐ZIKV‐RNA that was or was not treated with AP. (E) The experiment shown in (B) was repeated using A549‐ZIKV‐RNA isolated at the indicated time points after infection. Panel (A) shows pooled data of two independent experiments (average and SEM (n = 4)). Panel (B) is representative of three independent experiments (average and SD (n = 3)). Panels (C) and (D) are representative of two independent experiments (average and SD (n = 3)). Panel (E) shows pooled data of two independent experiments (average and SEM (n = 6)).
Figure 2
Figure 2
RIG‐I binds ZIKA RNA. (A) Schematic of the experimental setup. Please see results for detail. HEK293T‐IAV‐RNA (panels B–D) and A549‐ZIKV‐RNA (E–G) were used. (B, E) Input, unbound and bound samples were analyzed by Western blot using α‐FLAG antibody. (C, F) RNAs extracted from input, unbound and bound samples were transfected into p125HEK cells (see Supporting Information Fig. 1). After 16 h, luciferase activity was determined and set to 1 for control samples treated with transfection reagent alone. RLU, relative light unit. (D, G) RNA samples from (C) and (F) were analyzed in technical duplicate by RT q‐PCR using the indicated probes. Relative viral transcript abundance was analyzed by converting Ct data to 2−Ct values. Panels (B) and (E) are representative of three independent experiments. Panels (C), (D), (F) and (G) show pooled data from three independent experiments (average and SEM (n = 6)).
Figure 3
Figure 3
Cloning and expression of ZIKV proteins. (A) Expression constructs. The DNA sequence of the single ZIKV open reading frame encoding all structural and non‐structural proteins was derived from a sequenced ZIKV complete genome (GenBank accession KU527068; origin Brazil) recovered from the brain of a microcephalic, aborted foetus. Segments encoding individual proteins were annotated using sequence alignment with a reference genome (GenBank accession NC_012532.1). Expression constructs generated and used in this study are shown as double lines. (B) HEK293 cells were transfected with plasmids expressing the indicated ZIKV proteins. Cell lysates were prepared 24 h after transfection and protein expression was determined by Western blot using the indicated antibodies with GAPDH as loading control. MW, molecular weight. (C, D) The experiment shown in panel (B) was repeated using HEK293T cells and the indicated plasmids. Data are representative of at least three independent experiments.
Figure 4
Figure 4
ZIKV NS5 blocks type I IFN induction by RLRs. (A) Schematic of the experimental setup. Please see results for detail. (B, C) HEK293 cells were transiently transfected with the indicated ZIKV plasmids, a plasmid encoding F‐Luc under control of the IFNβ promoter and a plasmid expressing Renilla luciferase (R‐Luc) from the constitutive thymidine kinase (TK) promoter. Cells were transfected with RLR‐stimulatory RNAs after 24 h as indicated. F‐Luc and R‐Luc activities in cell lysates were determined after an additional 24 h and the F‐Luc / R‐Luc ratio was set to 1 in cells that received only transfection reagent at the RNA transfection step. Data are representative of three independent experiments (average and SD (n = 3)).
Figure 5
Figure 5
ZIKV NS5 blocks type I IFN signaling. (A) Stable HEK293‐ISRE‐reporter cells were transfected with ZIKV plasmids as indicated and, 24 h later, were treated or were not with 20U/ml IFN‐A/D. Luciferase activity in cell lysates was determined 24 h after transfection and was set to 1 in untreated cells that received empty vector. (B,C) The experiment shown in (A) was repeated using plasmid combinations as indicated on the left. (D,E) HEK293T cells were transiently transfected with the indicated ZIKV plasmids, a plasmid encoding F‐Luc under ISRE control and a plasmid expressing Renilla luciferase (R‐Luc) from the TK promoter. Cells were treated with IFN‐A/D after 24 h as indicated. F‐Luc and R‐Luc activities in cell lysates were determined after an additional 24 h and the F‐Luc / R‐Luc ratio was set to 1 in untreated cells that received empty vector. Panels (A), (D), (E) are representative of three independent experiments (average and SD (n = 3)). Panels (B) and (C) show pooled data from three experiments (average and SEM (n = 9)). (A), (D), (E): unpaired, two‐tailed t‐test as indicated. (B), (C): unpaired, two‐tailed t‐test vs empty vector. (* p<0.05, ** p<0.01, *** p<0.001, **** p<0.0001).
Figure 6
Figure 6
NS5 triggers STAT2 depletion and blocks STAT1 phosphorylation. (A) HEK293T cells were transfected with the indicated ZIKV plasmids and either were or were not treated with 25U/ml of IFN‐A/D. RNA was extracted after 24 h and expression levels of the indicated mRNAs were determined by RT‐qPCR with samples assayed in technical duplicate. Data were analyzed by the comparative Ct method and set to 1 for untreated cells transfected with empty vector. (B,C) Cell lysates were prepared from HEK293T cells transfected with the indicated plasmids and treated with IFN‐A/D for 24 h. Expression of the indicated protein was determined by Western blot with β‐actin as loading control. (D) Quantification of signals in (C) using the image densitometry analysis tool of ImageJ. Panels (A) ‐ (C) are representative of three independent experiments. Panel (A) shows average and range (n = 2).
Figure 7
Figure 7
Blockade of type I IFN signaling by NS5 does not require NS5 nuclear localisation. (A) The NS5 interdomain regions from different flaviviruses were aligned and the area around the aNLS is shown. Residues involved in nuclear localization of DENV NS5 are highlighted in black. The aNLS mutations studied in (B) are indicated in blue at the bottom. DENV: Dengue virus; YFV: yellow fever virus; WNV: West Nile virus; JEV: Japanese encephalitis virus; YOKV: Yokose virus; SPOV: Spondweni virus; ZIKV: Zika virus – AF: Africa, MA: Malaysia, MI: Micronesia, AM: America. (B) HEK293T cells were transfected with wild‐type NS5‐eYFP or NS5 NLS mutant constructs as shown in panel (A). After 24 h, live cells were imaged with a confocal microscope. Nuclei were stained with the membrane permeable dye, NucBlue™. Scale bar is 25 μm. (C, D) HEK293T cells were transfected as in Fig. 5D using the indicated ZIKV plasmids and were treated with 25U/ml of IFN‐A/D or IFNβ. 24 h after transfection, luciferase activities were analyzed as in Fig. 5D (C) and cell lysates from untreated samples were analyzed by Western blot with β‐actin as loading control (D). (E) HEK293T cells were transfected with ZIKV NS5‐eYFP. After 24 h, the mobility of nuclear NS5 speckles was analyzed by fluorescence recovery after photobleaching (FRAP). Representative snapshots of a cell nucleus expressing NS5‐eYFP before, during and after bleaching of the speckle indicated by the red circle are shown, indicating that fluorescence of NS5 recovered and that the protein was mobile and in a fluid environment. Scale bar is 2 μm. (F) The intensity of NS5 speckles was normalized to 1 before photobleaching and was analyzed over time after photobleaching. The fluorescence intensity in NS5 speckles dropped to ∼25% of the initial value and then recovered back to ∼75%. Panels (B)–(F) are representative of at least three independent experiments. Panel C shows average and SD (n = 3). Panel (F) shows average of five speckles and SD.

References

    1. Dick, G. W. , Kitchen, S. F. and Haddow, A. J. , Zika virus. I. Isolations and serological specificity. Trans R Soc Trop Med Hyg 1952. 46: 509–520. - PubMed
    1. Dick, G. W. , Zika virus. II. Pathogenicity and physical properties. Trans R Soc Trop Med Hyg 1952. 46: 521–534. - PubMed
    1. Faria, N. R. , Azevedo Rdo, S. , Kraemer, M. U. , Souza, R. , Cunha, M. S. , Hill, S. C. , Theze, J. et al, Zika virus in the Americas: Early epidemiological and genetic findings. Science 2016. 352: 345–349. - PMC - PubMed
    1. Zhu, Z. , Chan, J. F. , Tee, K. M. , Choi, G. K. , Lau, S. K. , Woo, P. C. , Tse, H. et al, Comparative genomic analysis of pre‐epidemic and epidemic Zika virus strains for virological factors potentially associated with the rapidly expanding epidemic. Emerg Microbes Infect 2016. 5: e22. - PMC - PubMed
    1. Fajardo, A. , Cristina, J. and Moreno, P. , Emergence and spreading potential of Zika virus. Front Microbiol 2016. 7: 1667. - PMC - PubMed

Publication types