Review
. 2018 Mar 24;20(5):35.
doi: 10.1007/s11886-018-0979-6.

Light-Sheet Imaging to Elucidate Cardiovascular Injury and Repair

Affiliations
Review

Light-Sheet Imaging to Elucidate Cardiovascular Injury and Repair

Yichen Ding et al. Curr Cardiol Rep. .

Abstract

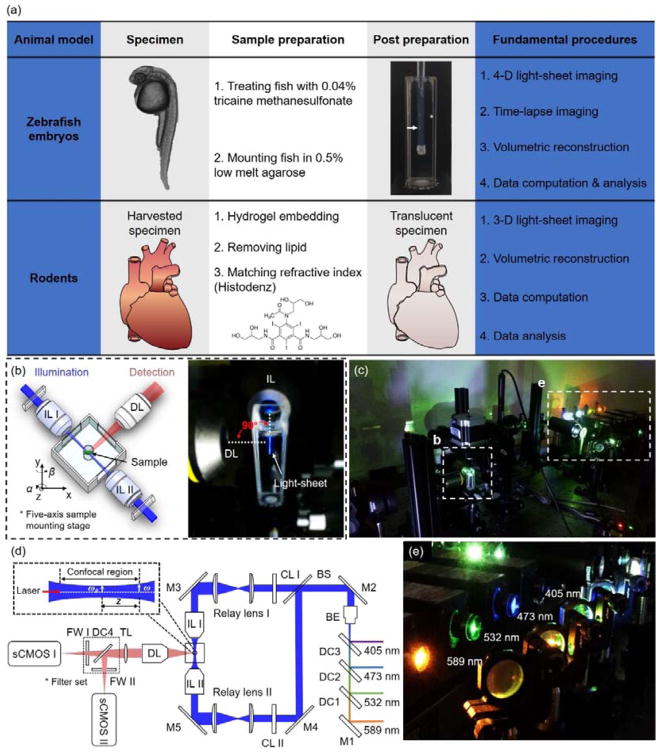
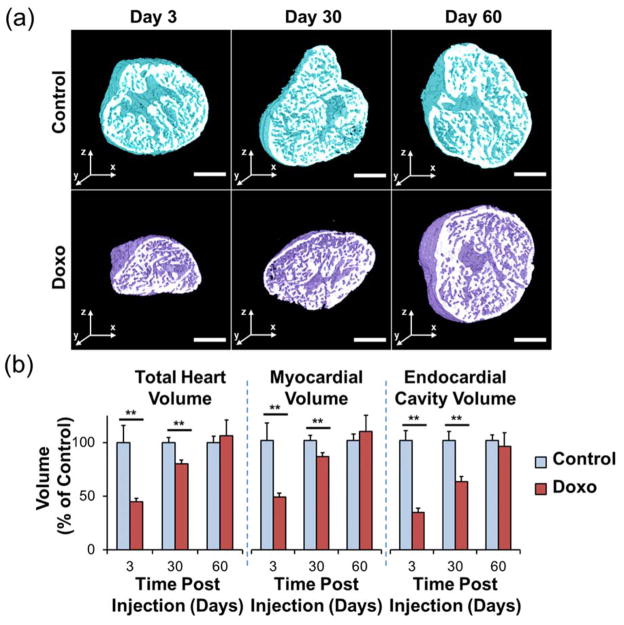
Purpose of review: Real-time 3-dimensional (3-D) imaging of cardiovascular injury and regeneration remains challenging. We introduced a multi-scale imaging strategy that uses light-sheet illumination to enable applications of cardiovascular injury and repair in models ranging from zebrafish to rodent hearts.

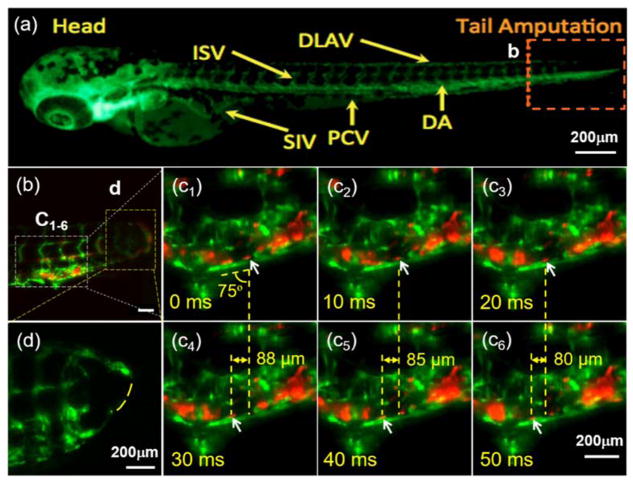
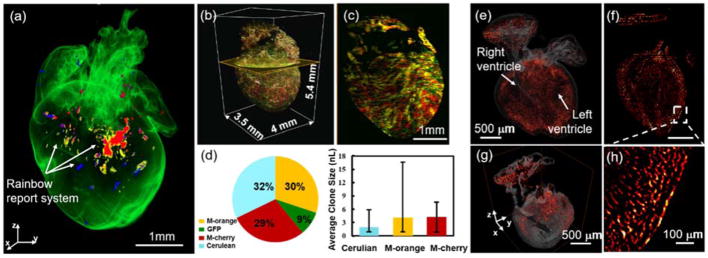
Recent findings: Light-sheet imaging enables rapid data acquisition with high spatiotemporal resolution and with minimal photo-bleaching or photo-toxicity. We demonstrated the capacity of this novel light-sheet approach for scanning a region of interest with specific fluorescence contrast, thereby providing axial and temporal resolution at the cellular level without stitching image columns or pivoting illumination beams during one-time imaging. This cutting-edge imaging technique allows for elucidating the differentiation of stem cells in cardiac regeneration, providing an entry point to discover novel micro-circulation phenomenon with clinical significance for injury and repair. These findings demonstrate the multi-scale applications of this novel light-sheet imaging strategy to advance research in cardiovascular development and regeneration.

Keywords: Cardiovascular injury; Doxorubicin; Light-sheet imaging; Regeneration.


Figures

Figure 1
Figure 1
Fundamental concept of the light-sheet imaging strategy. (a) The critical procedures of the multi-scale imaging are indicated for both embryonic zebrafish and mouse studies. (b) The specimen is mounted at the intersection of the illumination lens (IL) with the detection lens (DL). The laser light-sheet is excited from the IL in a 2-D plane which is orthogonal to the detection axis. The LSFM system provides a long working distance with air objective lenses in comparison to water-dipping lenses in conventional light-sheet systems. (c–d) A photo and a schematic illustrate the layout of the light-sheeting imaging system. A cylindrical lens (CL) converts the laser beam to a sheet of laser light that can transversely illuminate a thin layer of the sample. The illuminated 2-D thin layer (fluorescent detection in red) is captured by the high-frame rate sCMOS camera. The filter wheels (FW I and II) in front of sCMOS cameras are used for multi-color acquisitions. (e) A photo depicts an array of laser beams aligned for multi-channel fluorescent detection. M: mirror; BS: beam splitter; BE: beam expander; TL: tube lens; DC: dichroic mirror; FW: filter wheel.
Figure 2
Figure 2
Light-sheet microscopic illumination of vascular regeneration and circulating blood cells in response to tail amputation. (a) An inverted fluorescence image of a transgenic Tg(fli1:GFP;gata1:DsRed) zebrafish embryo showing the vasculature (green) at 3 dpf. ISV: intersegmental vessel; DLAV: dorsal longitudinal anastomotic vessel; SIV: subintestinal vessel; PCV: posterior cardinal vein; DA: dorsal aorta. Box b indicates the site of tail amputation. (b) LSFM captures blood cells (red) proximal to the site of amputation and regeneration. Dashed yellow boxes indicate locations of higher power images in the subsequent panels (c1–6). Arrows indicate the position of an individual RBC (red) in relation to the vascular endothelial layer (green) acquired by LSFM at 100 fps. The average angle between the vein (green PCV) and vertical axis of the frame is 75°, and the relative displacement along the horizontal axis of the frame in each 30 ms period is 88 μm (c4-c1), 85 μm (c5-c2) and 80 μm (c6-c3), respectively. These measures correspond to a net velocity of nearly 2.9 ± 0.1 μm/ms for that blood cell of interest. (d) The dashed line indicates the incomplete vascular regeneration between DLAV and DA in a separate zebrafish embryo treated with an inhibitor of ADAM10 (GI254023X, Sigma) which blocks Notch signaling. Scale bars: 200 μm.
Figure 3
Figure 3
Cardiac architecture following doxorubicin treatment. Following intraperitoneal treatment with doxorubicin or control vehicle, adult zebrafish hearts were harvested at days 3, 30, and 60. (a) Throughout the duration of the study, control hearts exhibited a preserved architecture. In contrast, doxorubicin-treated hearts demonstrated a profound cardiac remodeling leading to acute decrease in size at day 3, followed by gradual increase at day 30, and normalization at day 60. (b) Cardiac architecture characterization by quantitative analysis of the total heart, myocardial, and endocardial volumes compared to control values demonstrating the cardiac repair process following response to chemotherapy-induced injury. Legend. ** P < 0.01. Doxo: doxorubicin. Scale bar: 200 μm. (Reproduced with permission from: Packard et al. Sci Rep. 2017;7) (47).
Figure 4
Figure 4
3-D tracking of the cardiac progenitor lineage in the fetal and neonatal mouse hearts. (a) Expression of Cre in the neonatal mouse heart induces random recombination between mutated paired lox P sites leading to expression of Cerulean, GFP, mOrange and mCherry respectively. (b–c) Sub-voxel imaging of the rainbow heart was captured in four channels. Multi-view reconstruction was performed to enhance the spatial resolution for tracking and localizing the differentiation of cardiomyocytes in the intact neonatal heart. (d) Quantification of the number of labeled cells is illustrated in the pie chart, and the sizes of individual clones in a heart by the bar graphs. (e–f) Spatial distribution of tdT+ cells (red hot) in a fetal mouse heart which was Mesp1Cre/+ crossed with Rosa26tdT/+ reporter. (g) A 3-D orthogonal slice and (h) 2-D inset reveal the contribution of tdT+ cells in the heart. Scale bars: (a & c) 1 mm; (e–g) 500 μm; (h) 100 μm.

References

    1. Huisken J, Stainier DY. Selective plane illumination microscopy techniques in developmental biology. Development. 2009;136(12):1963–75. - PMC - PubMed
    1. De Vos WH, Beghuin D, Schwarz CJ, Jones DB, van Loon JJ, Bereiter-Hahn J, et al. Invited Review Article: Advanced light microscopy for biological space research. Rev Sci Instr. 2014;85(10):101101. - PubMed
    1. Power RM, Huisken J. A guide to light-sheet fluorescence microscopy for multiscale imaging. Nat Meth. 2017;14(4):360–73. - PubMed
    1. Bacallao R, Kiai K, Jesaitis L. Guiding principles of specimen preservation for confocal fluorescence microscopy. In: Pawley J, editor. Handbook of biological confocal microscopy. Springer; 2006. pp. 368–80.
    1. Miyaoka R, Lewellen T, Yu H, McDaniel D. Design of a depth of interaction (DOI) PET detector module. IEEE T Nucl Sci. 1998;45(3):1069–73.

Publication types