

Genomic alterations in plasma DNA from patients with metastasized prostate cancer receiving abiraterone or enzalutamide
- PMID: 29574703
- PMCID: PMC6099279
- DOI: 10.1002/ijc.31397
Genomic alterations in plasma DNA from patients with metastasized prostate cancer receiving abiraterone or enzalutamide
Abstract
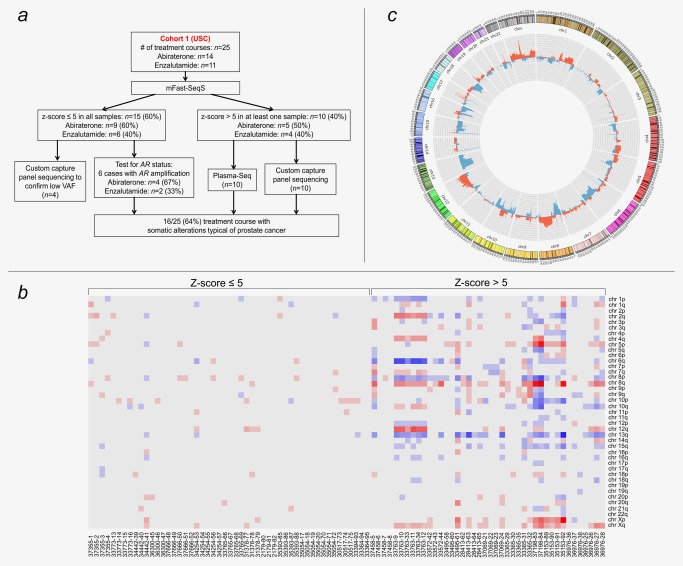
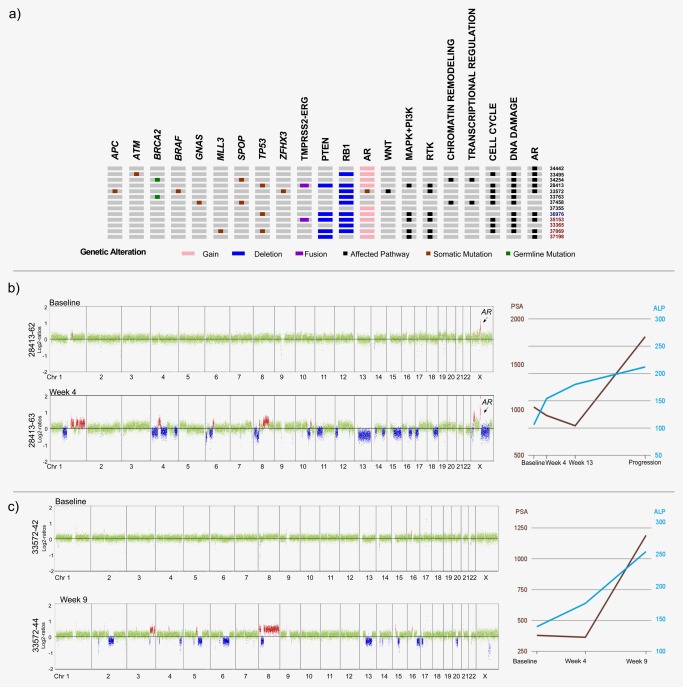
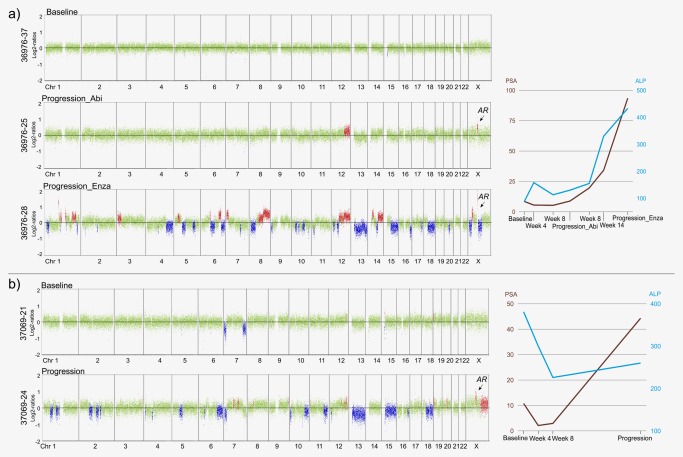
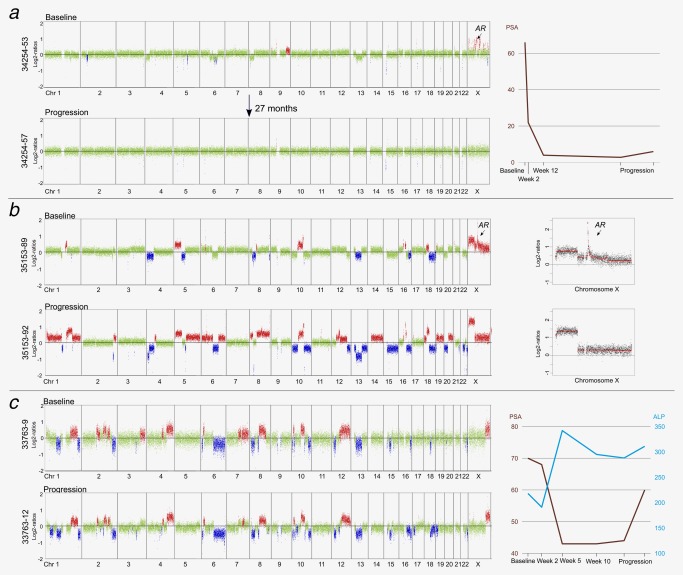
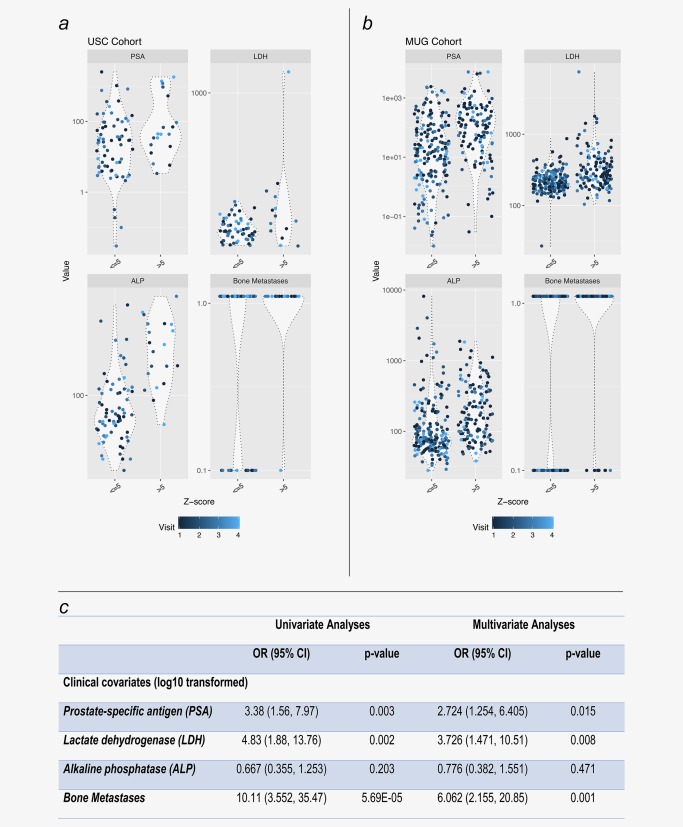
In patients with metastatic castrate-resistant prostate cancer (mCRPC), circulating tumor DNA (ctDNA) analysis offers novel opportunities for the development of non-invasive biomarkers informative of treatment response with novel agents targeting the androgen-receptor (AR) pathway, such as abiraterone or enzalutamide. However, the relationship between ctDNA abundance, detectable somatic genomic alterations and clinical progression of mCRPC remains unexplored. Our study aimed to investigate changes in plasma DNA during disease progression and their associations with clinical variables in mCRPC patients. We analyzed ctDNA in two cohorts including 94 plasma samples from 25 treatment courses (23 patients) and 334 plasma samples from 125 patients, respectively. We conducted whole-genome sequencing (plasma-Seq) for genome-wide profiling of somatic copy number alterations and targeted sequencing of 31 prostate cancer-associated genes. The combination of plasma-Seq with targeted AR analyses identified prostate cancer-related genomic alterations in 16 of 25 (64%) treatment courses in the first cohort, in which we demonstrated that AR amplification does not always correlate with poor abiraterone and enzalutamide therapy outcome. As we observed a wide variability of ctDNA levels, we evaluated ctDNA levels and their association with clinical parameters and included the second, larger cohort for these analyses. Employing altogether 428 longitudinal plasma samples from 148 patients, we identified the presence of bone metastases, increased lactate dehydrogenase and prostate-specific antigen (PSA) as having the strongest association with high ctDNA levels. In summary, ctDNA alterations are observable in the majority of patients with mCRPC and may eventually be useful to guide clinical decision-making in this setting.
Keywords: androgen receptor; circulating tumor DNA; liquid biopsies; prostate cancer; targeted therapies.
© 2018 The Authors International Journal of Cancer published by John Wiley & Sons Ltd on behalf of UICC.
Figures
Similar articles
-
Genomic Alterations in Cell-Free DNA and Enzalutamide Resistance in Castration-Resistant Prostate Cancer.JAMA Oncol. 2016 Dec 1;2(12):1598-1606. doi: 10.1001/jamaoncol.2016.0494. JAMA Oncol. 2016. PMID: 27148695 Free PMC article.
-
TP53 Outperforms Other Androgen Receptor Biomarkers to Predict Abiraterone or Enzalutamide Outcome in Metastatic Castration-Resistant Prostate Cancer.Clin Cancer Res. 2019 Mar 15;25(6):1766-1773. doi: 10.1158/1078-0432.CCR-18-1943. Epub 2018 Sep 12. Clin Cancer Res. 2019. PMID: 30209161 Free PMC article. Clinical Trial.
-
AR-V7 in Peripheral Whole Blood of Patients with Castration-resistant Prostate Cancer: Association with Treatment-specific Outcome Under Abiraterone and Enzalutamide.Eur Urol. 2017 Nov;72(5):828-834. doi: 10.1016/j.eururo.2017.07.024. Epub 2017 Aug 14. Eur Urol. 2017. PMID: 28818355
-
Targeting persistent androgen receptor signaling in castration-resistant prostate cancer.Med Oncol. 2016 May;33(5):44. doi: 10.1007/s12032-016-0759-3. Epub 2016 Apr 4. Med Oncol. 2016. PMID: 27042852 Review.
-
Androgen receptor variant 7 (AR-V7) in sequencing therapeutic agents for castratrion resistant prostate cancer: A critical review.Medicine (Baltimore). 2019 May;98(19):e15608. doi: 10.1097/MD.0000000000015608. Medicine (Baltimore). 2019. PMID: 31083254 Free PMC article.
Cited by
-
Cancer Metastases to Bone: Concepts, Mechanisms, and Interactions with Bone Osteoblasts.Cancers (Basel). 2018 Jun 4;10(6):182. doi: 10.3390/cancers10060182. Cancers (Basel). 2018. PMID: 29867053 Free PMC article. Review.
-
Liquid biopsy to personalize treatment for metastatic prostate cancer.Am J Transl Res. 2024 May 15;16(5):1531-1549. doi: 10.62347/DICU9510. eCollection 2024. Am J Transl Res. 2024. PMID: 38883349 Free PMC article. Review.
-
Somatic Copy-Number Alterations in Plasma Circulating Tumor DNA from Advanced EGFR-Mutated Lung Adenocarcinoma Patients.Biomolecules. 2021 Apr 21;11(5):618. doi: 10.3390/biom11050618. Biomolecules. 2021. PMID: 33919291 Free PMC article.
-
Liquid Biopsy Biomarkers in Metastatic Castration-Resistant Prostate Cancer Treated with Second-Generation Antiandrogens: Ready for Clinical Practice? A Systematic Review.Cancers (Basel). 2025 Jul 27;17(15):2482. doi: 10.3390/cancers17152482. Cancers (Basel). 2025. PMID: 40805181 Free PMC article. Review.
-
The Prognostic Value of Plasma Cell-Free DNA Concentration in the Prostate Cancer: A Systematic Review and Meta-Analysis.Front Oncol. 2021 Mar 11;11:599602. doi: 10.3389/fonc.2021.599602. eCollection 2021. Front Oncol. 2021. PMID: 33777743 Free PMC article.
References
Publication types
MeSH terms
Substances
Grants and funding
LinkOut - more resources
Full Text Sources
Other Literature Sources
Medical
Research Materials
Miscellaneous
