

Separate neural representations of prediction error valence and surprise: Evidence from an fMRI meta-analysis
- PMID: 29575249
- PMCID: PMC6866507
- DOI: 10.1002/hbm.24047
Separate neural representations of prediction error valence and surprise: Evidence from an fMRI meta-analysis
Abstract
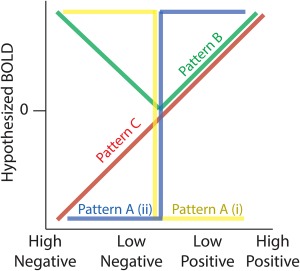
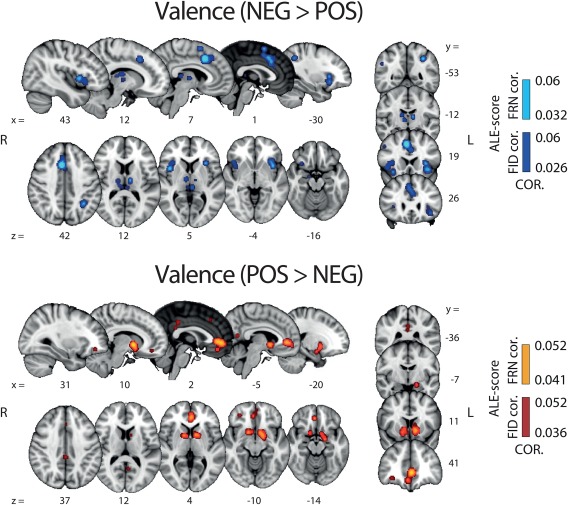
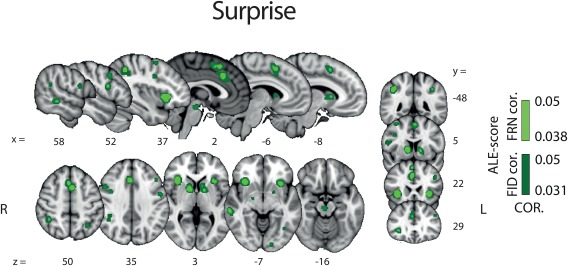
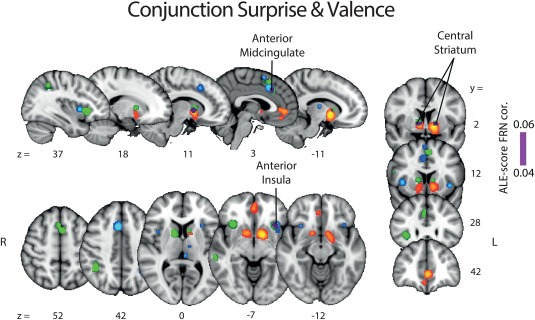
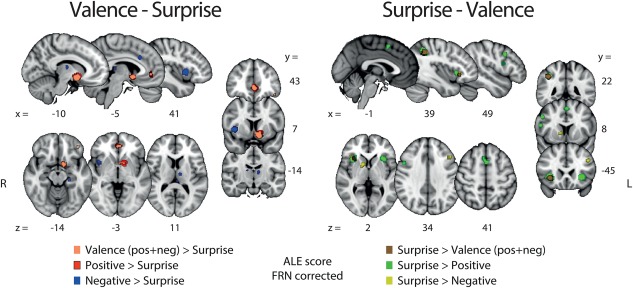
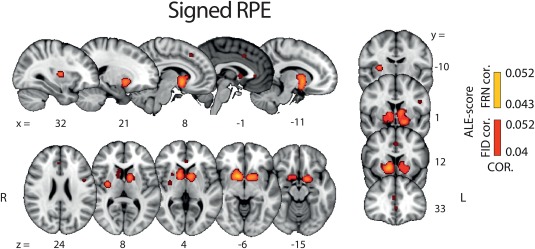
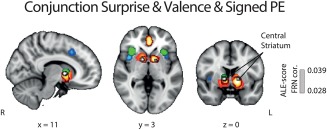
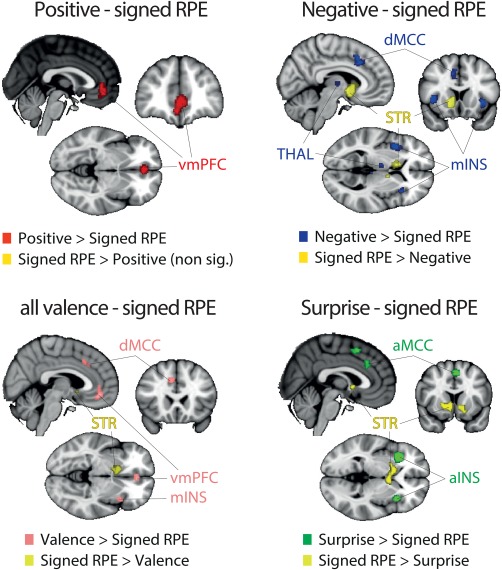
Learning occurs when an outcome differs from expectations, generating a reward prediction error signal (RPE). The RPE signal has been hypothesized to simultaneously embody the valence of an outcome (better or worse than expected) and its surprise (how far from expectations). Nonetheless, growing evidence suggests that separate representations of the two RPE components exist in the human brain. Meta-analyses provide an opportunity to test this hypothesis and directly probe the extent to which the valence and surprise of the error signal are encoded in separate or overlapping networks. We carried out several meta-analyses on a large set of fMRI studies investigating the neural basis of RPE, locked at decision outcome. We identified two valence learning systems by pooling studies searching for differential neural activity in response to categorical positive-versus-negative outcomes. The first valence network (negative > positive) involved areas regulating alertness and switching behaviours such as the midcingulate cortex, the thalamus and the dorsolateral prefrontal cortex whereas the second valence network (positive > negative) encompassed regions of the human reward circuitry such as the ventral striatum and the ventromedial prefrontal cortex. We also found evidence of a largely distinct surprise-encoding network including the anterior cingulate cortex, anterior insula and dorsal striatum. Together with recent animal and electrophysiological evidence this meta-analysis points to a sequential and distributed encoding of different components of the RPE signal, with potentially distinct functional roles.
Keywords: decision making; learning; meta-analysis; prediction error; reward.
© 2018 Wiley Periodicals, Inc.
Figures
Similar articles
-
Spatiotemporal neural characterization of prediction error valence and surprise during reward learning in humans.Sci Rep. 2017 Jul 6;7(1):4762. doi: 10.1038/s41598-017-04507-w. Sci Rep. 2017. PMID: 28684734 Free PMC article.
-
Anticipating the good and the bad: A study on the neural correlates of bivalent emotion anticipation and their malleability via attentional deployment.Neuroimage. 2018 Dec;183:553-564. doi: 10.1016/j.neuroimage.2018.08.048. Epub 2018 Aug 23. Neuroimage. 2018. PMID: 30145207
-
The feedback-related negativity (FRN) revisited: new insights into the localization, meaning and network organization.Neuroimage. 2014 Jan 1;84:159-68. doi: 10.1016/j.neuroimage.2013.08.028. Epub 2013 Aug 23. Neuroimage. 2014. PMID: 23973408
-
The differential neural substrates for reward choice under gain-loss contexts and risk in alcohol use disorder: Evidence from a voxel-based meta-analysis.Drug Alcohol Depend. 2023 Jul 1;248:109912. doi: 10.1016/j.drugalcdep.2023.109912. Epub 2023 May 4. Drug Alcohol Depend. 2023. PMID: 37182355 Review.
-
The Neural Substrate of Reward Anticipation in Health: A Meta-Analysis of fMRI Findings in the Monetary Incentive Delay Task.Neuropsychol Rev. 2018 Dec;28(4):496-506. doi: 10.1007/s11065-018-9385-5. Epub 2018 Sep 25. Neuropsychol Rev. 2018. PMID: 30255220 Free PMC article.
Cited by
-
Debates on the dorsomedial prefrontal/dorsal anterior cingulate cortex: insights for future research.Brain. 2023 Dec 1;146(12):4826-4844. doi: 10.1093/brain/awad263. Brain. 2023. PMID: 37530487 Free PMC article. Review.
-
Towards a Real-Life Understanding of the Altered Functional Behaviour of the Default Mode and Salience Network in Chronic Pain: Are People with Chronic Pain Overthinking the Meaning of Their Pain?J Clin Med. 2024 Mar 13;13(6):1645. doi: 10.3390/jcm13061645. J Clin Med. 2024. PMID: 38541870 Free PMC article. Review.
-
Learning under social versus nonsocial uncertainty: A meta-analytic approach.Hum Brain Mapp. 2022 Sep;43(13):4185-4206. doi: 10.1002/hbm.25948. Epub 2022 May 27. Hum Brain Mapp. 2022. PMID: 35620870 Free PMC article.
-
Increased ventral anterior insular connectivity to sports betting availability indexes problem gambling.Addict Biol. 2024 Mar;29(3):e13389. doi: 10.1111/adb.13389. Addict Biol. 2024. PMID: 38516877 Free PMC article.
-
The human language system, including its inferior frontal component in "Broca's area," does not support music perception.Cereb Cortex. 2023 Jun 8;33(12):7904-7929. doi: 10.1093/cercor/bhad087. Cereb Cortex. 2023. PMID: 37005063 Free PMC article.
References
-
- Abler, B. , Walter, H. , Erk, S. , Kammerer, H. , & Spitzer, M. (2006). Prediction error as a linear function of reward probability is coded in human nucleus accumbens. NeuroImage, 31(2), 790–795. - PubMed
-
- Amado, C. , Hermann, P. , Kovács, P. , Grotheer, M. , Vidnyánszky, Z. , & Kovács, G. (2016). The contribution of surprise to the prediction based modulation of fMRI responses. Neuropsychologia, 84, 105–112. - PubMed
-
- Amiez, C. , Sallet, J. , Procyk, E. , & Petrides, M. (2012). Modulation of feedback related activity in the rostral anterior cingulate cortex during trial and error exploration. NeuroImage, 63(3), 1078–1090. - PubMed
-
- Aron, A. R. , Shohamy, D. , Clark, J. , Myers, C. , Gluck, M. A. , & Poldrack, R. A. (2004). Human midbrain sensitivity to cognitive feedback and uncertainty during classification learning. Journal of Neurophysiology, 92(2), 1144–1152. - PubMed
Publication types
MeSH terms
Grants and funding
LinkOut - more resources
Full Text Sources
Other Literature Sources
Medical
