. 2018 May 22;57(21):6230-6235.
doi: 10.1002/anie.201802509. Epub 2018 May 2.

Localizing Antifungal Drugs to the Correct Organelle Can Markedly Enhance their Efficacy

Affiliations

Localizing Antifungal Drugs to the Correct Organelle Can Markedly Enhance their Efficacy

Raphael I Benhamou et al. Angew Chem Int Ed Engl. .

Abstract

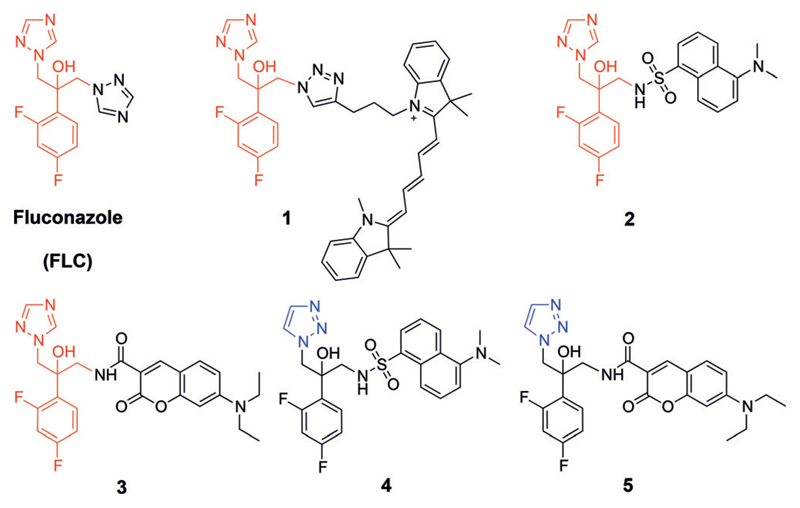
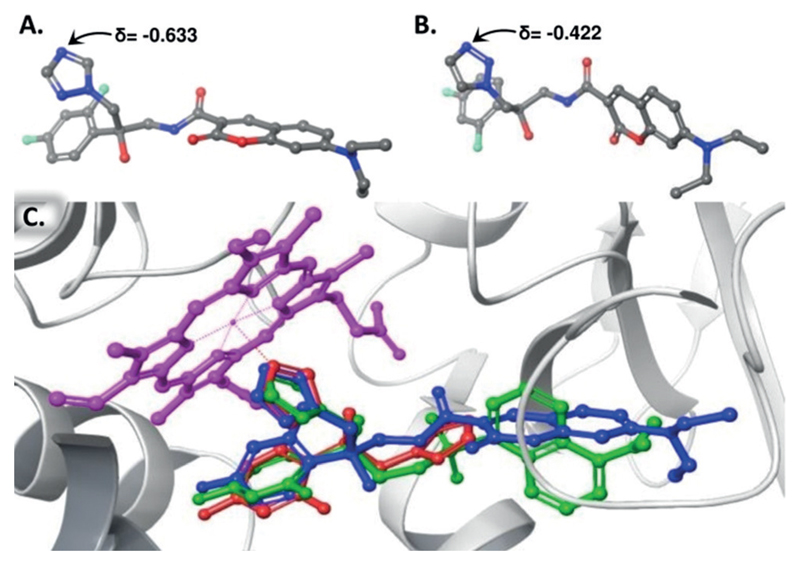
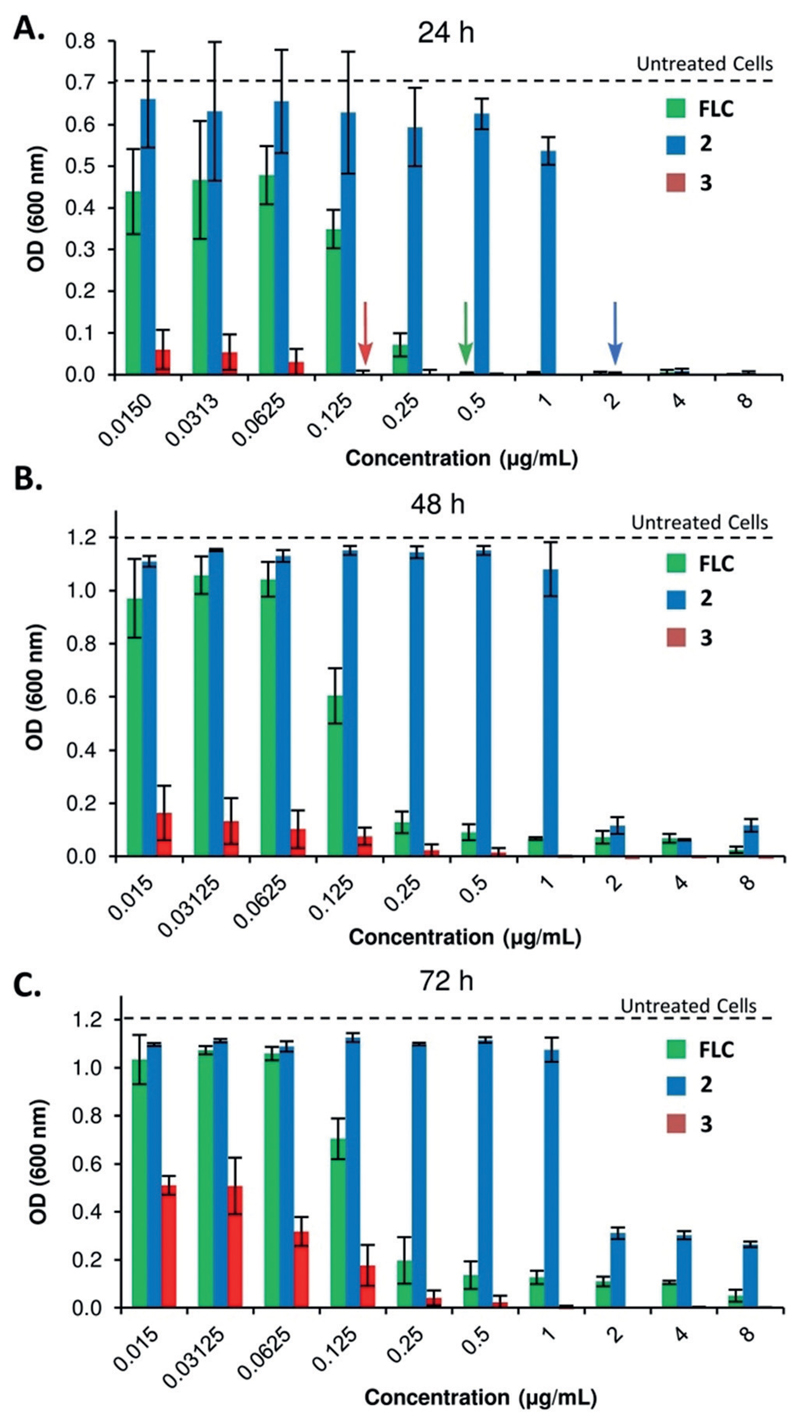
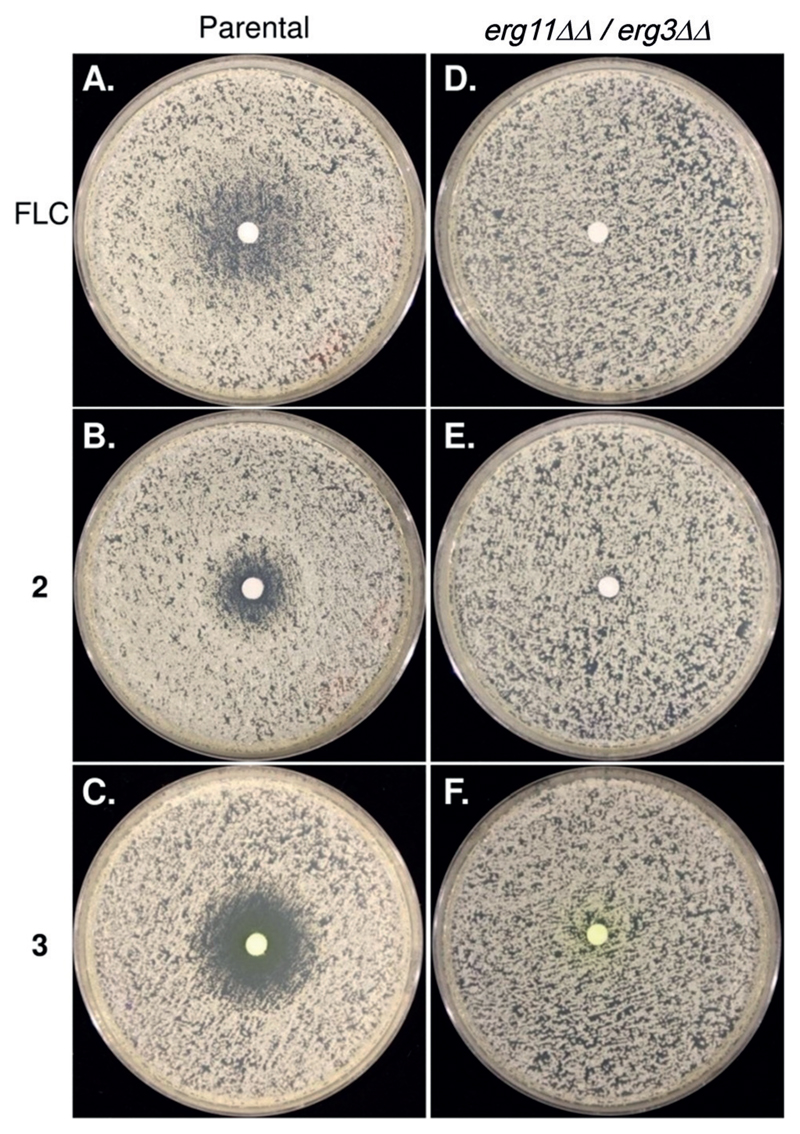
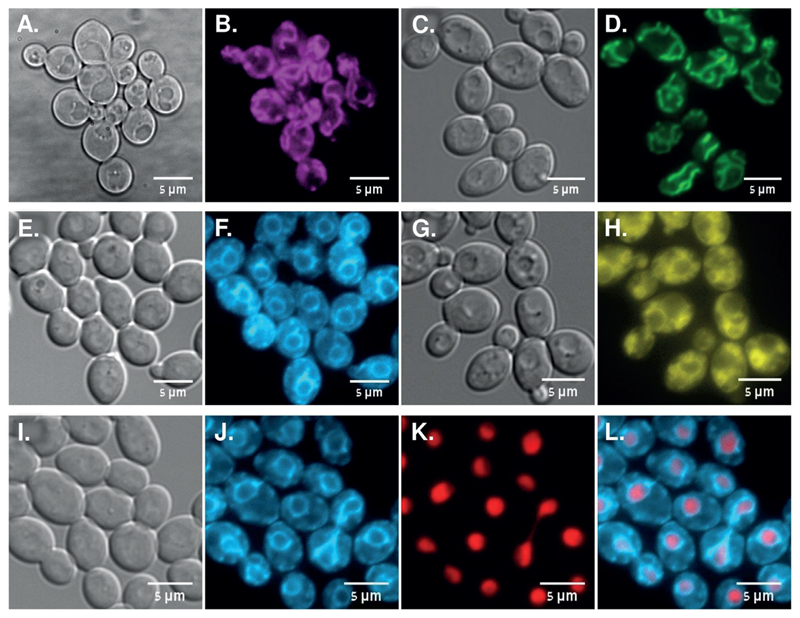
A critical aspect of drug design is optimal target inhibition by specifically delivering the drug molecule not only to the target tissue or cell but also to its therapeutically active site within the cell. This study demonstrates, as a proof of principle, that drug efficacy can be increased considerably by a structural modification that targets it to the relevant organelle. Specifically, by varying the fluorescent dye segment an antifungal azole was directed from the fungal cell mitochondria to the endoplasmic reticulum (ER), the organelle that harbors the drug target. The ER-localized azole displayed up to two orders of magnitude improved antifungal activity and also dramatically reduced the growth of drug-tolerant fungal subpopulations in a panel of Candida species, which are the most prevalent causes of serious human fungal infections. The principle underlying the "target organelle localization" approach provides a new paradigm to improve drug potency and replenish the limited pipeline of antifungal drugs.

Keywords: Candida; antifungal agents; azole drugs; fluorogenic probes; organelle-targeting drugs.


Conflict of interest statement

Conflict of interest

The authors declare no conflict of interest.

Figures

Figure 1
Figure 1
Structures of FLC, inherently fluorescent antifungal azoles 13, and azoles 4 and 5 (the 1,2,3-triazole derivatives of 2 and 3, respectively). The pharmacophore of the antifungal azoles is colored red and the 1,2,3-triazole ring of 4 and 5 is colored blue.
Figure 2
Figure 2
A) Partial charge value of the N-4 of the 1,2,4-triazole-based 3. B) Partial charge value of the N-3 of the 1,2,3-triazole-based 5. The partial charges were assigned according to the OPLS3 force field calculations. C) Docked structure of the R-enantiomer of azole 2 (green), the R-enantiomer of azole 3 (blue), and FLC (red) on a crystal structure of S. cerevisae cytochrome P450DM (PDB ID: 4ZDY). Protein residues are shown as grey ribbons with the heme prosthetic group in magenta.
Figure 3
Figure 3
Appearance of drug tolerant subpopulations over time in C. albicans SN152 at supra-MIC concentrations. A) Cell density after 24 hours (MIC is marked with an arrow). B) Cell density after 48 hours. C) Cell density after 72 hours.
Figure 4
Figure 4
Drug responses of C. albicans SN152 (parental) and ergosterol biosynthesis mutant strain (erg11ΔΔ/ erg3ΔΔ) by the disk diffusion assay. Cells were plated on casitone plates with disks containing 25 μg of the test compound placed in the center of the plates and were incubated for 24 hours at 30 °C.
Figure 5
Figure 5
Localization of antifungal azoles relative to mitochondrial, ER, and nuclear structures in live C. albicans SC5314 cells. A,B) Azole 2 (magenta, 10 μg mL−1) after 120 min. C,D) MitoTracker (green, 10 nm) after 60 min. E,F) Azole 3 (cyan, 1 μg mL−1) after 120 min. G,H) DiOC6—ER tracker (yellow,1 μg mL−1) after 5 min. I,J,K,L) Azole 3 (cyan) in cells expressing Eno1-mCherry nuclear protein (red) after 120 min. The bandpass filters used to image azole 2 were excitation 390/40 nm and emission 520/20 nm and filter sets used to image 3 and DiOC6 staining were excitation 440 nm and emission 480/40 nm. For MitoTracker green FM excitation 470 nm and emission 525/50 nm and for Eno1-mCherry excitation 585 nm and emission 630/75 nm.

References

    1. Tibbitt MW, Dahlman JE, Langer R. J Am Chem Soc. 2016;138:704–717. - PubMed
    1. Farokhzad OC, Langer R. ACS Nano. 2009;3:16–20. - PubMed
    1. Rajendran L, Knölker HJ, Simons K. Nat Rev Drug Discovery. 2010;9:29–42. - PubMed
    1. Sheff D. Adv Drug Delivery Rev. 2004;56:927–930. - PubMed
    1. Huber KVM. Nat Chem Biol. 2017;13:133–134. - PubMed

Publication types

LinkOut - more resources