

Effect of lactulose intervention on gut microbiota and short chain fatty acid composition of C57BL/6J mice
- PMID: 29575825
- PMCID: PMC6291785
- DOI: 10.1002/mbo3.612
Effect of lactulose intervention on gut microbiota and short chain fatty acid composition of C57BL/6J mice
Abstract
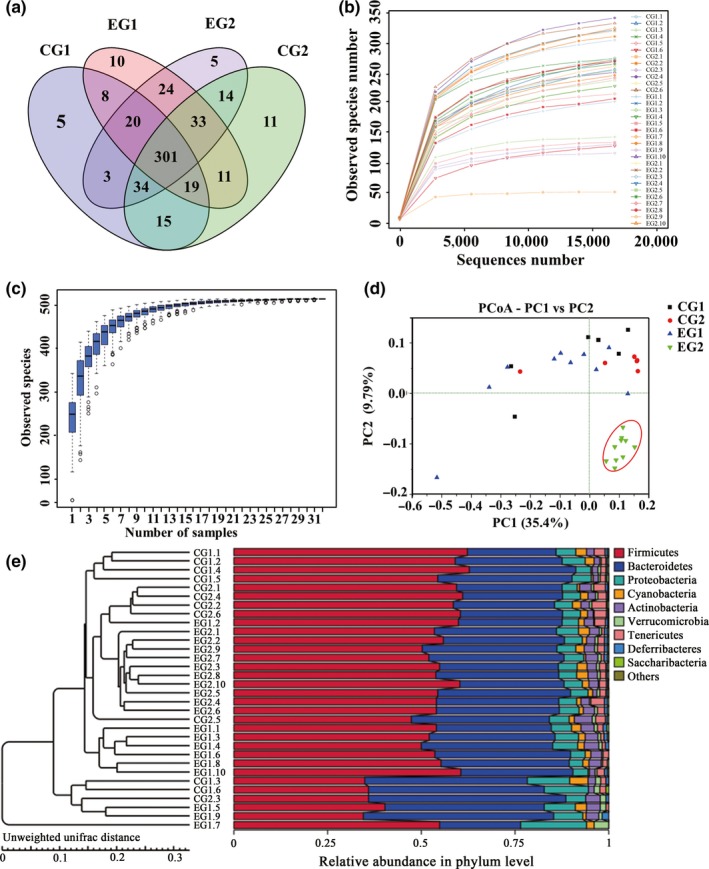
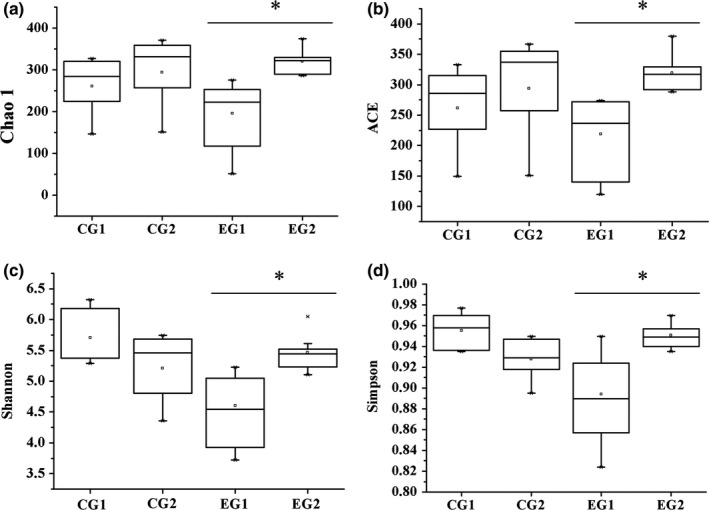
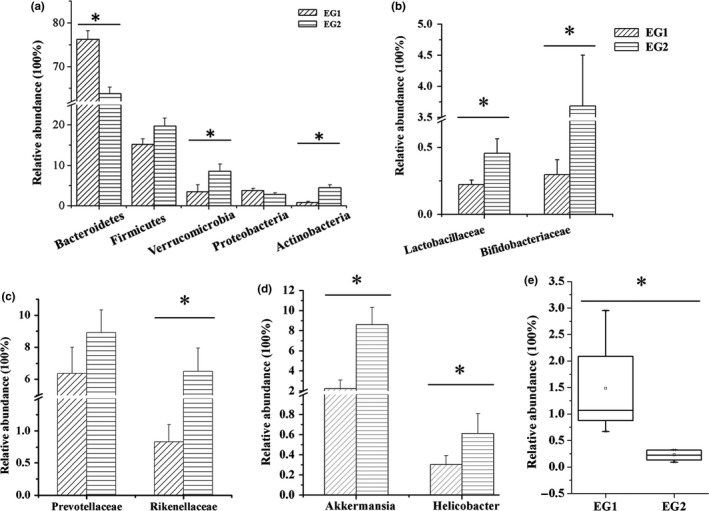
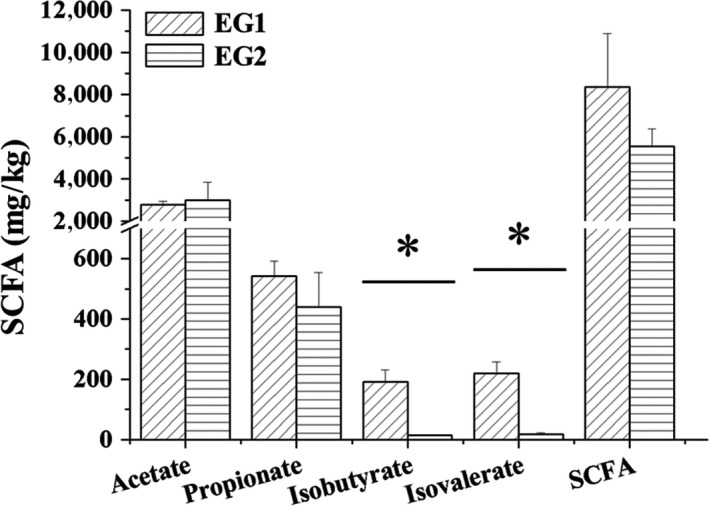
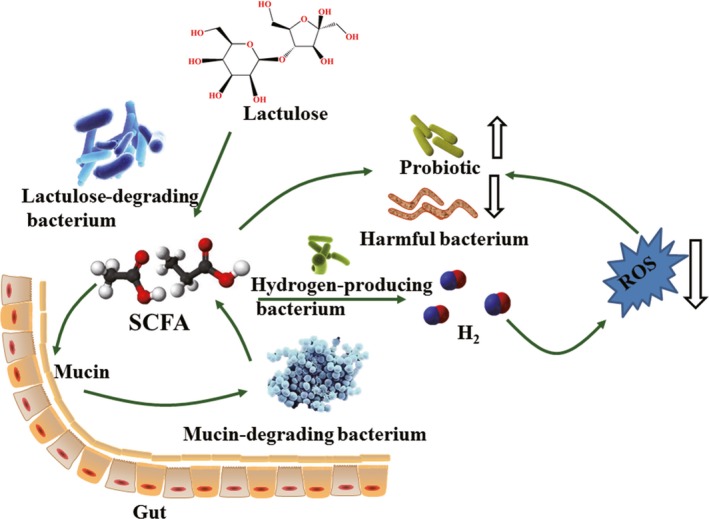
Gut microbiota have strong connections with health. Lactulose has been shown to regulate gut microbiota and benefit host health. In this study, the effect of short-term (3 week) intervention of lactulose on gut microbiota was investigated. Gut microbiota were detected from mouse feces by 16S rRNA high-throughput sequencing, and short chain fatty acids (SCFAs) were detected by gas chromatography-mass spectrometry (GC-MS). Lactulose intervention enhanced the α-diversity of the gut microbiota; increased the abundance of hydrogen-producing bacteria Prevotellaceae and Rikenellaceae, probiotics Bifidobacteriaceae and Lactobacillaceae, and mucin-degrading bacteria Akkermansia and Helicobacter; decreased the abundance of harmful bacteria Desulfovibrionaceae and branched-chain SCFAs (BCFAs). These results suggest that lactulose intervention effectively increased the diversity and improved the structure of the intestinal microbiota, which may be beneficial for host health.
Keywords: 16S rRNA high-throughput sequencing; gut microbiota; prebiotic; probiotics; short chain fatty acids.
© 2018 The Authors. MicrobiologyOpen published by John Wiley & Sons Ltd.
Figures
Similar articles
-
Lactulose Differently Modulates the Composition of Luminal and Mucosal Microbiota in C57BL/6J Mice.J Agric Food Chem. 2016 Aug 10;64(31):6240-7. doi: 10.1021/acs.jafc.6b02305. Epub 2016 Aug 2. J Agric Food Chem. 2016. PMID: 27438677
-
Lactulose significantly increased the relative abundance of Bifidobacterium and Blautia in mice feces as revealed by 16S rRNA amplicon sequencing.J Sci Food Agric. 2021 Oct;101(13):5721-5729. doi: 10.1002/jsfa.11181. Epub 2021 Mar 13. J Sci Food Agric. 2021. PMID: 33650140
-
Lotus Seed Resistant Starch Regulates Gut Microbiota and Increases Short-Chain Fatty Acids Production and Mineral Absorption in Mice.J Agric Food Chem. 2017 Oct 25;65(42):9217-9225. doi: 10.1021/acs.jafc.7b02860. Epub 2017 Oct 11. J Agric Food Chem. 2017. PMID: 28954513
-
Review: Effect of Gut Microbiota and Its Metabolite SCFAs on Radiation-Induced Intestinal Injury.Front Cell Infect Microbiol. 2021 Jul 9;11:577236. doi: 10.3389/fcimb.2021.577236. eCollection 2021. Front Cell Infect Microbiol. 2021. PMID: 34307184 Free PMC article. Review.
-
Short-Chain Fatty Acids-A Product of the Microbiome and Its Participation in Two-Way Communication on the Microbiome-Host Mammal Line.Curr Obes Rep. 2023 Jun;12(2):108-126. doi: 10.1007/s13679-023-00503-6. Epub 2023 May 19. Curr Obes Rep. 2023. PMID: 37208544 Free PMC article. Review.
Cited by
-
Inulin with different degrees of polymerization protects against diet-induced endotoxemia and inflammation in association with gut microbiota regulation in mice.Sci Rep. 2020 Jan 22;10(1):978. doi: 10.1038/s41598-020-58048-w. Sci Rep. 2020. PMID: 31969646 Free PMC article.
-
Gut Microbial Metabolite Short-Chain Fatt Acids Partially Reverse Surgery and Anesthesia-Induced Behavior Deficits in C57BL/6J Mice.Front Neurosci. 2021 Jun 8;15:664641. doi: 10.3389/fnins.2021.664641. eCollection 2021. Front Neurosci. 2021. PMID: 34168535 Free PMC article.
-
Green tea leaf powder prevents dyslipidemia in high-fat diet-fed mice by modulating gut microbiota.Food Nutr Res. 2020 Nov 13;64. doi: 10.29219/fnr.v64.3672. eCollection 2020. Food Nutr Res. 2020. PMID: 33281537 Free PMC article.
-
Proton-pump inhibitors are associated with a high false-positivity rate in faecal immunochemical testing.J Gastroenterol. 2021 Jan;56(1):42-53. doi: 10.1007/s00535-020-01738-z. Epub 2020 Nov 7. J Gastroenterol. 2021. PMID: 33159805
-
Sodium butyrate improves renal injury in diabetic nephropathy through AMPK/SIRT1/PGC-1α signaling pathway.Sci Rep. 2024 Aug 1;14(1):17867. doi: 10.1038/s41598-024-68227-8. Sci Rep. 2024. PMID: 39090182 Free PMC article.
References
-
- Aider, M. , & Gimenezvidal, M. (2012). Lactulose synthesis by electro‐isomerization of lactose: Effect of lactose concentration and electric current density. Innovative Food Science & Emerging Technologies, 16, 163–170. 10.1016/j.ifset.2012.05.007 - DOI
-
- Cani, P. D. , & Delzenne, N. M. (2009). The role of the gut microbiota in energy metabolism and metabolic disease. Current Pharmaceutical Design, 15, 1546–1558. - PubMed
Publication types
MeSH terms
Substances
LinkOut - more resources
Full Text Sources
Other Literature Sources
Medical
Miscellaneous
