. 2018 Apr 9;33(4):649-663.e4.
doi: 10.1016/j.ccell.2018.02.010. Epub 2018 Mar 22.

Fc Effector Function Contributes to the Activity of Human Anti-CTLA-4 Antibodies

Collaborators, Affiliations

Fc Effector Function Contributes to the Activity of Human Anti-CTLA-4 Antibodies

Frederick Arce Vargas et al. Cancer Cell. .

Abstract

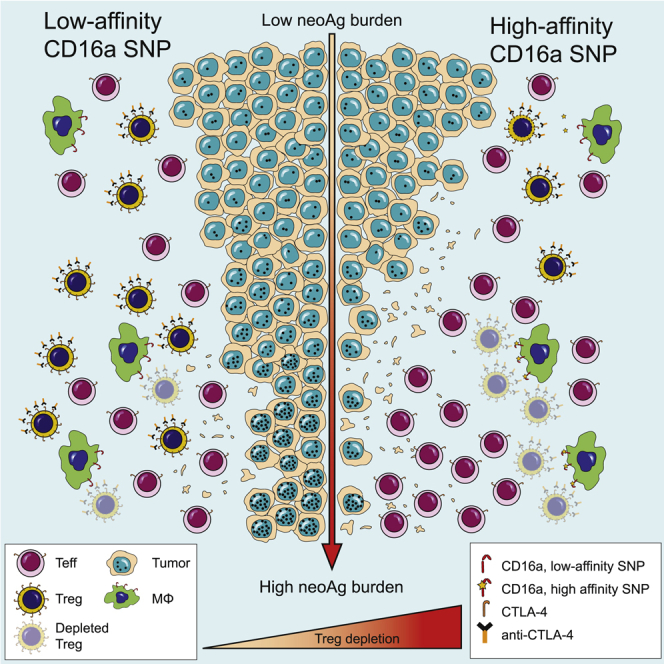
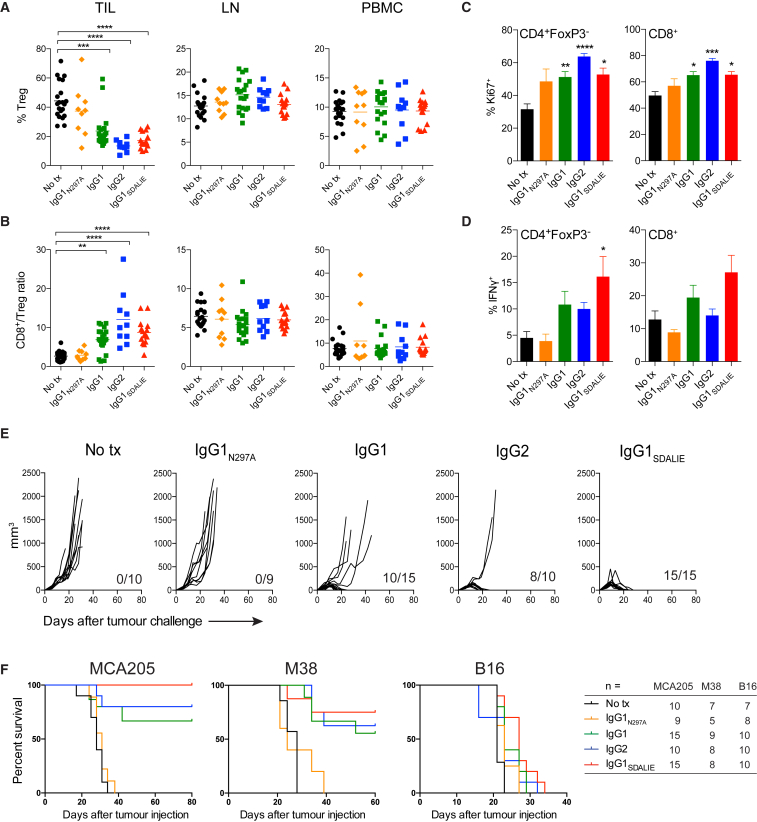
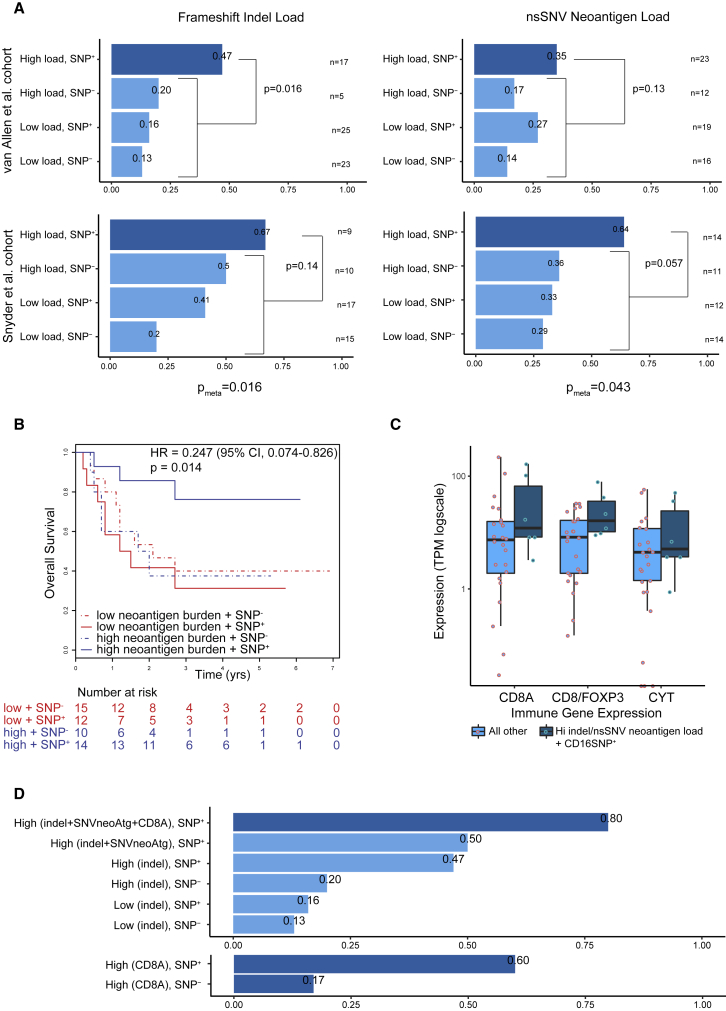
With the use of a mouse model expressing human Fc-gamma receptors (FcγRs), we demonstrated that antibodies with isotypes equivalent to ipilimumab and tremelimumab mediate intra-tumoral regulatory T (Treg) cell depletion in vivo, increasing the CD8+ to Treg cell ratio and promoting tumor rejection. Antibodies with improved FcγR binding profiles drove superior anti-tumor responses and survival. In patients with advanced melanoma, response to ipilimumab was associated with the CD16a-V158F high affinity polymorphism. Such activity only appeared relevant in the context of inflamed tumors, explaining the modest response rates observed in the clinical setting. Our data suggest that the activity of anti-CTLA-4 in inflamed tumors may be improved through enhancement of FcγR binding, whereas poorly infiltrated tumors will likely require combination approaches.

Keywords: CTLA-4; Fc-gamma receptors; IgG subclass; antibody-dependent cell-mediated cytotoxicity; immune checkpoints; immune regulatory antibodies; ipilimumab; regulatory T cell depletion; tremelimumab; tumor immunotherapy.


Figures

None
Graphical abstract
Figure 1
Figure 1
CTLA-4, GITR, ICOS and OX40 Are Highly Expressed by Tumor-Infiltrating Treg Cells (A–C) Mice (n = 5) were injected subcutaneously (s.c.) with B16, MCA205, MC38 (C57BL/6 mice) or CT26 (Balb/c mice) cells. Ten days later, cell suspensions of PBMC, draining LNs and tumor-infiltrating lymphocytes (TILs) were stained and analyzed by flow cytometry. (A) Representative histograms of CTLA-4 expression detected by intracellular staining of individual T cell subsets in mice with MCA205 tumors. Dotted lines represent the gates, numbers indicate the percentage of CTLA-4+ cells. (B and C) Percentage (B) and MFI (C) of CTLA-4-expressing cells in murine PBMCs, LNs, and TILs in different tumor models. (D) Representative histograms of CTLA-4 expression detected by intracellular staining of T cell subsets in PBMCs and TILs in a patient with advanced melanoma. (E and F) Percentage (E) and MFI (F) of CTLA-4 expression in T cells in PBMCs and TILs of patients with advanced melanoma (n = 8), early-stage NSCLC (n = 8) and RCC (n = 8). (G) Heatmap demonstrating the percentage of cells expressing co-inhibitory and co-stimulatory molecules within the indicated T cell subsets quantified by flow cytometry. Each row represents an individual murine or human tumor (n = 5). (H) MFI of the indicated co-inhibitory and co-stimulatory molecules in PBMCs and TILs in patients with melanoma. Horizontal bars represent the mean; error bars show ± standard error of the mean (SEM). p < 0.05; ∗∗∗∗p < 0.0001. See also Table S1 and Figure S1.
Figure 2
Figure 2
Expression Pattern of FcγRs in hFcγR Mice and Human Tumors The expression of hFcγRs was analyzed by flow cytometry in leukocyte suspensions obtained from blood and MCA205 tumors in hFcγR mice and from metastatic deposits of human melanoma and paired blood samples. (A) Representative histograms demonstrating FcγR expression on CD3+ T cells, CD19+ B cells, NK1.1+ NK cells, CD11b+NK1.1Ly6GCD11clow/− monocyte/macrophages (Mo/MΦ) and CD11b+Ly6G+ granulocytes isolated from hFcγR mice 10 days after s.c. tumor inoculation. (B) Percentage of expression of FcγRs in hFcγR mice from (A) (n = 3). Results are representative of three independent experiments. (C) Representative histograms demonstrating FcγR expression on CD3+CD56 T cells, CD19+CD3 B cells, CD56+CD3 NK cells, CD11b+CD14+HLA-DR+ Mo/Mϕ and CD11b+CD15+CD14 granulocytes isolated from melanoma patient samples. (D) Percentage expression of FcγRs in metastatic deposits of human melanoma from (B) (n = 10). Error bars show ±SEM. p < 0.05; ∗∗p < 0.01; ∗∗∗p < 0.001; ∗∗∗∗p < 0.0001. See also Figure S2 and Table S2.
Figure 3
Figure 3
Anti-CTLA-4 Antibodies of IgG1 and IgG2 Isotype Mediate Depletion of CTLA-4-Expressing Target Cells In Vitro (A) SPR analysis of anti-murine CTLA-4 with human IgG variants. Large graphs demonstrate interaction of free monomeric FcγRs at increasing FcγR concentrations with immobilized IgG variants; inset graphs show interaction of immobilized IgG variants with aggregated low-affinity FcγRs at increasing concentrations. RU, response units. (B) Schematic representation of the mechanism of action of chimeric anti-mCTLA-4 antibodies and predicted ADCC activity for each human IgG variant. (C) In vitro ADCC assay with human monocyte-derived macrophages and mCTLA-4+ target cells in the presence of anti-mCTLA-4 mAbs with different human IgG variants. (D) ADCC assay in the presence of CD32a or CD32b-blocking F(ab’)2 antibody fragments and with a deglycosylated IgG2 mAb (IgG2EndoS). Results are representative of three independent experiments. Error bars show ±SEM of experimental triplicates. p < 0.05; ∗∗p < 0.01; ∗∗∗p < 0.001; ∗∗∗∗p < 0.0001. See also Figure S3.
Figure 4
Figure 4
Intra-tumoral Treg Cell Depletion Is Required for the Anti-tumor Activity of Anti-CTLA-4 Mice were treated with 200 μg of anti-CTLA-4 on days 6 and 9 after s.c. inoculation of MCA205 tumor cells (n = 9–21). TILs, LNs, and PBMCs were processed on day 11 and stained for flow cytometry analysis. (A) Percentage of FoxP3+CD4+ Treg cells from total CD4+ T cells. (B) CD8+/Treg cell ratio in the indicated sites. Horizontal bars represent the mean. (C) Percentage of Ki67-expressing CD4+FoxP3 and CD8+ T cells. (D) Percentage of CD4+FoxP3 and CD8+ T cells expressing IFNγ following re-stimulation with phorbol 12-myristate 13-acetate (PMA) and ionomycin; cumulative data of three separate experiments. Error bars show ±SEM. (E and F) hFcγR mice were treated with anti-CTLA-4 on days 6, 9, and 12 after s.c. inoculation of MCA205 (50 μg/dose), MC38 (100 μg/dose) or B16 (200 μg/dose) tumor cells. (E) MCA205 tumor growth in individual hFcγR mice in each treatment group. Inset numbers show the fraction of mice with complete long-term response. (F) Kaplan-Meier curves demonstrating survival of hFcγR mice for each tumor model. The total number of mice in each treatment group is shown at the right. p < 0.05; ∗∗p < 0.01; ∗∗∗p < 0.001; ∗∗∗∗p < 0.0001. See also Figure S4.
Figure 5
Figure 5
Human FcγR Polymorphisms Impact Response to Ipilimumab in Patients with Advanced Melanoma (A) Anti-CTLA-4 response rate analysis in two separate cohorts of advanced melanoma patients, as published by Van Allen et al. (2015) (top) and Snyder et al. (2014) (bottom). For each analysis patients are split into four groups: (1) high load of somatic mutations and presence of germline high-affinity CD16a-V158F polymorphism (SNP+), (2) high load of somatic mutations and absence of germline CD16a-V158F polymorphism (SNP), (3) low load of somatic mutations and SNP+, and (4) low load of somatic mutations and SNP. Both homozygous and heterozygous patients were included in the SNP+ groups. Two different measures of mutational load were tested (McGranahan et al., 2016, Turajlic et al., 2017): (left) the number of frameshift indel mutations and (right) the number of non-synonymous single-nucleotide variant (nsSNV) neoantigens. In all cases, high and low are defined as above or below the median value, respectively. In each analysis, patient group (1) is tested for a difference in response rate compared with groups 2–4 using Fisher's exact test. Meta-analysis for each measure (pmeta), across the two patient cohorts was conducted using the Fisher's method of combining p values from independent tests. (B) Survival analysis of patients with advanced melanoma treated with anti-CTLA-4 with low (≤median) or high (>median) predicted neoantigen burden with or without the germline polymorphism CD16a-V158F. Log rank p values are displayed with hazard ratio (HR) and confidence interval (CI). In (A) and (B), patients from the Snyder et al. (2014) cohort treated with tremelimumab (n = 3) were excluded. (C) Boxplot showing the expression level of key immune markers from patients with available RNA-seq data from the Van Allen et al. (2015) cohort (n = 30): CD8A, ratio of CD8A divided by FOXP3 and cytolytic activity (defined as the log-average of GZMA and PRF expression). Patients are grouped into responders with high mutational load (based on either measure) and SNP+, compared with all other patients. Boxes show the middle quartile (25%–75%); horizontal bars represent the median; whiskers show either the maximum and minimum values in the dataset or ±1.5 times the interquartile range if the maximum and minimum values exceed these limits. TPM, transcripts per million. (D) Extension of the response rate analysis from (A), top left, with the following additional two groups: high mutational load (for both measures) plus high CD8A expression (>median) plus SNP+ and high mutational load (for both measures) plus SNP+ (top bar graph). In addition, high CD8A expression plus SNP+ and high CD8A expression plus SNP were compared (bottom bar graph). Due to the small RNA-seq sample size (n = 30), differences were not tested for statistical significance in (C) and (D). See also Figure S5.

Comment in

Similar articles

Cited by

References

    1. Alexandrov L.B., Nik-Zainal S., Wedge D.C., Aparicio S.A., Behjati S., Biankin A.V., Bignell G.R., Bolli N., Borg A., Børresen-Dale A.L. Signatures of mutational processes in human cancer. Nature. 2013;500:415–421. - PMC - PubMed
    1. Bruhns P., Iannascoli B., England P., Mancardi D.A., Fernandez N., Jorieux S., Daëron M. Specificity and affinity of human Fcγ receptors and their polymorphic variants for human IgG subclasses. Blood. 2009;113:3716–3725. - PubMed
    1. Bulliard Y., Jolicoeur R., Windman M., Rue S.M., Ettenberg S., Knee D.A., Wilson N.S., Dranoff G., Brogdon J.L. Activating Fc γ receptors contribute to the antitumor activities of immunoregulatory receptor-targeting antibodies. J. Exp. Med. 2013;210:1685–1693. - PMC - PubMed
    1. Bulliard Y., Jolicoeur R., Zhang J., Dranoff G., Wilson N.S., Brogdon J.L. OX40 engagement depletes intratumoral Tregs via activating FcγRs, leading to antitumor efficacy. Immunol. Cell Biol. 2014;92:475–480. - PubMed
    1. Cartron G., Dacheux L., Salles G., Solal-Celigny P., Bardos P., Colombat P., Watier H. Therapeutic activity of humanized anti-CD20 monoclonal antibody and polymorphism in IgG Fc receptor FcgammaRIIIa gene. Blood. 2002;99:754–758. - PubMed

Publication types

MeSH terms