. 2018 Apr 5;173(2):499-514.e23.
doi: 10.1016/j.cell.2018.02.037. Epub 2018 Mar 22.

Profound Tissue Specificity in Proliferation Control Underlies Cancer Drivers and Aneuploidy Patterns

Affiliations

Profound Tissue Specificity in Proliferation Control Underlies Cancer Drivers and Aneuploidy Patterns

Laura Magill Sack et al. Cell. .

Abstract

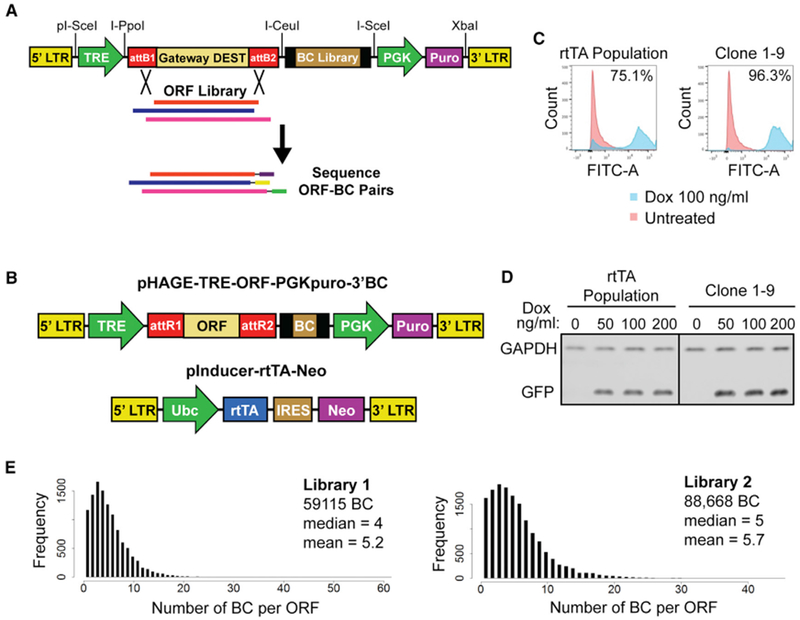
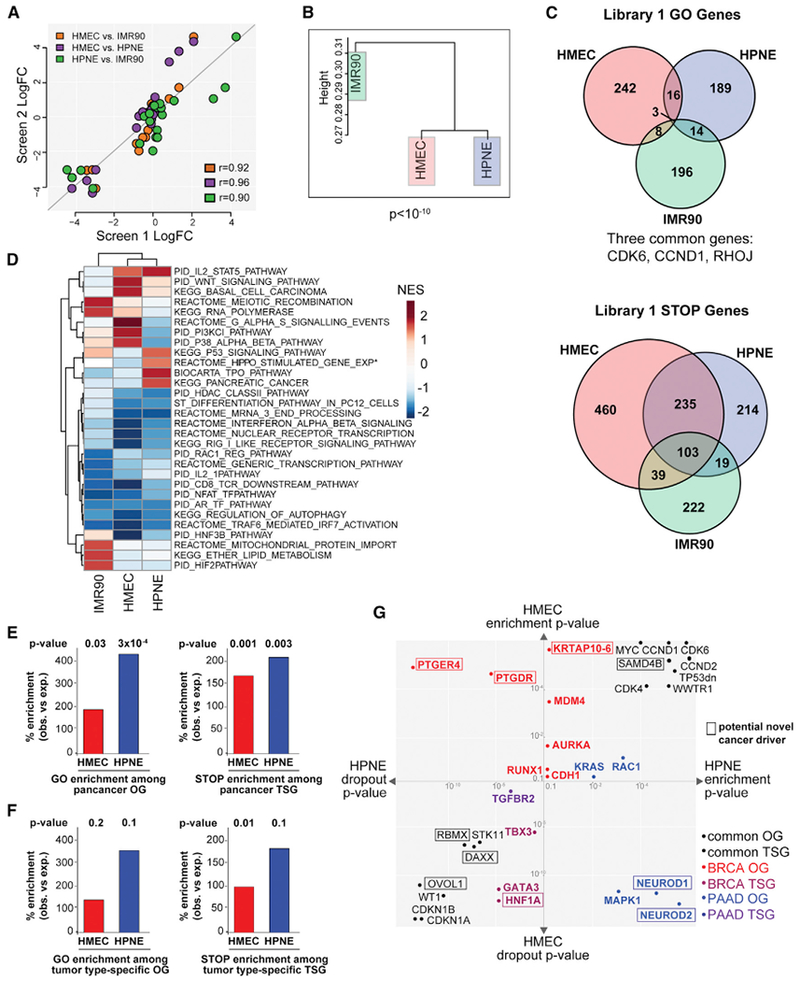
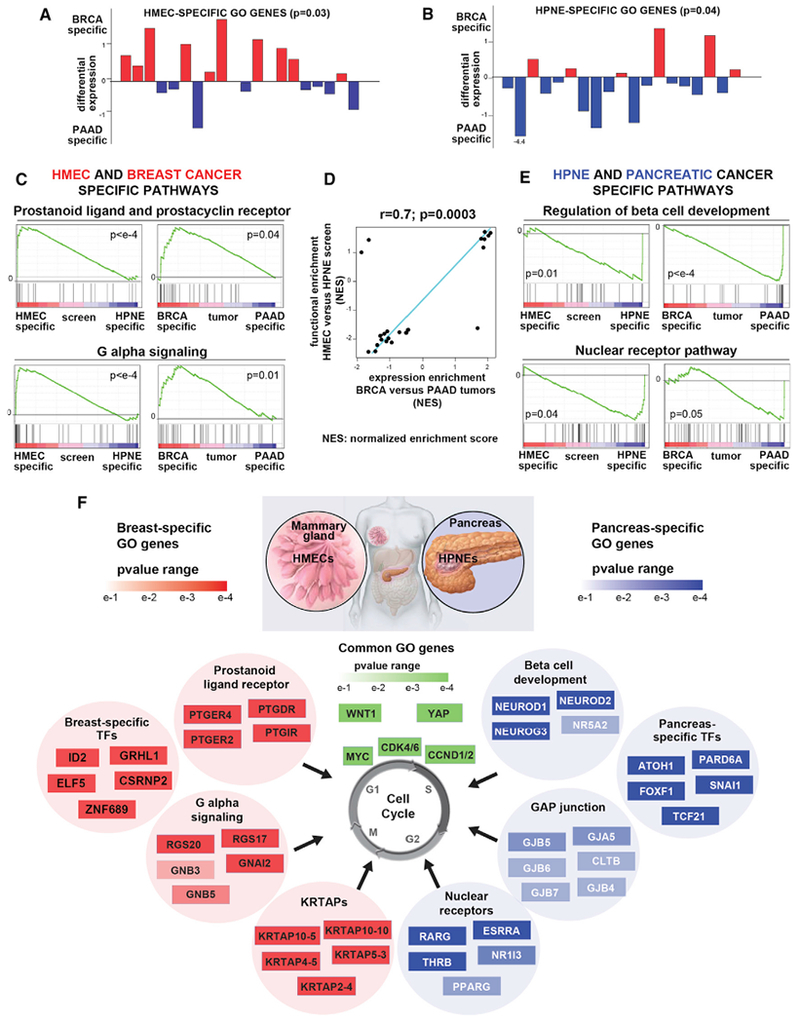
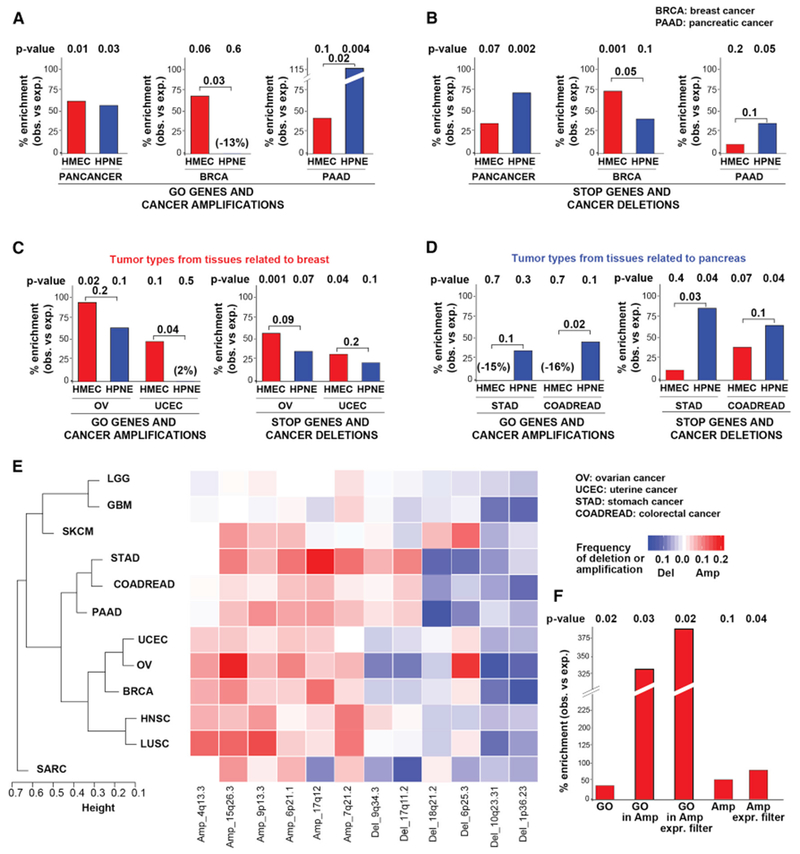
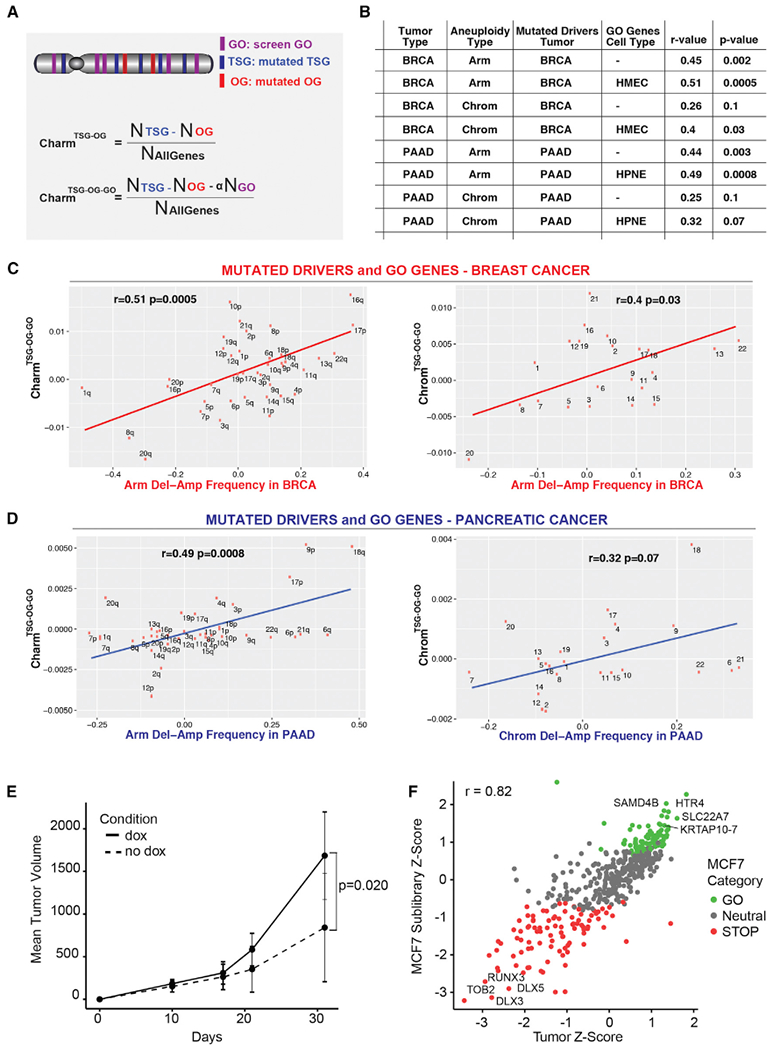
Genomics has provided a detailed structural description of the cancer genome. Identifying oncogenic drivers that work primarily through dosage changes is a current challenge. Unrestrained proliferation is a critical hallmark of cancer. We constructed modular, barcoded libraries of human open reading frames (ORFs) and performed screens for proliferation regulators in multiple cell types. Approximately 10% of genes regulate proliferation, with most performing in an unexpectedly highly tissue-specific manner. Proliferation drivers in a given cell type showed specific enrichment in somatic copy number changes (SCNAs) from cognate tumors and helped predict aneuploidy patterns in those tumors, implying that tissue-type-specific genetic network architectures underlie SCNA and driver selection in different cancers. In vivo screening confirmed these results. We report a substantial contribution to the catalog of SCNA-associated cancer drivers, identifying 147 amplified and 107 deleted genes as potential drivers, and derive insights about the genetic network architecture of aneuploidy in tumors.

Keywords: KRTAP; ORF screens; SCNA; aneuploidy; cancer drivers; gain of function screens; genetic screens; proliferation; tissue specificity.


Conflict of interest statement

DECLARATION OF INTERESTS

The authors declare no competing interests.

Figures

Figure 1.
Figure 1.. Modular Barcoded Human ORF Libraries and Inducible Expression System
(A) Construction of ORF library expression vector. Libraries of random oligos (BC Library) flanked by primer landing sites were cloned into the vector using rare unique restriction sites I-CeuI and I-SceI. ORF collections were cloned into Gateway DEST site by LR recombination. The libraries were then sheared and resulting ORF-BC pairs were recovered by PCR and identified by paired-end sequencing. LTR, long terminal repeat; TRE, tetracycline responsive element; DEST, Gateway Destination cassette; attB1/2, Gateway recombination sites; PGK, phosphoglycerate kinase 1 promoter; Puro, puromycin resistance gene. (B) Maps of two-component system for inducible expression of barcoded ORFs. ORFs are expressed from pHAGE-TRE-ORF-PGK puro-3′BC library vector under control of the reverse tetracycline transactivator (rtTA), which is expressed from pInducer-rtTA-Neo. Ubc, ubiquitin C promoter; IRES, internal ribosome entry site; Neo, neomycin resistance gene. (C) Flow cytometry measurement of induction of GFP expressed from pHAGE-TRE-ORF-PGKPuro-3′BC in either a heterogeneously infected population of rtTA-Neo expressing HMECs or a clonal rtTA-HMEC line (Clone 1-9). Cells were induced with 100 ng/mL dox for 48 hr before analysis or left untreated. (D) Western blot for GFP expression at indicated dox concentrations (in ng/mL) in parental rtTA-HMEC population and rtTA-HMEC Clone 1-9. GAPDH is used as a loading control. (E) Distribution of the frequency of ORFs paired to a given number of unique BCs in each of the ORF libraries. See also Figure S1 and Table S1.
Figure 2.
Figure 2.. Genome Scale Proliferation Screens in Three Human Cell Types Reveal Patterns of Tissue Specificity
(A) Scatterplot of log2FC of genes from Reactome G1 pathway in each Library 1 screen. Each pairwise comparison is indicated by color. Pearson’s product-moment correlation coefficient is indicated (r). (B) Hierarchical clustering of Library 1 screen data. (C) Venn diagrams depicting GO and STOP genes with p < 0.01 from each Library 1 screen. (D) Heatmap of GSEA normalized enrichment score (NES) for the 5 most enriched gene sets among the top enriched or depleted genes from each screen. Asterisk indicates a nominal p value > 0.05 but < 0.1. (E and F) Bar plots depicting the percent enrichment (over expected) of GO (left) or STOP (right) genes from the HMEC or HPNE screens in a set of known OGs (left) or TSGs (right). OGs and TSGs are from pancancer analyses (E) or tumor-type-specific analyses (F). GO and STOP genes are defined as the genes with (combined) p value < 0.01. p values are from the one-tailed Fisher’s exact test. (G) Scatterplot highlighting selected genes from the HMEC and HPNE screens. The axes represent the p value for enrichment (pE) or depletion (pD) in the HMEC (y axis) or HPNE (x axis) screen. Different scales are used for pE and pD because p values for dropout were generally smaller than those for enrichment and genes enriched with p value < e-4 or decreased with a p value < e-10 are not drawn to scale. Genes include OGs and TSGs common or specific for BRCA/PAAD (colored points indicate category) (Table S2H). Putative OGs or TSGs not previously well-characterized are marked by a box. Genes that had significant, opposite behaviors in both cell lines are plotted using their pE and pD as appropriate. “TP53 dn” refers to the dominant negative mutant TP53 ORF. See also Figure S2.
Figure 3.
Figure 3.. Cell-Type-Specific GO Genes Recapitulate Tissue-Specific Expression Signatures
(A and B) Plot of differential expression score for each HMEC-specific (A) or HPNE-specific (B) GO genes. Specific GO genes are defined as genes that enrich ≥3 fold in the HMEC (A) or HPNE (B) screen and do not enrich in HPNE (A) or HMEC (B). p values were calculated by bootstrapping. See Figures S3A and S3B for STOP genes. (C and E) Pathways with differential expression in breast versus pancreatic tumors and pathways with differential functional enrichment in HMEC versus HPNE screen were identified as described in (D) below. Examples of GSEA plots for the indicated pathways specific for BRCA/HMEC (C) or PAAD/HPNE (E) are shown. (D) Similarity between pathways with differential expression in breast versus pancreatic tumors (RNA-seq-based differential expression score between BRCA and PAAD, y axis) and pathways with differential functional enrichment in the HMEC versus HPNE screens (differential enrichment score between HMEC and HPNE, x axis). Top-scoring GSEA pathways (FDR <0.1, absolute value of ES > 0.75) are shown (see STAR Methods). Pearson correlation coefficient (r) and p value are shown. NES, normalized enrichment score. (F) Examples of pathways and/or gene sets enriched among the GO genes specific for HMEC (left) or HPNE (right) are shown. The top 4–6 most enriched genes from each pathway are shown with a heatmap representing their pE in HMEC or HPNE. GO genes that function as transcription factors (TFs) in HMEC or HPNE and are also specifically upregulated in the cognate cancer type are also shown. Genes shown in green were common GO genes in both cell lines. See also Figure S3 and Table S3.
Figure 4.
Figure 4.. KRTAPs Are a Family of Candidate Proliferation Drivers
(A) Individual validation of selected HMEC ORF GO genes by multi-color competition assay (MCA). Bar plot shows the percent of ORF-expressing cells after 6 PDs of culture from a starting mixture of 50:50 with EV cells. Error bars ± SD. Asterisk represents an ORF that was not in the screening library but was included in the validation experiment. (B) Distribution of HMEC average Log2FC of KRTAP ORFs (top) and neutral gene family Olfactory Receptor ORFs (bottom). (C) Distribution of average log2FC of KRTAP ORFs in HPNE (top) and IMR90 (bottom) screens. (D) HMEC average log2FC values for KRTAP ORFs arranged by sub-family. GO gene sub-families are labeled in red, and selected neutral subfamilies are labeled in gray. (E) Bar plots of normalized expression of KRTAP (GO or neutral) genes in breast cancer subtypes and normal mammary gland tissue. Normal, normal tissue; ER/PR, ER or PR positive; HER2, HER2-positive; TPBC, triple positive breast cancer (ER/PR positive and HER2 positive); TNBC, triple negative breast cancer. Tumor type and p value (Wilcoxon rank sum test) are indicated above each plot. (F) Heatmap of top enriched gene sets among most overexpressed and under-expressed genes in each sample, based on GSEA analysis of RNA-seq data. The heatmap depicts GSEA normalized enrichment score (NES) for each pathway in each sample and is annotated to reflect some of the predominant trends in indicated clusters. (G) E2F1 mRNA levels (from RNA-seq) after overexpression of the indicated ORF (and in TP53KO) in HMECs as compared to empty vector (EV). Error bars ± SD. (H) Western blot for E2F1 protein levels in cells expressing indicated ORF or empty vector (EV). Vinculin (VINC) was used as a loading control. Normalized expression levels are shown below the blot. (I) Western blot for E2F1 protein levels in cells utilized for (J). Vinculin (VINC) is used as a loading control. (J) Bar plot showing proliferation rate (shown as percentage change compared to EV control) of HMECs expressing empty vector (EV), KRTAP10-6 (KAP10-6), or KRTAP4-5 (KAP4-5). Cells were transduced with shRNAs targeting E2F1, or with a control shRNA targeting OR11L1. Cells without any shRNA were also tested. Error bars ± SD. See also Figure S4 and Table S4.
Figure 5.
Figure 5.. GO and STOP Genes Recapitulate Tissue-Specific Patterns of SCNA in Cancer
(A and B) Bar plots depicting the percent enrichment (over expected) of HMEC (red) or HPNE (blue) GO (A) or STOP (B) genes in amplicons (A) or deletions (B) from the indicated cancer type. SCNA data are from GISTIC2 analysis of primary tumors (see STAR Methods). p values are from one-tailed Fisher’s exact test. For the tumor-type-specific analyses, bootstrapping-based analysis was performed to test whether the difference between the enrichment for the HMEC and HPNE screens was statistically significant (see STAR Methods). (C and D) Bar plots as in (A) depicting percent enrichment of HMEC and HPNE GO and STOP genes in tumors related to breast (C) or to pancreas (D). (E) Heatmap and hierarchical clustering of SCNA patterns across tumor types (Table S5E). Representative SCNAs are shown. (F) Bar plot showing % enrichment (over expected) of the indicated HMEC gene set among genes depleted from RNAi screens in breast cancer cell lines. GO, top 1,000 HMEC enriched genes; GO in Amp, GO genes within BRCA focal amplicons; GO in Amp Expr Filter, GO genes within BRCA focal amplicons after filtering out low expressed genes in BRCA (bottom 30%); Amp, genes in BRCA focal amplicons; Amp Expr Filter,: genes in BRCA focal amplicons after filtering out low expressed genes. p values are from one-tailed Fisher’s exact test. See also Figure S5 and Table S5.
Figure 6.
Figure 6.. STOP and GO Genes Help Predict Aneuploidy Patterns and Recapitulate Proliferation Phenotypes in Tumors
(A) Schematics showing the calculation of the Charm score for mutated drivers (TSG and OG) alone (CharmTSG-OG; above) and mutated drivers plus GO proliferation drivers (CharmTSG-OG-GO; below). Similar methods were utilized to determine the Chrom scores (see STAR Methods). (B) Table showing the relationship between the deletion-amplification frequency of arm (or chromosomes) for the indicated tumor types with the Charm or Chrom scores derived using the mutated TSG/OG from BRCA or PAAD and the GO genes (when indicated) from HMEC or HPNE. Pearson’s correlation coefficient (r) and p value are indicated. (C and D) Correlation between the CharmTSG-OG-GO (or ChromTSG-OG-GO) score determined using the mutated TSG/OG from BRCA (C) or PAAD (D) and the HMEC GO genes (C) or HPNE GO genes (D) and the deletion-amplification frequency in BRCA (C) or PAAD (D) at the arm or chromosome level, as indicated. (E) MCF7 tumor volume over time following implantation of ORF sublibrary cells into cleared mammary fat pads of NSG mice. Tumor volumes from each flank in a single mouse were summed, and the mean was computed across all dox mice (n = 9) and all no dox mice (n = 3). Error bars ± SD. p value was determined by one-tailed Student’s t test. (F) Scatterplot of the Z score for genes in the MCF7 Sublibrary proliferation screen versus MCF7 Tumor screen, colored according to MCF7 Sublibrary gene category. Pearson’s product-moment correlation coefficient (r) is indicated. See also Figures S6 and S7 and Table S6.
Figure 7.
Figure 7.. Annotation of the Cancer Genome with Amplified GO Genes
Schematic representation of the human genome with recurrent focal amplicons of three cancer datasets (BRCA, PAAD, and pan-cancer) indicated by colored bands. GO genes (defined as the top 1,000 genes from the HMEC and HPNE screens) found within pan-cancer or BRCA peaks (HMEC) or within pan-cancer or PAAD peaks (HPNE) are indicated, and the text color corresponds to the screen in which they scored. Only GO genes that are within the top 70% of expressed genes in cancer are depicted (see STAR Methods). For BRCA peaks, both GISTIC2 and ISAR predictions were considered. Colored tracks to the left of chromosomes indicate relative peak locations. Peaks are not drawn to scale. See also Table S7.

Comment in

References

    1. Asselin-Labat M-L, Sutherland KD, Barker H, Thomas R, Shackleton M, Forrest NC, Hartley L, Robb L, Grosveld FG, van der Wees J, et al. (2007). Gata-3 is an essential regulator of mammary-gland morphogenesis and luminal-cell differentiation. Nat. Cell Biol 9, 201–209. - PubMed
    1. Bailey P, Chang DK, Nones K, Johns AL, Patch A-M, Gingras M-C, Miller DK, Christ AN, Bruxner TJC, Quinn MC, et al.; Australian Pancreatic Cancer Genome Initiative (2016). Genomic analyses identify molecular subtypes of pancreatic cancer. Nature 531, 47–52. - PubMed
    1. Barretina J, Caponigro G, Stransky N, Venkatesan K, Margolin AA, Kim S, Wilson CJ, Lehar J, Kryukov GV, Sonkin D, et al. (2012). The Cancer Cell Line Encyclopedia enables predictive modelling of anticancer drug sensitivity. Nature 483, 603–607. - PMC - PubMed
    1. Beroukhim R, Mermel CH, Porter D, Wei G, Raychaudhuri S, Donovan J, Barretina J, Boehm JS, Dobson J, Urashima M, et al. (2010). The land-scape of somatic copy-number alteration across human cancers. Nature 463, 899–905. - PMC - PubMed
    1. Cong L, Ran FA, Cox D, Lin S, Barretto R, Habib N, Hsu PD, Wu X, Jiang W, Marraffini LA, and Zhang F (2013). Multiplex genome engineering using CRISPR/Cas9 systems. Science 339, 819–823. - PMC - PubMed

Publication types

MeSH terms