

Metabolic Slowing and Reduced Oxidative Damage with Sustained Caloric Restriction Support the Rate of Living and Oxidative Damage Theories of Aging
- PMID: 29576535
- PMCID: PMC5886711
- DOI: 10.1016/j.cmet.2018.02.019
Metabolic Slowing and Reduced Oxidative Damage with Sustained Caloric Restriction Support the Rate of Living and Oxidative Damage Theories of Aging
Abstract
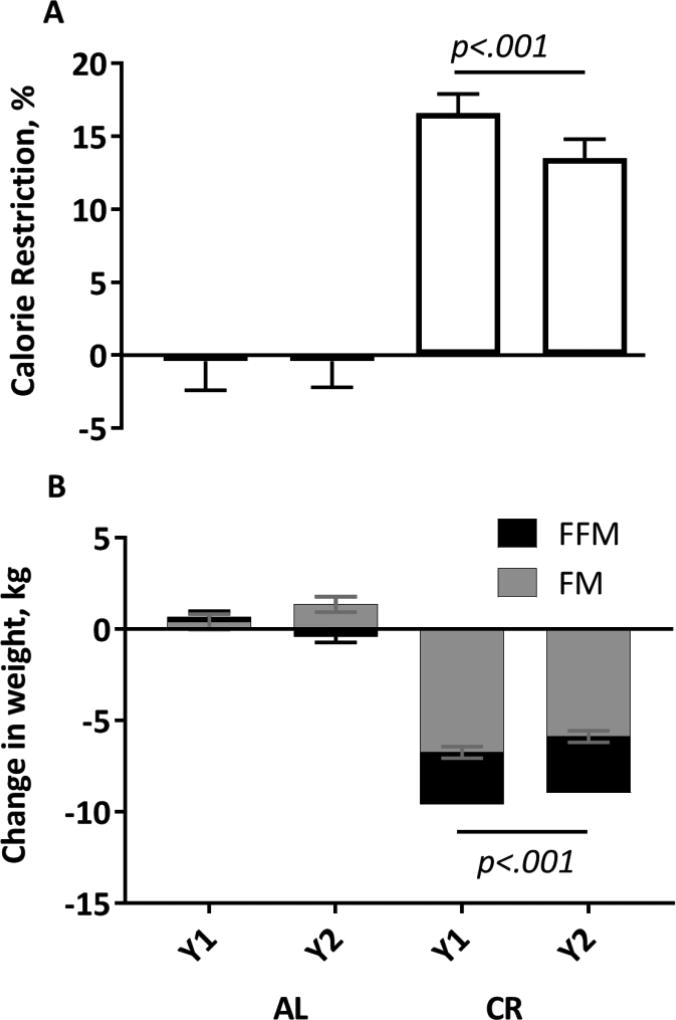
Calorie restriction (CR) is a dietary intervention with potential benefits for healthspan improvement and lifespan extension. In 53 (34 CR and 19 control) non-obese adults, we tested the hypothesis that energy expenditure (EE) and its endocrine mediators are reduced with a CR diet over 2 years. Approximately 15% CR was achieved over 2 years, resulting in an average 8.7 kg weight loss, whereas controls gained 1.8 kg. In the CR group, EE measured over 24 hr or during sleep was approximately 80-120 kcal/day lower than expected on the basis of weight loss, indicating sustained metabolic adaptation over 2 years. This metabolic adaptation was accompanied by significantly reduced thyroid axis activity and reactive oxygen species (F2-isoprostane) production. Findings from this 2-year CR trial in healthy, non-obese humans provide new evidence of persistent metabolic slowing accompanied by reduced oxidative stress, which supports the rate of living and oxidative damage theories of mammalian aging.
Trial registration: ClinicalTrials.gov NCT00427193 NCT02695511.
Keywords: aging; energy expenditure; intervention; nutrition.
Copyright © 2018 Elsevier Inc. All rights reserved.
Conflict of interest statement
The authors declare no financial conflicts of interest in association with the research described in this paper.
Figures


Comment in
-
Reduced-calorie diet shows signs of slowing ageing in people.Nature. 2018 Mar 29;555(7698):570-571. doi: 10.1038/d41586-018-03431-x. Nature. 2018. PMID: 29595781 No abstract available.
-
Sustained caloric restriction in health.Nat Rev Endocrinol. 2018 Jun;14(6):322. doi: 10.1038/s41574-018-0008-2. Nat Rev Endocrinol. 2018. PMID: 29651021 No abstract available.
References
-
- Alexeyev MF, Ledoux SP, Wilson GL. Mitochondrial DNA and aging. Clin Sci (Lond) 2004;107:355–364. - PubMed
-
- Ballor DL. Effect of dietary restriction and/or exercise on 23-h metabolic rate and body composition in female rats. J Appl Physiol. 1991:801–806. - PubMed
-
- Blanc S, Schoeller D, Kemnitz J, Weindruch R, Colman R, Newton W, Wink K, Baum S, Ramsey J. Energy expenditure of rhesus monkeys subjected to 11 years of dietary restriction. J Clin Endocrinol Metab. 2003;88:16–23. - PubMed
-
- Brookes PS. Mitochondrial H(+) leak and ROS generation: an odd couple. Free Radic Biol Med. 2005;38:12–23. - PubMed
Publication types
MeSH terms
Associated data
Grants and funding
LinkOut - more resources
Full Text Sources
Other Literature Sources
Medical
Miscellaneous
