. 2018 Apr 10;10(4):1282-1293.
doi: 10.1016/j.stemcr.2018.02.010. Epub 2018 Mar 22.

Retinal Ganglion Cell Diversity and Subtype Specification from Human Pluripotent Stem Cells

Affiliations

Retinal Ganglion Cell Diversity and Subtype Specification from Human Pluripotent Stem Cells

Kirstin B Langer et al. Stem Cell Reports. .

Abstract

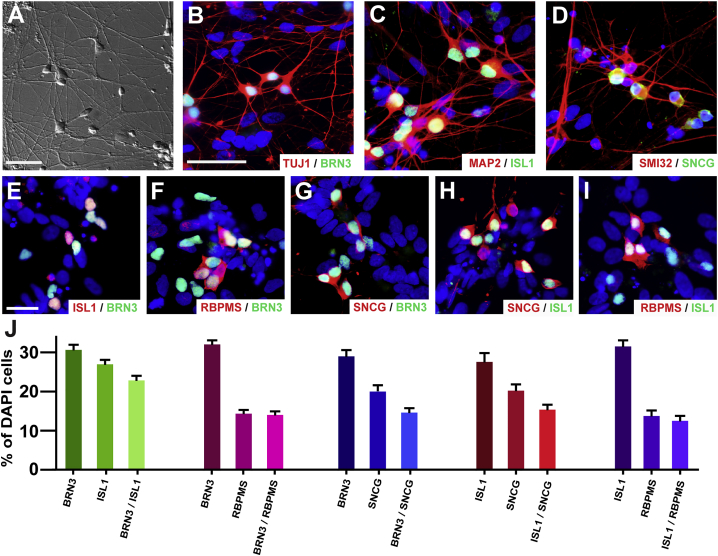
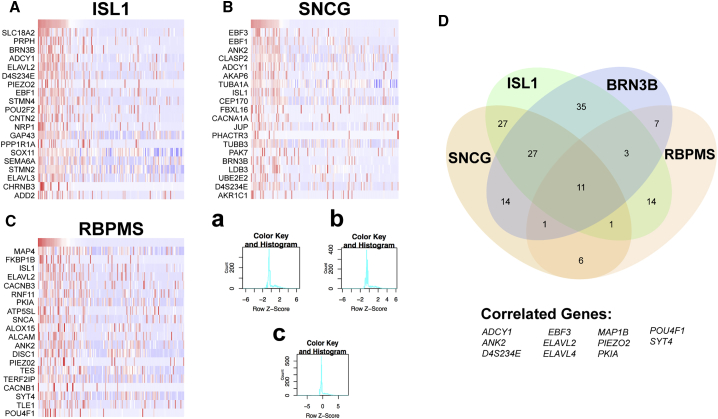
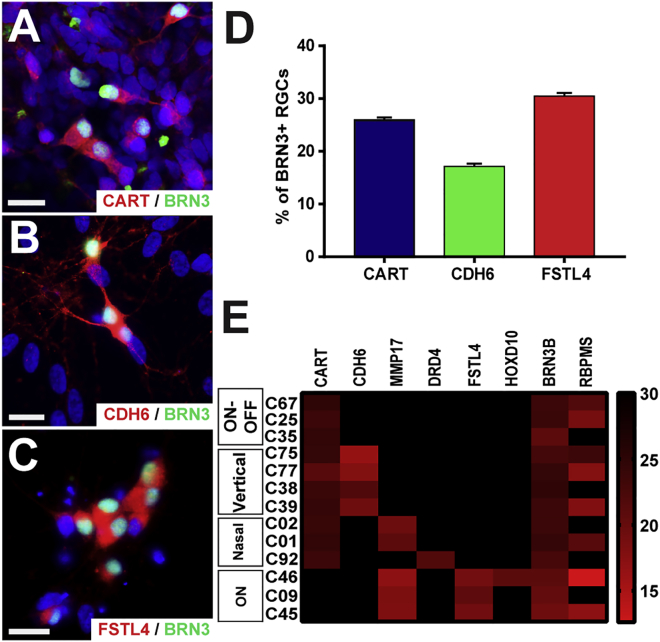
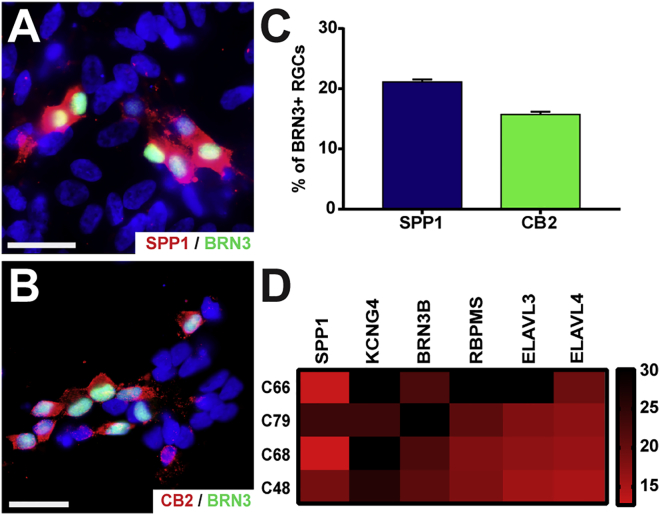
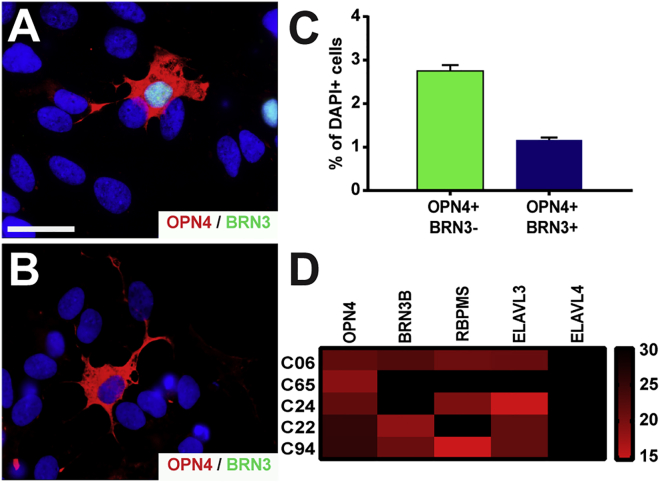
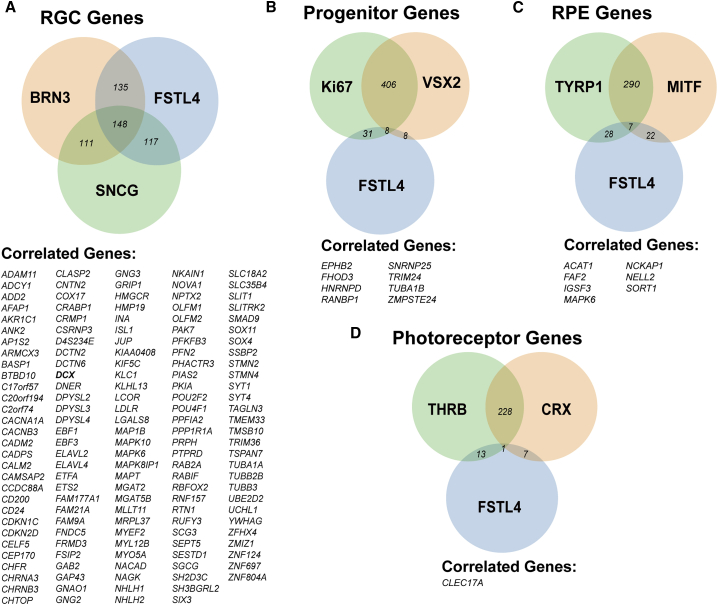
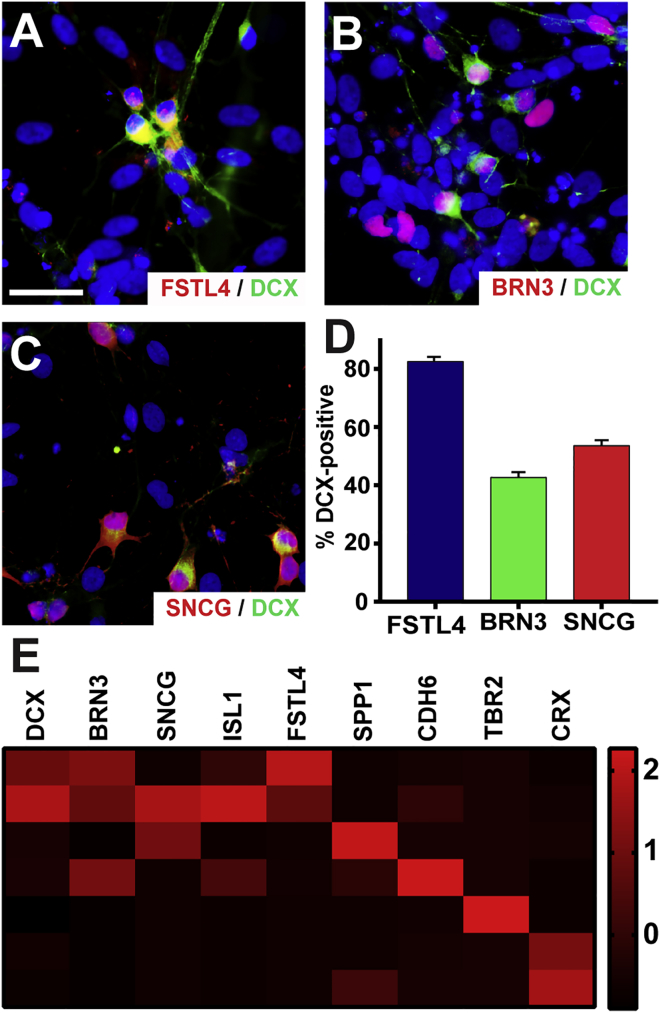
Retinal ganglion cells (RGCs) are the projection neurons of the retina and transmit visual information to postsynaptic targets in the brain. While this function is shared among nearly all RGCs, this class of cell is remarkably diverse, comprised of multiple subtypes. Previous efforts have identified numerous RGC subtypes in animal models, but less attention has been paid to human RGCs. Thus, efforts of this study examined the diversity of RGCs differentiated from human pluripotent stem cells (hPSCs) and characterized defined subtypes through the expression of subtype-specific markers. Further investigation of these subtypes was achieved using single-cell transcriptomics, confirming the combinatorial expression of molecular markers associated with these subtypes, and also provided insight into more subtype-specific markers. Thus, the results of this study describe the derivation of RGC subtypes from hPSCs and will support the future exploration of phenotypic and functional diversity within human RGCs.

Keywords: RGC subtype; RNA-seq; alpha RGC; direction selective RGC; iPSC; ipRGC; retina; retinal ganglion cell; stem cell.


Figures

Figure 1
Figure 1
hPSC-Derived RGCs Display Elaborate Morphologies and Diversity of Gene Expression (A) Differential interference contrast (DIC) imaging demonstrated morphological characteristics of hPSC-derived RGCs with large three-dimensional cell bodies, projecting numerous lengthy neurites. (B–D) Immunocytochemistry confirmed the RGC identity of these cells through the expression of specific markers such as (B) BRN3, (C) ISL1, and (D) SNCG, as well as the extension of long processes indicated by cytoskeletal markers. (E–I) In addition, analysis of RGC markers revealed varying degrees of co-expression within the RGC population, (E) ISL1 and BRN3, (F) RBPMS and BRN3, (G) SNCG and BRN3, (H) SCNG and ISL1, and (I) RBPMS and ISL1. (J) Quantification of immunocytochemistry results verified variation in RGC-associated gene expression among hPSC-derived RGCs. Scale bars, 50 μm in (A)–(D), 25 μm in (E)–(I); the scale bar in (B) applies to (B)–(D); the scale bar in (E) applies to (E)–(I). Error bars represent SEM (n = 27 technical replicates from 3 biological replicates for each bar using miPS2, H9, and H7 cell lines).
Figure 2
Figure 2
hPSC-Derived RGCs Demonstrate Unique Transcriptional Profiles (A–C) Spearman's rank correlation coefficient analysis (SRCCA) was performed on single-cell RNA-seq data using RGC-specific target genes, (A) ISL1 (B) SNCG and (C) RBPMS. Cells were ranked from highest to lowest expression and transformed into Z scores. Results were constructed into a heatmap, with the top 20 correlating genes shown for each RGC marker. Corresponding color key histograms for (A)–(C) are displayed in a–c. (D) The combination of SRCCA from four RGC target genes for the top 200 correlating genes revealed differential gene expression as well as a core set of 11 genes highly expressed within RGCs. n = 3 biological replicates using the H9 cell line.
Figure 3
Figure 3
hPSCs Give Rise to Multiple DS-RGC Subtypes (A and B) ON-OFF DS-RGCs were identified by the co-expression of the RGC marker BRN3 with either (A) CART or (B) CDH6. (C) ON DS-RGCs were identified by the expression of FSTL4 co-localized with BRN3. (D) Quantification of immunocytochemistry results identified the expression of CART, CDH6, and FSTL4 within the BRN3-RGC population at 25.95% ± 0.46%, 17.16% ± 0.51%, and 30.49% ± 0.58%, respectively. (E) Single-cell qRT-PCR analysis demonstrated the combinatorial expression of DS-RGC markers, in conjunction with RGC-associated markers. Error bars represent the SEM (n = 36 technical replicates from 3 biological replicates for each bar using miPS2, H9, and H7 cell lines). Scale bars, 20 μm.
Figure 4
Figure 4
Identification of α-RGCs in hPSC-Derived RGCs (A and B) α-RGCs were identified by the co-localization of BRN3 with either (A) SPP1 or (B) CB2. (C) Quantification of immunocytochemistry results indicated SPP1 and CB2 were co-expressed with BRN3 in 21.10% ± 0.42% and 15.72% ± 0.45% of all cells, respectively. (D) Single-cell qRT-PCR analyses demonstrated the combinatorial expression of α-RGC markers, along with the expression of pan-RGC markers. Error bars represent the SEM (n = 36 technical replicates from 3 biological replicates for each bar using miPS2, H9, and H7 cell lines). Scale bars, 30 μm.
Figure 5
Figure 5
Characterization of Intrinsically Photosensitive RGCs Derived from hPSCs (A and B) A subset of hPSC-derived cells exhibited the expression of melanopsin co-expressing either (A) with or (B) without BRN3. (C) Quantification of immunocytochemistry results was performed as a percentage of the total DAPI-positive population and melanopsin-positive/BRN3-negative cells comprised 2.75% ± 0.13% of all cells, while melanopsin-positive/BRN3-positive comprised 1.17% ± 0.06% of all cells. (D) Single-cell qRT-PCR revealed the combinatorial expression of melanopsin with a variety of other RGC-related markers. Error bars represent the SEM (n = 36 technical replicates from 3 biological replicates for each bar using miPS2, H9, and H7 cell lines). Scale bar, 50 μm.
Figure 6
Figure 6
Identification of DS-Associated Markers Using Single-Cell RNA-Seq Analysis (A) SRCCA from FSTL4, BRN3B, and SNCG were combined for the top 1,000 correlating genes, and 148 genes were found to be commonly expressed between the 3 populations. (B–D) In addition, SRCCA for FSTL4 was combined with (B) retinal progenitor genes, (C) RPE genes, and (D) photoreceptor genes and demonstrated minimal overlapping expression. n = 3 biological replicates using the H9 cell line.
Figure 7
Figure 7
Identification and Confirmation of DCX as a DS-RGC Marker (A–C) DCX was highly co-localized with (A) FSTL4, while its co-expression with pan-RGC markers (B) BRN3 and (C) SNCG demonstrated less correlation. (D) Quantification of immunocytochemistry results indicated that DCX expression correlated with 82.48% ± 1.66% of FSTL4-positive RGCs, while it was identified in subsets of BRN3- and SNCG-positive RGCs at 42.61% ± 1.88% and 53.57% ± 1.88%, respectively. (E) Single-cell RNA-seq values demonstrate expression of DCX correlated with other DS-RGC markers, but was found exclusive of markers of other RGC subtypes and retinal cells. Scale bars, 50 μm. Error bars represent SEM (n = 30 technical replicates from 3 biological replicates for each bar using miPS2, H9, and H7 cell lines).

References

    1. Berson D.M. Retinal ganglion cell types and their central projections. In: Masland R.H., Albright T.D., editors. Vol. 1. Elsevier; 2008. pp. 491–519. (The Senses: A Comprehensive Reference).
    1. Chew K.S., Renna J.M., McNeill D.S., Fernandez D.C., Keenan W.T., Thomsen M.B., Ecker J.L., Loevinsohn G.S., VanDunk C., Vicarel D.C. A subset of ipRGCs regulates both maturation of the circadian clock and segregation of retinogeniculate projections in mice. Elife. 2017;6 https://doi.org/10.7554/eLife.22861 - DOI - PMC - PubMed
    1. Croner L.J., Kaplan E. Receptive fields of P and M ganglion cells across the primate retina. Vision Res. 1995;35:7–24. - PubMed
    1. Cruz-Martín A., El-Danaf R.N., Osakada F., Sriram B., Dhande O.S., Nguyen P.L., Callaway E.M., Ghosh A., Huberman A.D. A dedicated circuit links direction-selective retinal ganglion cells to the primary visual cortex. Nature. 2014;507:358–361. - PMC - PubMed
    1. De la Huerta I., Kim I.J., Voinescu P.E., Sanes J.R. Direction-selective retinal ganglion cells arise from molecularly specified multipotential progenitors. Proc. Natl. Acad. Sci. USA. 2012;109:17663–17668. - PMC - PubMed

Publication types