. 2018 Apr 10;10(4):1222-1236.
doi: 10.1016/j.stemcr.2018.02.012. Epub 2018 Mar 22.

Human iPSC-Derived Endothelial Cells and Microengineered Organ-Chip Enhance Neuronal Development

Affiliations

Human iPSC-Derived Endothelial Cells and Microengineered Organ-Chip Enhance Neuronal Development

Samuel Sances et al. Stem Cell Reports. .

Abstract

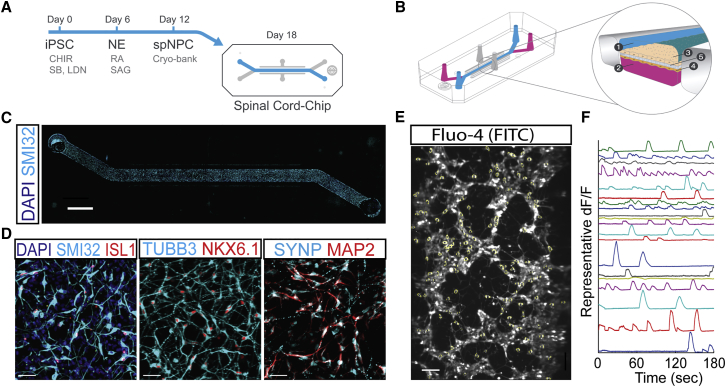
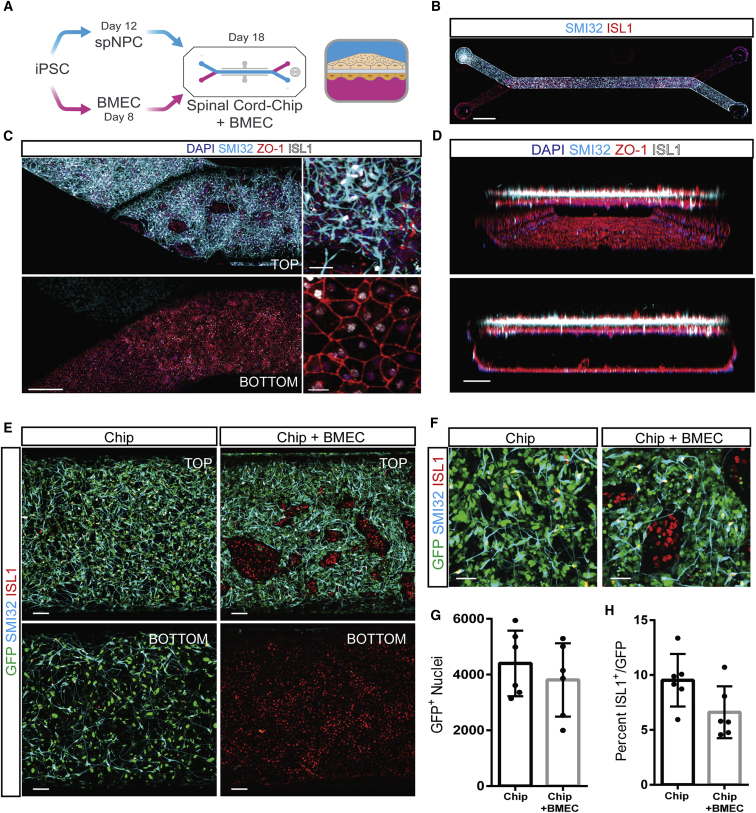
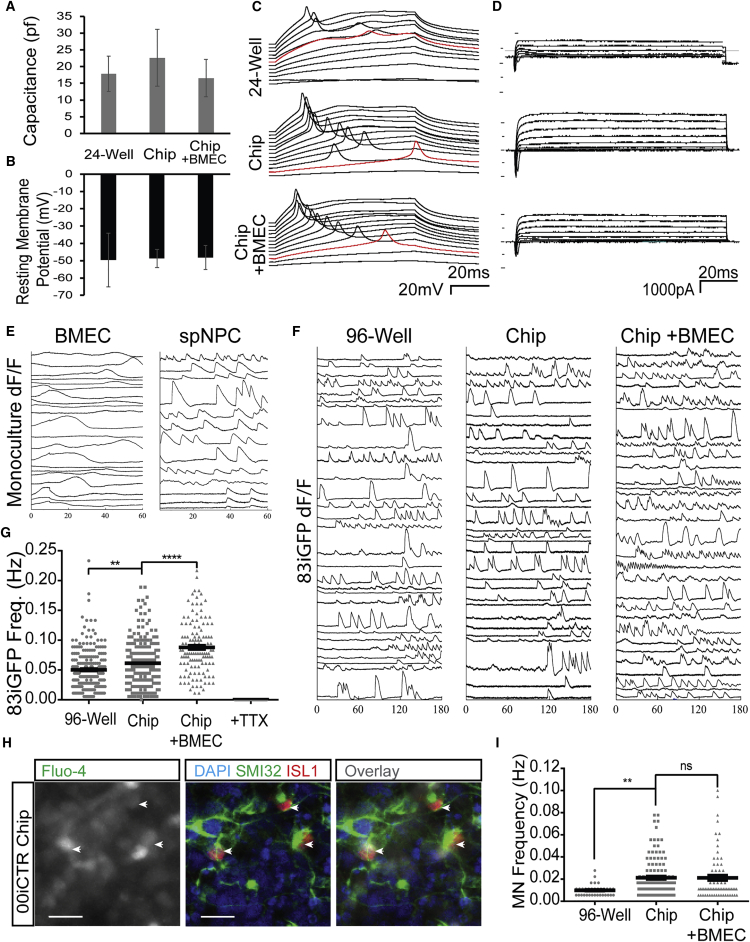
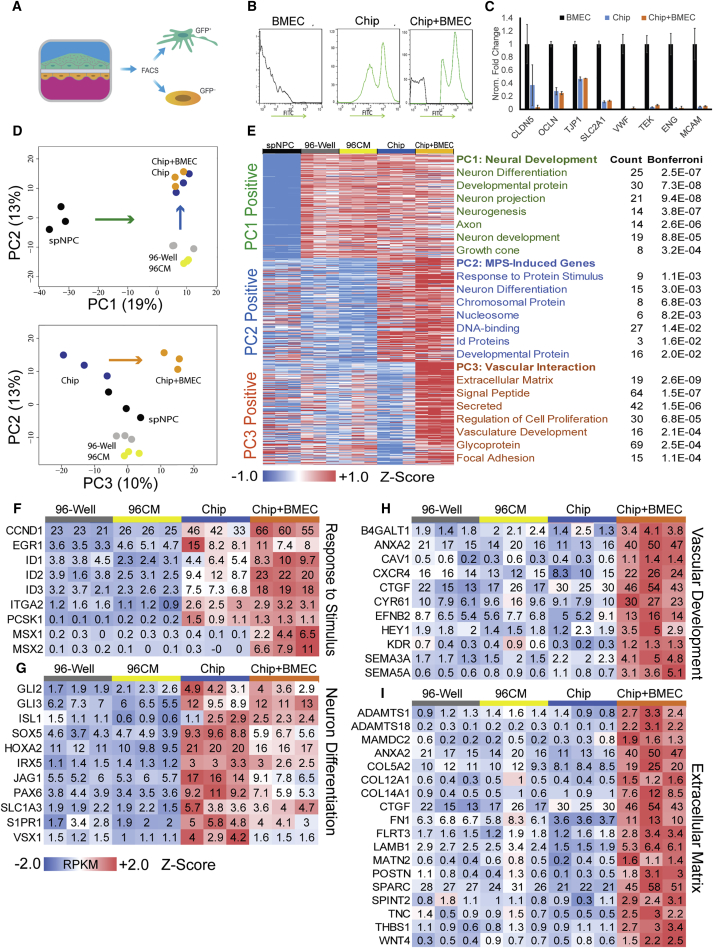
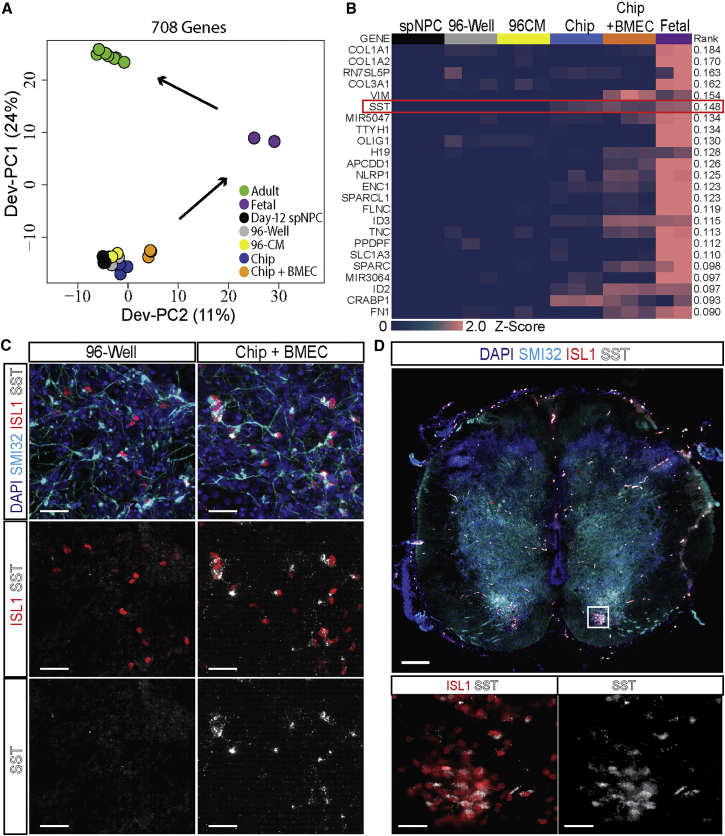
Human stem cell-derived models of development and neurodegenerative diseases are challenged by cellular immaturity in vitro. Microengineered organ-on-chip (or Organ-Chip) systems are designed to emulate microvolume cytoarchitecture and enable co-culture of distinct cell types. Brain microvascular endothelial cells (BMECs) share common signaling pathways with neurons early in development, but their contribution to human neuronal maturation is largely unknown. To study this interaction and influence of microculture, we derived both spinal motor neurons and BMECs from human induced pluripotent stem cells and observed increased calcium transient function and Chip-specific gene expression in Organ-Chips compared with 96-well plates. Seeding BMECs in the Organ-Chip led to vascular-neural interaction and specific gene activation that further enhanced neuronal function and in vivo-like signatures. The results show that the vascular system has specific maturation effects on spinal cord neural tissue, and the use of Organ-Chips can move stem cell models closer to an in vivo condition.

Keywords: amyotrophic lateral sclerosis; brain microvascular endothelial cells; disease modeling; iPSC; microfluidic device; microphysiological system; organ-on-chip; spinal cord; spinal motor neurons; vasculature.


Figures

Figure 1
Figure 1
spNPCs Survive and Mature in the Chip Microenvironment (A) Schematic of spinal neural progenitor cells (spNPC) differentiation from induced pluripotent stem cell (iPSC) cultures. Cells were fated to neural ectoderm (NE) using WNT agonist CHIR99021 and SMAD inhibitors LDN193189 and SB431542 for 6 days and then patterned to ventral spinal neurons using retinoic acid (RA) and sonic hedgehog agonist (SAG) in 6-well plates. At day 12, spNPCs were frozen, banked, and thawed for experiments (Cryo-bank). spNPCs were seeded into the top channel of the Spinal Cord-Chip and incubated for 6 days. (B) Schematic of dual-channel Chip geometry (left) and magnified cross-section (right). Top (1) and bottom (2) channels can contain distinct cultures (3 and 4), and are separated by a porous membrane (5). (C) Phosphorylated neurofilament heavy chain (SMI32) is enriched in spinal motor neurons (spMNs) and expressed in cells populating the entire top channel. Cells stained with nuclear dye DAPI. Scale bar, 200 μm. (D) Immunostaining of main channel of the Chip of markers for spMNs SMI32, nuclear marker islet1 (ISL1), Beta 3 tubulin (TUBB3), NKX6.1, neurofilament marker microtubule-associated protein 2 (MAP2), and synaptic marker synaptophysin (SYNP). Cells stained with nuclear dye DAPI. Scale bar, 40 μm. (E) Representative image of Spinal Cord-Chip neurons treated with Fluo-4 calcium activated dye and acquired live in fluorescein isothiocyanate (FITC) channel. Scale bar, 100 μm. (F) Florescence of individual active neurons normalized to baseline florescence and plotted over time (dF/F).
Figure 2
Figure 2
Co-culture of iPSC-Derived spMNs and BMECs in Spinal Cord-Chip (A) Schematic of dual differentiation and seeding paradigm in Spinal Cord-Chip seeded with BMECs. Both spNPCs and BMECs are generated from human iPSCs and seeded into top and bottom channels, respectively. Transverse section of the Spinal Cord-Chip seeded with BMECs (right) shows two compartments separated by porous membrane. (B) Immunostaining of whole Spinal Cord-Chip with spMNs expressing SMI32 in top channel and BMECs expressing ISL1 in the bottom channel. Scale bar, 1500 μm. (C) Maximum projection images cropped at membrane z plane show top and bottom compartments of seeding end of Spinal Cord-Chip immunostained with spMN markers SMI32 and islet 1 (ISL1), and tight junction marker zona occludens 1 (ZO-1). Scale bars, 400 μm (left) and 40 μm (right). (D) Confocal optical reconstruction along z-axis of Spinal Cord-Chip with computer-generated perspective view (top) exhibits confluent layer of BMECs surrounding entire bottom channel. Orthogonal view (bottom) exhibits distinct separation of cultures at 6 days separated by porous PDMS membrane. Scale bar, 100 μm. (E) Representative images of cells attached to porous membrane in the main channel (top and bottom planes). Spinal Cord-Chip was seeded either with 83iGFP spNPCs alone in the top channel (Chip) or with the addition of non-GFP BMECs in the bottom compartment. Scale bar, 100 μm. (F) High magnification of top compartment shows GFP-negative, ISL1-positive clusters indicating BMEC infiltration. Scale bar, 50 μm. (G and H) Quantification of GFP and ISL1 populations in top compartment. Error bars represent standard deviation. Plots were determined from six individual Chips from three culture rounds (dots).
Figure 3
Figure 3
Spinal Cord-Chip Environment Increases Spontaneous Neuronal Activity (A and B) Average capacitance and resting membrane potential calculated at time of access to neuron during whole-cell current-clamp recording across three culture conditions: 24-well plate, Chip, and Chip containing BMECs (n = 5, 4, and 6 neurons, respectively). (C) Membrane voltage recordings plotted over time during current-clamp. Traces are sequentially staggered for each 10-pA sweep. Red trace denotes minimum current sweep that reached action potential membrane threshold of 0 mV. (D) Voltage-clamp recordings of membrane current over time. Picofarads (pf), milliseconds (ms), millivolts (mV), picoamperes (pA). (E) Individual representative calcium transient activity of spNPC (top) and BMEC (bottom) cultures acquired at the seeding compartments where cultures do not interact. Change in florescence intensity over background (dF/F) plotted with respect to time totaling 60 s. (F) Calcium transient activity plots of 30 representative neurons plotted over time in seconds and derived from 83iGFP spNPC cultures in each culture condition. (G) Transient frequency plot of 128, 226, and 232 83iGFP-derived neurons cultured in 96-well plates, Chips, and Chips containing BMECs, respectively. Neuron activity was ablated with the administration of tetrodotoxin (TTX). (H) Immunocytochemistry staining of islet1 (ISL1) and SMI32 (right) of site previously acquired for live calcium transients using Fluo-4 dye (left). ISL1-positive neurons (arrowheads) are superimposed to determine spMN firing specificity. Scale bars, 200 μm. (I) Activity of ISL1 SMI32 double-positive neurons in three culture conditions plotted as frequency in hertz. In graphs, means are represented by black bars and error bars represent standard error of the mean. Significance was calculated by one-way ANOVA: ∗∗p < 0.01, ∗∗∗∗p < 0.001; ns, not significant.
Figure 4
Figure 4
Spinal Cord-Chip Induces Neuronal Differentiation and Vascular Interaction Gene Expression (A) GFP-spMN isolation schematic. Nuclear GFP expressing spNPCs seeded on top channel with isogenic non-GFP expressing BMECs on bottom. FACS conducted on FITC to purify neural cells after BMEC co-culture. (B) Single population histogram of Chips seeded only with non-GFP BMECs (black) or GFP-spMNs (green) that defined negative and positive fractions, respectively. Number of events is displayed on y axis and FITC intensity on x axis. (C) Mean RPKM data of previously published BMECs (black), purified neural cells incubated in the Spinal Cord-Chip alone (blue) or in the presence of BMECs (orange). Canonical markers are claudin 5 (CLDN5), occluding (OCLN), Tight junction protein 1 (TJP1), Glut-1 (SLC2A1), von Willebrand factor (VWF), Tie2 receptor (TEK), endoglin (ENG), and melanoma cell adhesion molecule (MCAM). (D) Principal component (PC) analysis plots of PCs 1 and 2 (top) and PCs 2 and 3 (bottom). Arrows indicate weighting along the axis of each respective PC. (E) Top 200 ranked genes from each PC displayed as Z score calculated across all conditions for each row and indicated by colorimetric scale. Each PC was entered into DAVID ontology pathway analysis and the top seven categories listed for each PC. The number of genes (count) in each category is displayed with corrected significance values from DAVID analysis (Bonferroni). (F and G) Differentially expressed genes contributing to the “Response to Protein Stimulus” and “Neural Differentiation” DAVID terms enriched in PC2. RPKM data are averaged across sample replicates and normalized to 96-well plate control. (H and I) Differentially expressed genes contributing to “Vascular Development” and “Extracellular Matrix” DAVID terms enriched in PC3.
Figure 5
Figure 5
BMECs Induce Vascular Interaction Gene Expression in Spinal Cord-Chip (A) Principle component (PC) analysis comparing expression data of differentially expressed genes from PC2 and PC3 and including in vivo adult laser-captured spMNs (green), in vivo fetal spinal cord (purple), and in vitro experimental data (black, gray, yellow, blue, and orange). (B) Heatmap of top ranking genes from Dev-PC2 that describe variance in fetal gene expression. Z score calculated from log2 RPKM data per gene row and displayed by colorimetric scale. (C) Representative images of 96-well plate (96-well) and Spinal Cord-Chips co-cultured with BMECs (EC/Spinal Cord-Chip) immunostained with SST and spMN markers SMI32 and ISL1. Scale bars, 40 μm. (D) Whole-mount image of day-67 human fetal spinal cord (top) immunostained with SST, SMI32, and ISL1; (bottom) ventral horn ISL1-positive spMN pool (box) co-expressing SST. Scale bars, 200 μm (top) and 40 μm (bottom).

References

    1. Akhtar A.A., Sances S., Barrett R., Breunig J.J. Organoid and organ-on-a-chip systems: new paradigms for modeling neurological and gastrointestinal disease. Curr. Stem Cell Rep. 2017;3:98–111. - PMC - PubMed
    1. Avior Y., Sagi I., Benvenisty N. Pluripotent stem cells in disease modelling and drug discovery. Nat. Rev. Mol. Cell Biol. 2016;17:170–182. - PubMed
    1. Batra R., Hutt K., Vu A., Rabin S.J., Baughn M.W., Libby R.T., Hoon S., Ravits J., Yeo G.W. Gene expression signatures of sporadic ALS motor neuron populations. bioRxiv. 2016
    1. Bhatia S.N., Ingber D.E. Microfluidic organs-on-chips. Nat. Biotechnol. 2014;32:760–772. - PubMed
    1. Birey F., Andersen J., Makinson C.D., Islam S., Wei W., Huber N., Fan H.C., Metzler K.R.C., Panagiotakos G., Thom N. Assembly of functionally integrated human forebrain spheroids. Nature. 2017;545:54–59. - PMC - PubMed

Publication types