. 2018 Apr:427:4-10.
doi: 10.1016/j.ijms.2017.08.016. Epub 2017 Sep 1.

Subnanogram proteomics: impact of LC column selection, MS instrumentation and data analysis strategy on proteome coverage for trace samples

Affiliations

Subnanogram proteomics: impact of LC column selection, MS instrumentation and data analysis strategy on proteome coverage for trace samples

Ying Zhu et al. Int J Mass Spectrom. 2018 Apr.

Abstract

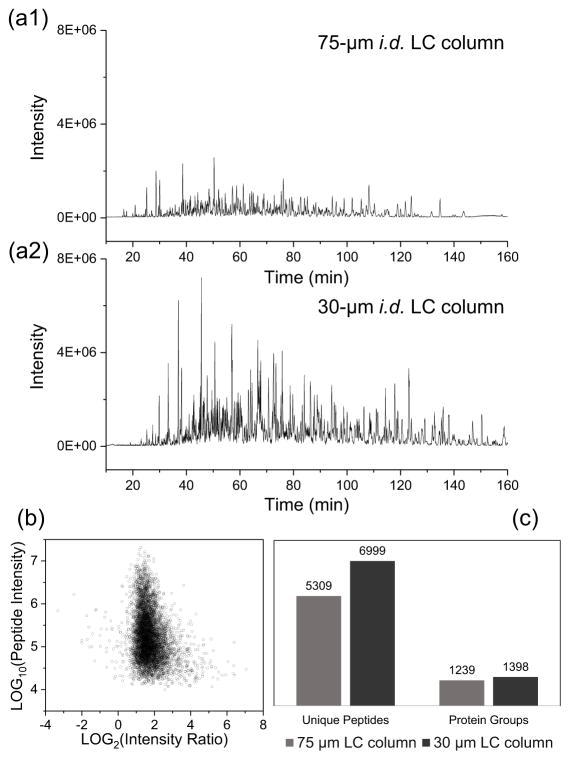
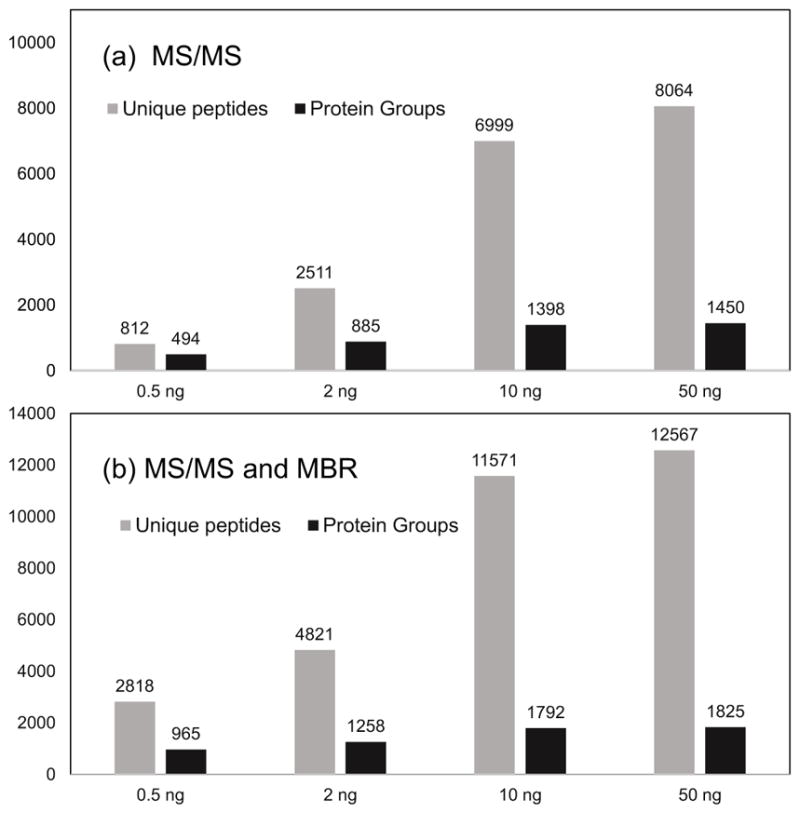
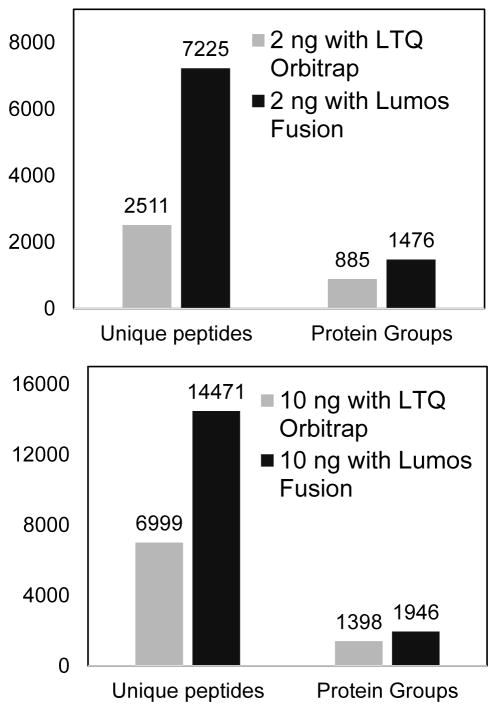
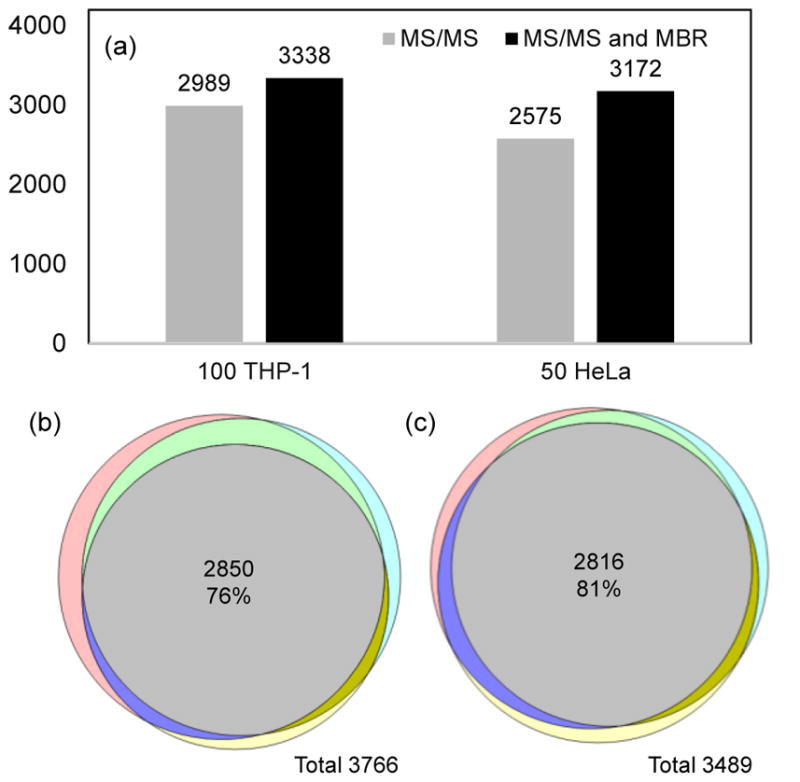
One of the greatest challenges for mass spectrometry (MS)-based proteomics is the limited ability to analyze small samples. Here we investigate the relative contributions of liquid chromatography (LC), MS instrumentation and data analysis methods with the aim of improving proteome coverage for sample sizes ranging from 0.5 ng to 50 ng. We show that the LC separations utilizing 30-μm-i.d. columns increase signal intensity by >3-fold relative to those using 75-μm-i.d. columns, leading to 32% increase in peptide identifications. The Orbitrap Fusion Lumos MS significantly boosted both sensitivity and sequencing speed relative to earlier generation Orbitraps (e.g., LTQ-Orbitrap), leading to a ~3-fold increase in peptide identifications and 1.7-fold increase in identified protein groups for 2 ng tryptic digests of the bacterium S. oneidensis. The Match Between Runs algorithm of open-source MaxQuant software further increased proteome coverage by ~ 95% for 0.5 ng samples and by ~42% for 2 ng samples. Using the best combination of the above variables, we were able to identify >3,000 proteins from 10 ng tryptic digests from both HeLa and THP-1 mammalian cell lines. We also identified >950 proteins from subnanogram archaeal/bacterial cocultures. The present ultrasensitive LC-MS platform achieves a level of proteome coverage not previously realized for ultra-small sample loadings, and is expected to facilitate the analysis of subnanogram samples, including single mammalian cells.

Keywords: Orbitrap Fusion Lumos; match between runs; nanoLC; small cell populations; subnanogram proteomics; ultrasensitive.


Figures

Figure 1
Figure 1
Comparison of LC column size on the performance of proteomic analysis. (a1–a2) Base peak chromatograms of 10-ng tryptic digest of Shewanella oneidensis with (a1) 75-μm and (a2) 30-μm i.d. LC columns and a LTQ-Orbitrap MS. Y axis was fixed at 8E6 to show the signal gain for the 30-μm LC. (b) Peptide intensity ratio between 30-μm and 75-μm i.d. LC. Each point in the chart corresponds to a peptide identified from both LC columns. (c) The number of unique peptides and protein groups identified with 75-μm and 30-μm LC columns. In each condition, two replicates were analyzed and averaged to generate results. LC conditions: 30-μm i.d. column operated at 60 nL/min; 75-μm i.d. column operated at 350 nL/min; a 150-min gradient from 5% to 28% Buffer B was used
Figure 2
Figure 2
Evaluation of the sensitivity of 30-μm i.d. column LC and LTQ-Orbitrap MS with various sample loading amounts from 0.5 ng to 50 ng tryptic digest of S. oneidensis. (a–b) Peptide and protein identification results with (a) MS/MS only and (b) combined MS/MS with match between runs (MBR). For each condition, at least two replicates were analyzed and averaged to generate the results. LC conditions: 30-μm i.d. column operated at 60 nL/min and a 150-min gradient from 5% to 28% Buffer B
Figure 3
Figure 3
Proteomic profiling of (a) 2 ng and (b) 10 ng tryptic digestion of Shewanella oneidensis with LTQ-Orbitrap and Lumos Fusion MS. LC conditions: 30-μm i.d. column operated at 60 nL/min and a 150-min gradient from 5% to 28% buffer B.
Figure 4
Figure 4
(a) Protein identification from tryptic digestions equivalent to 100 THP-1 and 50 HeLa cells with or without MBR algorithm. (b–c) Venn diagrams showing the protein overlaps in triplicate runs of cell lysates equivalent to (b) 100 THP-1 and (c) 50 HeLa cells. LC conditions: 30-μm i.d. column operated at 60 nL/min and a 150-min gradient from 5% to 28% buffer B. Lumos Fusion MS was used for data acquisition.

References

    1. Mann M, Kulak NA, Nagaraj N, Cox J. The coming age of complete, accurate, and ubiquitous proteomes. Mol Cell. 2013;49:583–590. doi: 10.1016/j.molcel.2013.01.029. - DOI - PubMed
    1. Ong SE, Mann M. Mass spectrometry-based proteomics turns quantitative. Nat Chem Biol. 2005;1:252–262. doi: 10.1038/nchembio736. - DOI - PubMed
    1. Wulfkuhle JD, Liotta La, Petricoin EF. Proteomic applications for the early detection of cancer. Nat Rev Cancer. 2003;3:267–275. doi: 10.1038/nrc1043. - DOI - PubMed
    1. Li S, Plouffe BD, Belov AM, Ray S, Wang X, Murthy SK, Karger BL, Ivanov AR. An integrated platform for isolation, processing, and mass spectrometry-based proteomic profiling of rare cells in whole blood. Mol Cell Proteomics. 2015;14:1672–1683. doi: 10.1074/mcp.M114.045724. - DOI - PMC - PubMed
    1. Waanders LF, Chwalek K, Monetti M, Kumar C, Lammert E, Mann M. Quantitative proteomic analysis of single pancreatic islets. Proc Natl Acad Sci USA. 2009;106:18902–18907. doi: 10.1073/pnas.0908351106. 0908351106 [pii]\n. - DOI - PMC - PubMed

LinkOut - more resources