

Theoretical vs. empirical discriminability: the application of ROC methods to eyewitness identification
- PMID: 29577072
- PMCID: PMC5849663
- DOI: 10.1186/s41235-018-0093-8
Theoretical vs. empirical discriminability: the application of ROC methods to eyewitness identification
Abstract
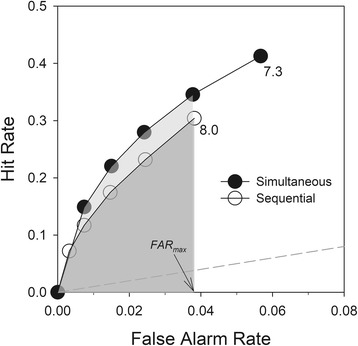
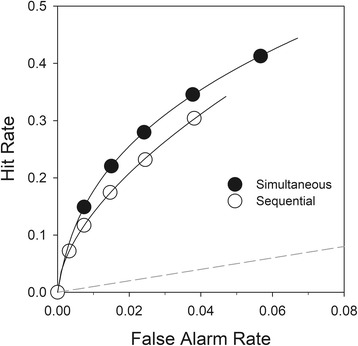
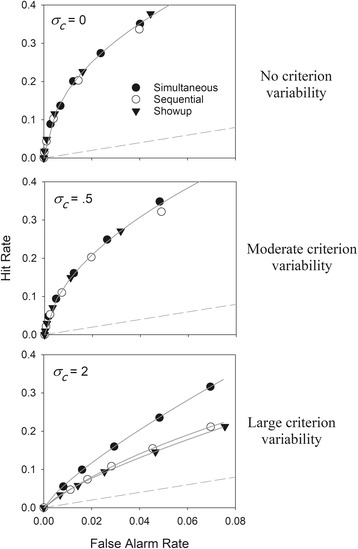
Receiver operating characteristic (ROC) analysis was introduced to the field of eyewitness identification 5 years ago. Since that time, it has been both influential and controversial, and the debate has raised an issue about measuring discriminability that is rarely considered. The issue concerns the distinction between empirical discriminability (measured by area under the ROC curve) vs. underlying/theoretical discriminability (measured by d' or variants of it). Under most circumstances, the two measures will agree about a difference between two conditions in terms of discriminability. However, it is possible for them to disagree, and that fact can lead to confusion about which condition actually yields higher discriminability. For example, if the two conditions have implications for real-world practice (e.g., a comparison of competing lineup formats), should a policymaker rely on the area-under-the-curve measure or the theory-based measure? Here, we illustrate the fact that a given empirical ROC yields as many underlying discriminability measures as there are theories that one is willing to take seriously. No matter which theory is correct, for practical purposes, the singular area-under-the-curve measure best identifies the diagnostically superior procedure. For that reason, area under the ROC curve informs policy in a way that underlying theoretical discriminability never can. At the same time, theoretical measures of discriminability are equally important, but for a different reason. Without an adequate theoretical understanding of the relevant task, the field will be in no position to enhance empirical discriminability.
Keywords: Discriminability; Eyewitness identification; ROC analysis; Sequential lineups; Simultaneous lineups.
Conflict of interest statement
Not applicableNot applicableThe authors declare that they have no competing interests.
Figures
Similar articles
-
Eyewitness identification in simultaneous and sequential lineups: an investigation of position effects using receiver operating characteristics.Memory. 2018 Oct;26(9):1297-1309. doi: 10.1080/09658211.2018.1464581. Epub 2018 Apr 20. Memory. 2018. PMID: 29676666
-
Fair lineups are better than biased lineups and showups, but not because they increase underlying discriminability.Law Hum Behav. 2017 Apr;41(2):127-145. doi: 10.1037/lhb0000219. Epub 2016 Sep 29. Law Hum Behav. 2017. PMID: 27685645
-
Distinguishing Between Investigator Discriminability and Eyewitness Discriminability: A Method for Creating Full Receiver Operating Characteristic Curves of Lineup Identification Performance.Perspect Psychol Sci. 2020 May;15(3):589-607. doi: 10.1177/1745691620902426. Epub 2020 May 6. Perspect Psychol Sci. 2020. PMID: 32375014
-
Clarifying the effects of sequential item presentation in the police lineup task.Cognition. 2024 Sep;250:105840. doi: 10.1016/j.cognition.2024.105840. Epub 2024 Jun 21. Cognition. 2024. PMID: 38908303 Review.
-
A re-examination of the effects of biased lineup instructions in eyewitness identification.Law Hum Behav. 2005 Aug;29(4):395-424. doi: 10.1007/s10979-005-5690-7. Law Hum Behav. 2005. PMID: 16133947 Review.
Cited by
-
Measuring memory is harder than you think: How to avoid problematic measurement practices in memory research.Psychon Bull Rev. 2023 Apr;30(2):421-449. doi: 10.3758/s13423-022-02179-w. Epub 2022 Oct 19. Psychon Bull Rev. 2023. PMID: 36260270 Free PMC article. Review.
-
Testing encoding specificity and the diagnostic feature-detection theory of eyewitness identification, with implications for showups, lineups, and partially disguised perpetrators.Cogn Res Princ Implic. 2021 Mar 3;6(1):14. doi: 10.1186/s41235-021-00276-3. Cogn Res Princ Implic. 2021. PMID: 33660118 Free PMC article.
-
Misinformation effects in an online sample: results of an experimental study with a five day retention interval.PeerJ. 2021 Nov 18;9:e12299. doi: 10.7717/peerj.12299. eCollection 2021. PeerJ. 2021. PMID: 34820164 Free PMC article.
-
Toward a more comprehensive modeling of sequential lineups.Cogn Res Princ Implic. 2022 Jul 22;7(1):65. doi: 10.1186/s41235-022-00397-3. Cogn Res Princ Implic. 2022. PMID: 35867241 Free PMC article.
-
Ready to ROC? A tutorial on simulation-based power analyses for null hypothesis significance, minimum-effect, and equivalence testing for ROC curve analyses.Behav Res Methods. 2025 Mar 18;57(4):120. doi: 10.3758/s13428-025-02646-x. Behav Res Methods. 2025. PMID: 40102332 Free PMC article.
References
-
- Amendola KL, Wixted JT. Comparing the diagnostic accuracy of suspect identifications made by actual eyewitnesses from simultaneous and sequential lineups in a randomized field trial. Journal of Experimental Criminology. 2015;11:263–284. doi: 10.1007/s11292-014-9219-2. - DOI
-
- Amendola KL, Wixted JT. The role of site variance in the American Judicature Society field study comparing simultaneous and sequential lineups. Journal of Quantitative Criminology. 2017;33:1–19. doi: 10.1007/s10940-015-9273-6. - DOI
-
- Andersen SM, Carlson CA, Carlson M, Gronlund SD. Individual differences predict eyewitness identification performance. Personality and Individual Differences. 2014;60:36–40. doi: 10.1016/j.paid.2013.12.011. - DOI
-
- Carlson CA, Carlson MA. An evaluation of perpetrator distinctiveness, weapon presence, and lineup presentation using ROC analysis. Journal of Applied Research in Memory and Cognition. 2014;3:45–53. doi: 10.1016/j.jarmac.2014.03.004. - DOI
Publication types
LinkOut - more resources
Full Text Sources
Other Literature Sources