

Considerations on accuracy, pattern and possible underlying factors of brain microbleed progression in older adults with absence or mild presence of vascular pathology
- PMID: 29578354
- PMCID: PMC6135998
- DOI: 10.1177/0300060518755623
Considerations on accuracy, pattern and possible underlying factors of brain microbleed progression in older adults with absence or mild presence of vascular pathology
Abstract
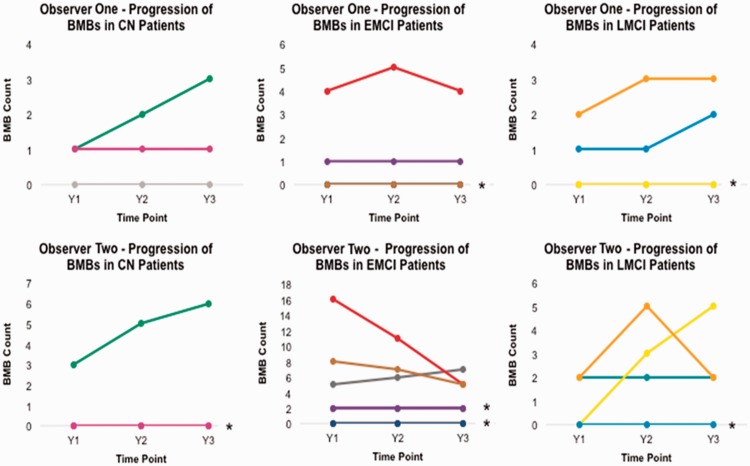
Objective To analyse brain microbleed (BMB) progression, its possible underlying factors, and the influence of inter-observer differences, in older individuals with none or mild vascular pathology. Methods This study analysed magnetic resonance images, cognitive, demographic and laboratory data from all individuals from the Alzheimer's Disease (AD) Neuroimaging Initiative database who had the required sequences for identifying BMBs over three consecutive years at the time the database was accessed (January 2016). BMBs were assessed independently by two observers with similar levels of experience. Results A total of 291 patients were included in the study. The number of individuals with BMBs and the number of BMBs per individual slightly and nonsignificantly increased across three consecutive years (Y1: 55/291 [19%]; Y2: 61/291 [21%]; Y3: 66/291 [23%]) with 1-2 BMBs and (Y1: 11/291 [4%]; Y2: 12/291 [4%]; Y3: 14/291 [5%]) with ≥ 3 BMBs. Both observers identified a similar pattern of BMB prevalence and progression in each cognitive group (normal < early/late mild cognitive impairment (MCI) > AD patients) despite inter-observer differences (1.5 BMBs, 95% confidence interval -3.7, 6.2], κ=0.543), which were mainly in the cortex. Serum cholesterol was the main predictor of change in BMB count between time-points but did not predict overall progression. Conclusions Inter-observer differences are always present and it is difficult to ascertain their influence in the analysis of BMB progression, which was observed in cognitively normal and MCI individuals, but not in AD patients. This should be confirmed in further studies.
Keywords: Microbleeds; ageing; inter-observer differences; longitudinal; magnetic resonance imaging; progression.
Figures


References
-
- Hardy J, Selkoe DJ. The amyloid hypothesis of Alzheimer's disease: progress and problems on the road to therapeutics. Science 2002; 297: 353–356. - PubMed
-
- de la Torre JC, Mussivand T. Can disturbed brain microcirculation cause Alzheimer's disease? Neurol Res 1993; 15: 146–153. - PubMed
-
- Clayson L, Valdés Hernández MC, Glatz A, et al. Progression pattern of brain mineral deposition as a differential indicator of cognitive decline. The 2015 Alzheimer's Disease Congress: 23rd–25th June 2015 2015; 34.
MeSH terms
LinkOut - more resources
Full Text Sources
Other Literature Sources
Medical
Research Materials
