. 2018 Mar 26:7:e32208.
doi: 10.7554/eLife.32208.

Neurovascular sequestration in paediatric P. falciparum malaria is visible clinically in the retina

Affiliations

Neurovascular sequestration in paediatric P. falciparum malaria is visible clinically in the retina

Valentina Barrera et al. Elife. .

Abstract

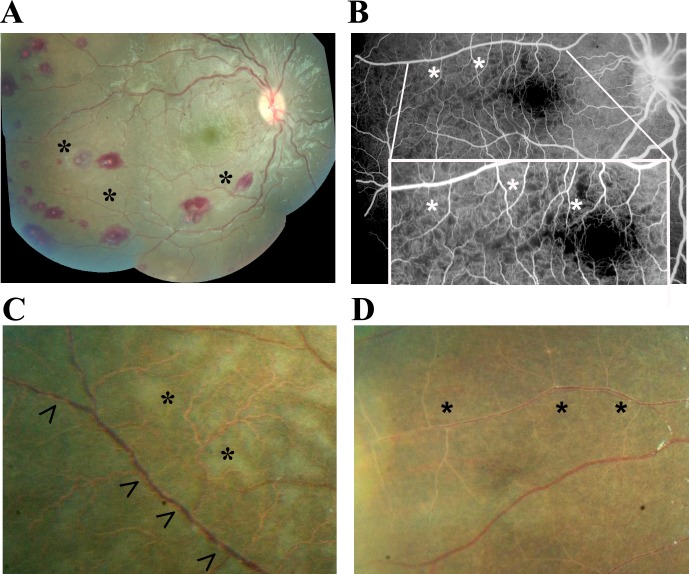
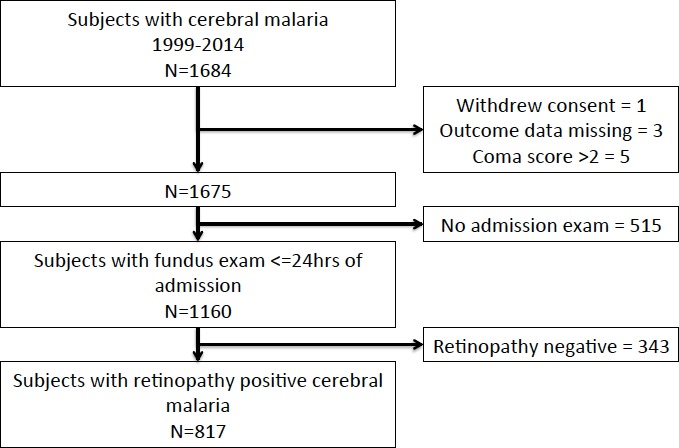
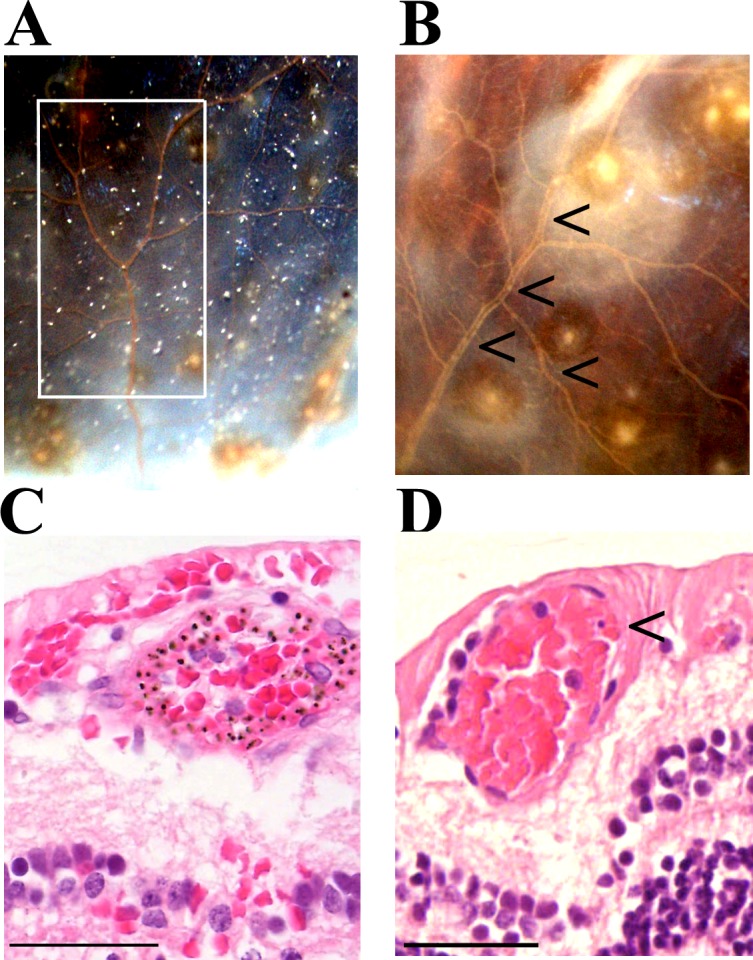
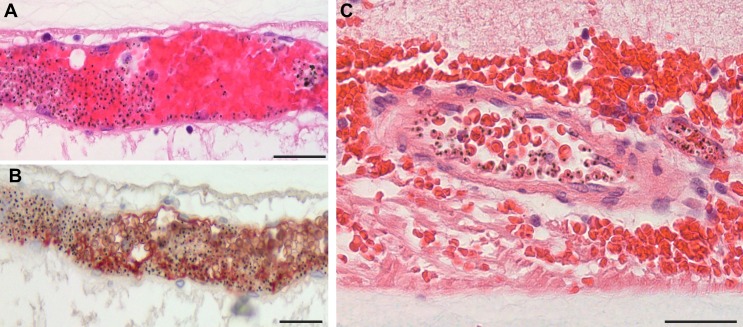
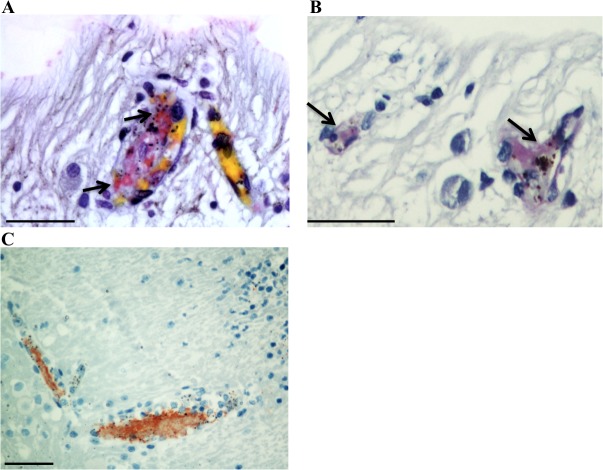
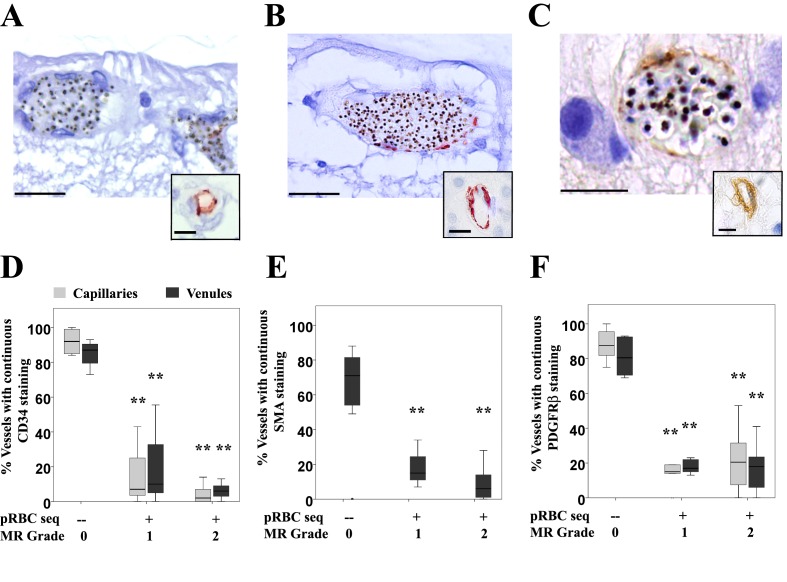
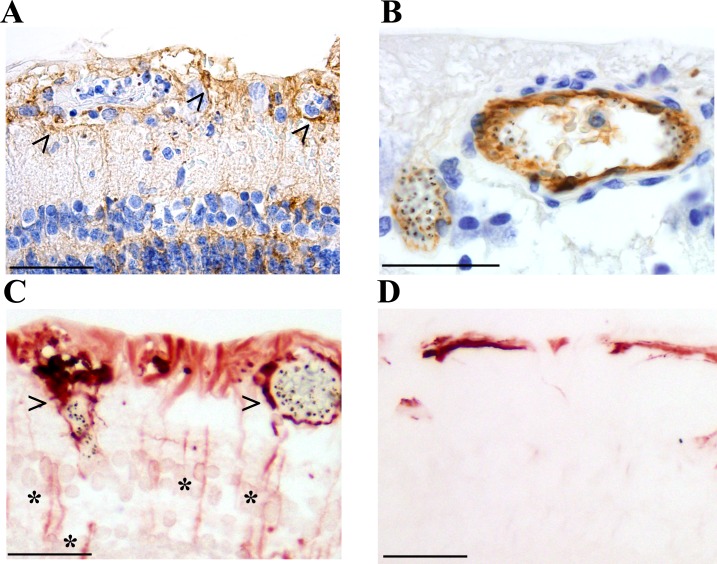
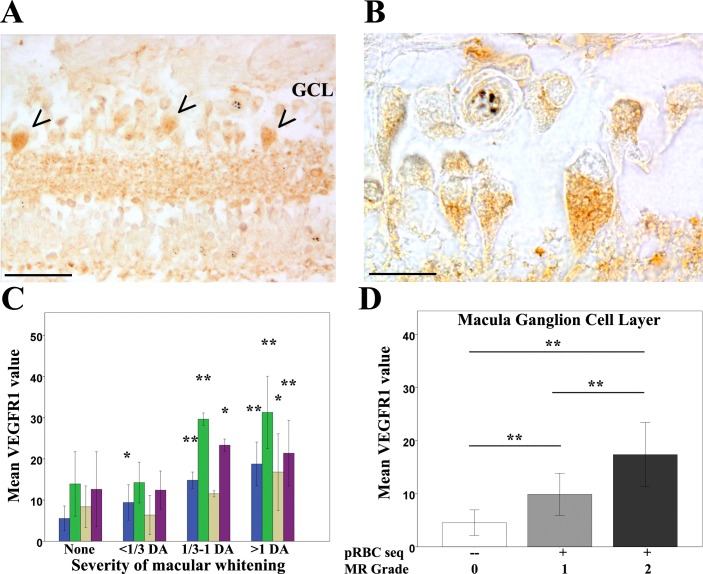
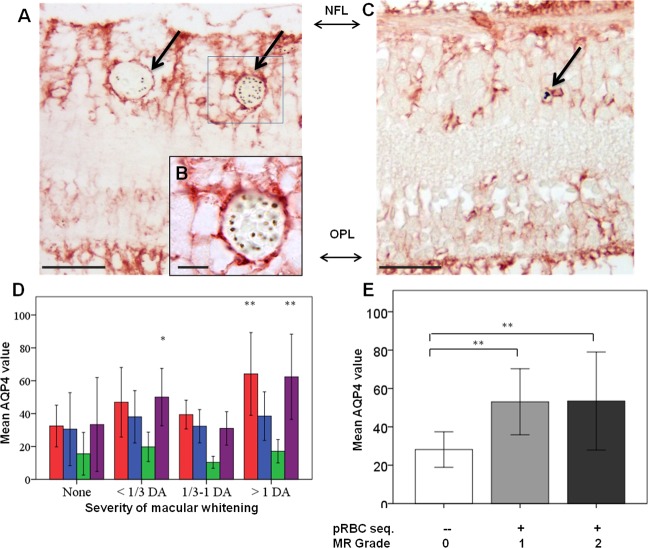
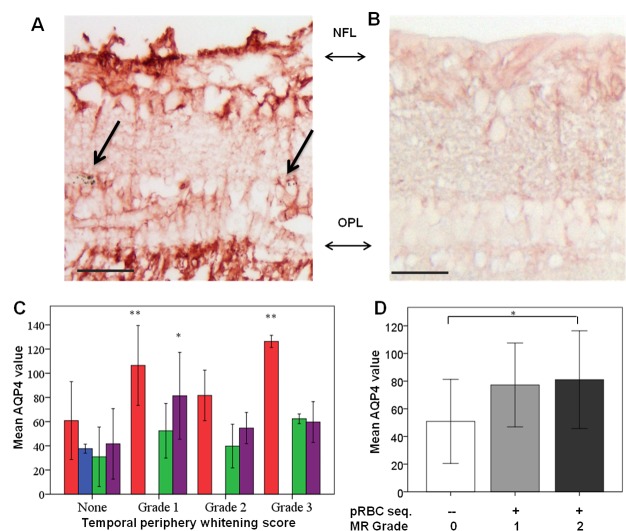
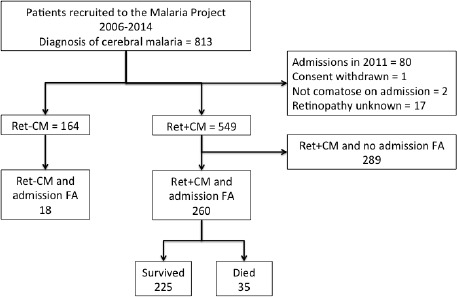
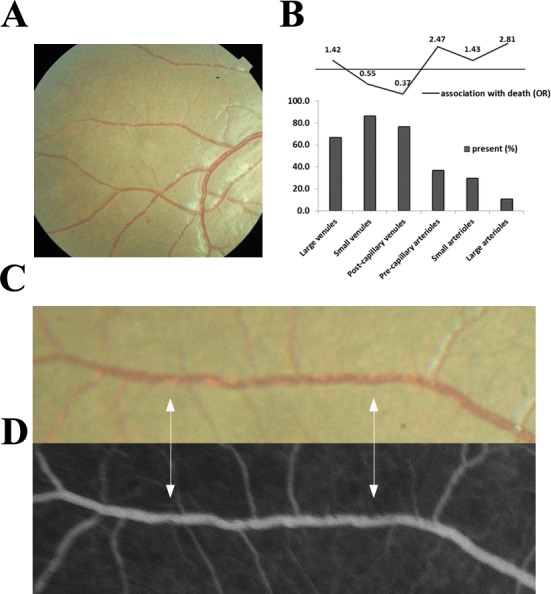
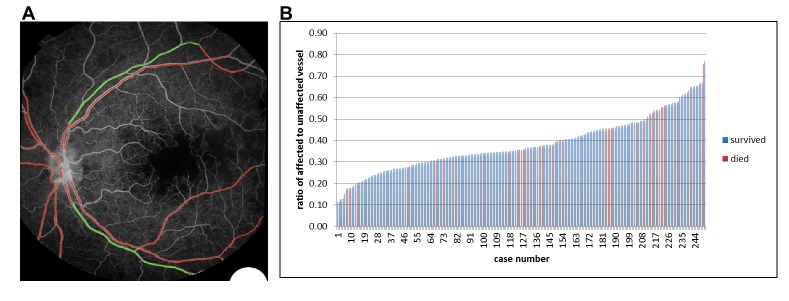
Retinal vessel changes and retinal whitening, distinctive features of malarial retinopathy, can be directly observed during routine eye examination in children with P. falciparum cerebral malaria. We investigated their clinical significance and underlying mechanisms through linked clinical, clinicopathological and image analysis studies. Orange vessels and severe foveal whitening (clinical examination, n = 817, OR, 95% CI: 2.90, 1.96-4.30; 3.4, 1.8-6.3, both p<0.001), and arteriolar involvement by intravascular filling defects (angiographic image analysis, n = 260, 2.81, 1.17-6.72, p<0.02) were strongly associated with death. Orange vessels had dense sequestration of late stage parasitised red cells (histopathology, n = 29; sensitivity 0.97, specificity 0.89) involving 360° of the lumen circumference, with altered protein expression in blood-retinal barrier cells and marked loss/disruption of pericytes. Retinal whitening was topographically associated with tissue response to hypoxia. Severe neurovascular sequestration is visible at the bedside, and is a marker of severe disease useful for diagnosis and management.

Keywords: P. falciparum; blood-retinal barrier; human; human biology; malarial retinopathy; medicine; neuroscience; neurovasculature; paediatric coma; plasmodium falciparum cerebral malaria; sequestration.


Conflict of interest statement

VB, IM, GC, PH, VW, AC, NB, LC, YZ, SB, DM, SK, MM, TT, SH No competing interests declared

Figures

Figure 1.
Figure 1.. Principal features of malarial retinopathy (MR).
(A) Montage image showing MR pathological features, including orange vessels (asterisks), white centred haemorrhages and whitening. (B) Corresponding fluorescein angiogram showing capillary nonperfusion (asterisks) mapping to retinal whitening. (C–D) Colour fundus image of retinopathy positive eyes (C, right; D, left eye; eyes were from different cases) showing orange intravascular material in large (arrowheads), small and postcapillary venules (asterisks), and capillaries; note retinal whitening also present.
Figure 1—figure supplement 1.
Figure 1—figure supplement 1.. Flow chart describing clinical dataset.
Figure 2.
Figure 2.. Vessel changes in malarial retinopathy.
(A–B) Vessel colour changes (panels A-B) and intravascular filling defects (panel B, arrowheads) were identified during gross pathology examination (representative images of superior calotte and PO block from histology cases n. 5 and 7, respectively) N = 12. Abnormal vessels were sampled during gross pathology examination and analysed separately (see marked quadrant in panel A). (C–D) H and E staining of parasitised venules from MR cases sampled by punch biopsies from a retinal quadrant with (panel C shows the same orange vessel as in panel A) and without (panel D, case n. 15) vessel discolouration. (C) The margin of the vessel lumen has a near-complete layer of pigment-containing pRBCs (that stain less intensely pink than the adjacent non-parasitised RBC) on the endothelium. (D) Mild sequestration of pRBCs which is marked by an arrowhead. Scale bars (50 μm, (C–D).
Figure 3.
Figure 3.. Severe pRBC sequestration in large venules and arterioles in MR with visible vessel discolouration.
(A–B) Longitudinal section of large retinal venule from retinal area affected by intravascular filling defects on fluorescein angiography (histopathology case no. 9) analysed by H&E staining (A) and anti-fibrinogen IHC (B). Clusters of pRBC are seen within the vessel lumen and attached to the wall. (C) Cross section of a large retinal arteriole with moderate pRBC sequestration (case n. 5). Arteriole is surrounded by haemorrhage, probably of a venular origin as arteriolar vessel wall appeared intact (in multiple sections). Scale bars: 50 μm (all panels).
Figure 3—figure supplement 1.
Figure 3—figure supplement 1.. Detection of thrombi in post-mortem retinal periphery using a combination of MSB staining (panels A,B; arrows: intravascular thrombi are stained bright pink), and anti-CD61 platelet marker immunostaining (panel C, red stained).
Scale bars: 50 μm.
Figure 4.
Figure 4.. Vascular changes in retinal vessels in malarial retinopathy.
(A–I) Expression of endothelial CD34 (panel A: case n. 3, inset: case n. 25 and D: box plot), pericytic SMA (panel B: case n. 12, inset: case n. 27 and E: box plot) and pericytic PDGFRβ (panel C: case n. 13, inset: case n. 26 and F: box plot) markers. Insets show normal annular staining in absence of pRBC sequestration, whereas this annular pattern is lost in the sequestrated vessels seen in A-C. SMA was only reported for venules as it does not produce an annular staining pattern in normal capillaries: panel E. N = 17 for CD34; N = 29 for SMA and PDGFRβ immunostaining. ANOVA was used to compare means. **p<0.005. Scale bars: 20 μm (A–C), 5 μm (insets).
Figure 5.
Figure 5.. Activation of retinal glial cells in malarial retinopathy (MR).
(A–B) Anti-ICAM-1 staining of MR-positive cases with (case n. 16, panel A) and without (case n. 13, panel B) vessel discolouration. Haematoxylin (blue) counterstain was used. (C–D) Anti-GFAP staining of orange-discoloured vessels in punch biopsy from MR-positive case n. 5, and in MR-negative case n. 25. Haematoxylin counterstaining was omitted here. In A and C, peri-vascular activated astrocytes and Műller cells are marked with arrowheads, and asterisks label Műller cell bodies. Scale bars: 50 μm (all panels).
Figure 6.
Figure 6.. Clinicopathological association between retinal whitening in the macula and increased VEGFR1 expression in malarial retinopathy.
(A–B) Immunostaining pattern in macula affected by whitening (case no 9) (low (A) and high (B) magnification; VEGFR1 +ve ganglion cell bodies indicated by arrowheads). (C) Cluster column chart showing densitometrically assessed intensity of immunoreactivity (‘value’) of VEGFR1 expression plotted by retinal layer against whitening severity, compared with MR –ve cases. Ganglion cell layer = GCL (blue); inner plexiform layer = IPL (green); inner nuclear layer = INL (light brown); outer plexiform layer = OPL (purple). (D) VEGFR1 levels in the GCL plotted against MR severity classification groups (grade 0 = none, 1 = mild, two moderate/severe). Means ± SD are reported in both charts; ANOVA was used to compare means (N = 26). *p≤0.05 and **p≤0.001. Scale bars: 50 μm (panel A); 20 μm (panel B).
Figure 7.
Figure 7.. Clinicopathological association between retinal whitening in the macula and increased AQP4 expression in malarial retinopathy.
(A–C) Immunostaining pattern in the macula with (A-B, case no 13) and without whitening (C, case no 21). Parasitised vessels are marked by arrows. The vertical linear pattern indicates Műller cell immunoreactivity for AQP4. (D) Cluster column chart showing densitometrically assessed intensity of immunoreactivity (‘value’) of AQP4 levels measured by IHC in the macula by retinal layers: nerve fibre layer = NFL (red), ganglion cell layer = GCL (blue), inner plexiform layer = IPL (green), outer plexiform layer = OPL (purple). (E): AQP4 levels in the nerve fibre layer plotted against MR severity classification groups (grade 0 = none, 1 = mild, two moderate/severe). Means ± SD are reported in all graphs; ANOVA was used to compare means (N = 26). *p<0.05 and **p<0.001. Scale bars: 50 μm (panels C, E, F and G); 10 μm (panel D).
Figure 7—figure supplement 1.
Figure 7—figure supplement 1.. Clinicopathological association between retinal whitening in the peripheral retina and increased AQP4 expression in malarial retinopathy.
(A–B) Immunostaining pattern is shown in MR-positive case with whitening (A, case n. 13) and MR-negative case (B, case n. 23). Parasitised vessels are marked by arrows. The vertical linear pattern indicates Műller cell immunoreactivity for AQP4. (C) Cluster column chart showing densitometrically assessed intensity of immunoreactivity (‘value’) of AQP4 levels measured by IHC in the peripheral retina by retinal layers: nerve fibre layer = NFL (red); ganglion cell layer = GCL (blue); inner plexiform layer = IPL (green); outer plexiform layer = OPL (purple). (D) AQP4 levels in the nerve fibre layer plotted against MR severity classification groups (grade 0 = none, 1 = mild, two moderate/severe). For details on grading zones see Appendix 2. Means ± SD are reported in all graphs; ANOVA was used to compare means (N = 26). *p≤0.05 and **p≤0.001. Scale bars: 50 μm (panels A-B).
Figure 8.
Figure 8.. Flow chart describing fluorescein angiography dataset.
Figure 9.
Figure 9.. Visible sequestration in the retinal neurovasculature.
(A–D): Orange intravascular material is seen in the retinal venule (A, C) which co-localises to the intravascular filling defects on fluorescein angiography (D) (see arrows). Chart (B) shows the frequency of visible sequestration in six microvessel types in 259 subjects with retinopathy +ve CM and the odds ratios of death within the admission.
Figure 10.
Figure 10.. Semiautomated quantitative analysis of sequestration by length of affected vessel.
(A) Example image of semiautomated system to show vessels affected by sequestration (red). (B) Chart showing distribution of proportion of detected vessel affected by sequestration related to survival in 251 eyes (one eye per case).
Appendix 1—figure 1.
Appendix 1—figure 1.. Orientation and topographical association in whole eye histology blocks (A) and in eye sections (B), used to perform correlation studies between fundal images and histology.
Appendix 1—figure 2.
Appendix 1—figure 2.. Panel A: retinal structure on light microscopy (H&E staining).
Panel B shows the specific feature of >1 cell thickness in the ganglion cell layer, used to identify the macula.
Appendix 2—figure 1.
Appendix 2—figure 1.. Retinal zones used for clinical grading.

References

    1. Armulik A, Abramsson A, Betsholtz C. Endothelial/pericyte interactions. Circulation Research. 2005;97:512–523. doi: 10.1161/01.RES.0000182903.16652.d7. - DOI - PubMed
    1. Barrera V, Hiscott PS, Craig AG, White VA, Milner DA, Beare NA, MacCormick IJ, Kamiza S, Taylor TE, Molyneux ME, Harding SP. Severity of retinopathy parallels the degree of parasite sequestration in the eyes and brains of malawian children with fatal cerebral malaria. Journal of Infectious Diseases. 2015;211:1977–1986. doi: 10.1093/infdis/jiu592. - DOI - PMC - PubMed
    1. Beare NA, Southern C, Chalira C, Taylor TE, Molyneux ME, Harding SP. Prognostic significance and course of retinopathy in children with severe malaria. Archives of Ophthalmology. 2004;122:1141–1147. doi: 10.1001/archopht.122.8.1141. - DOI - PubMed
    1. Beare NA, Taylor TE, Harding SP, Lewallen S, Molyneux ME. Malarial retinopathy: a newly established diagnostic sign in severe malaria. The American Journal of Tropical Medicine and Hygiene. 2006;75:790–797. - PMC - PubMed
    1. Beare NA, Harding SP, Taylor TE, Lewallen S, Molyneux ME. Perfusion abnormalities in children with cerebral malaria and malarial retinopathy. The Journal of Infectious Diseases. 2009;199:263–271. doi: 10.1086/595735. - DOI - PMC - PubMed

Publication types